Event Calendars may be associated with one or more Metrics. A Calendar's individual Events are displayed on the Metric Viewer under the following conditions:
- The Metric must be associated with the Event Calendar on the Event Calendar Editor.
- Events are shown when the results of the Measurement Date are found to be outside of the Standard Deviation as calculated based on the Metric settings (See Understanding Events for more information).
Individual Events may be hidden by the User with View Access to a Metric (See Hide and Un-hide Events for more information).
The purpose of this article is to guide an Administrator or Power User through the process of associating an Individual Metric with an Event Calendar and providing an example of displayed Events.
NOTE: An Event Calendar can be associated with the Individual Metric only if during its creation the User has chosen "Individual Metrics" in the Applies to list of field. For more information check the Creating an Event Calendar article.
1. Open Event Calendar Editor
Access Admin > Reference Objects > Event Calendars
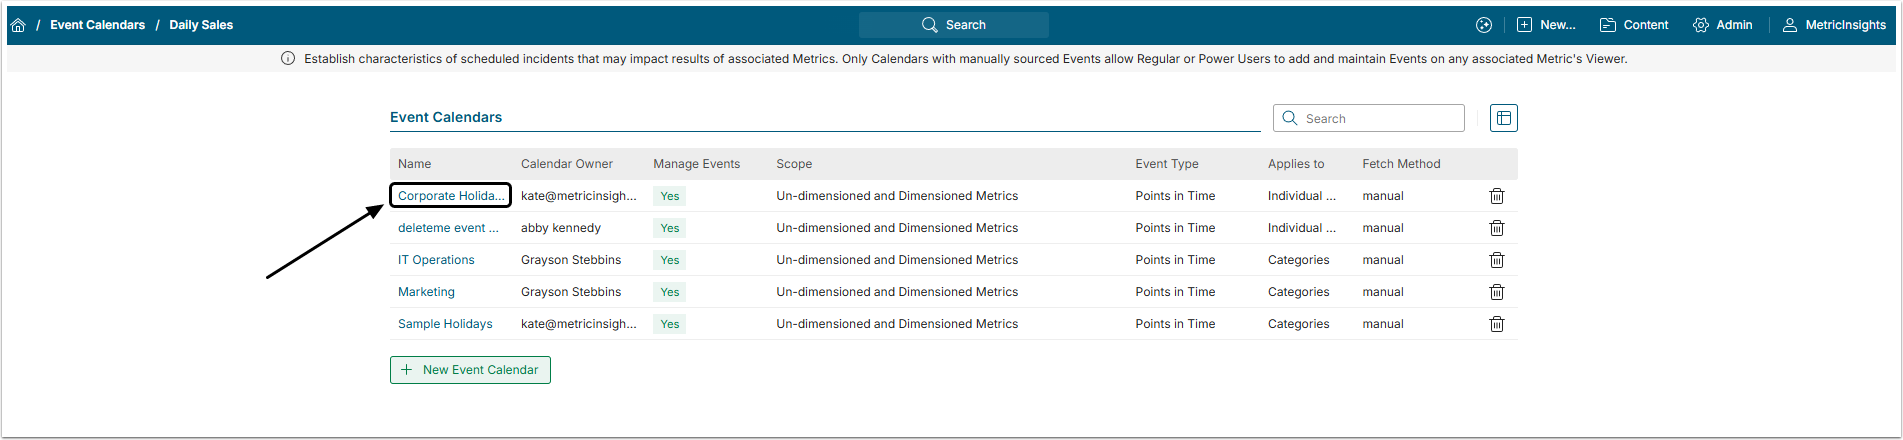
The list of all Event Calendars previously created in the system opens.
Open the required Event Calendar by clicking its Active Name link.
2. Add Associated Metrics to the Event Calendar
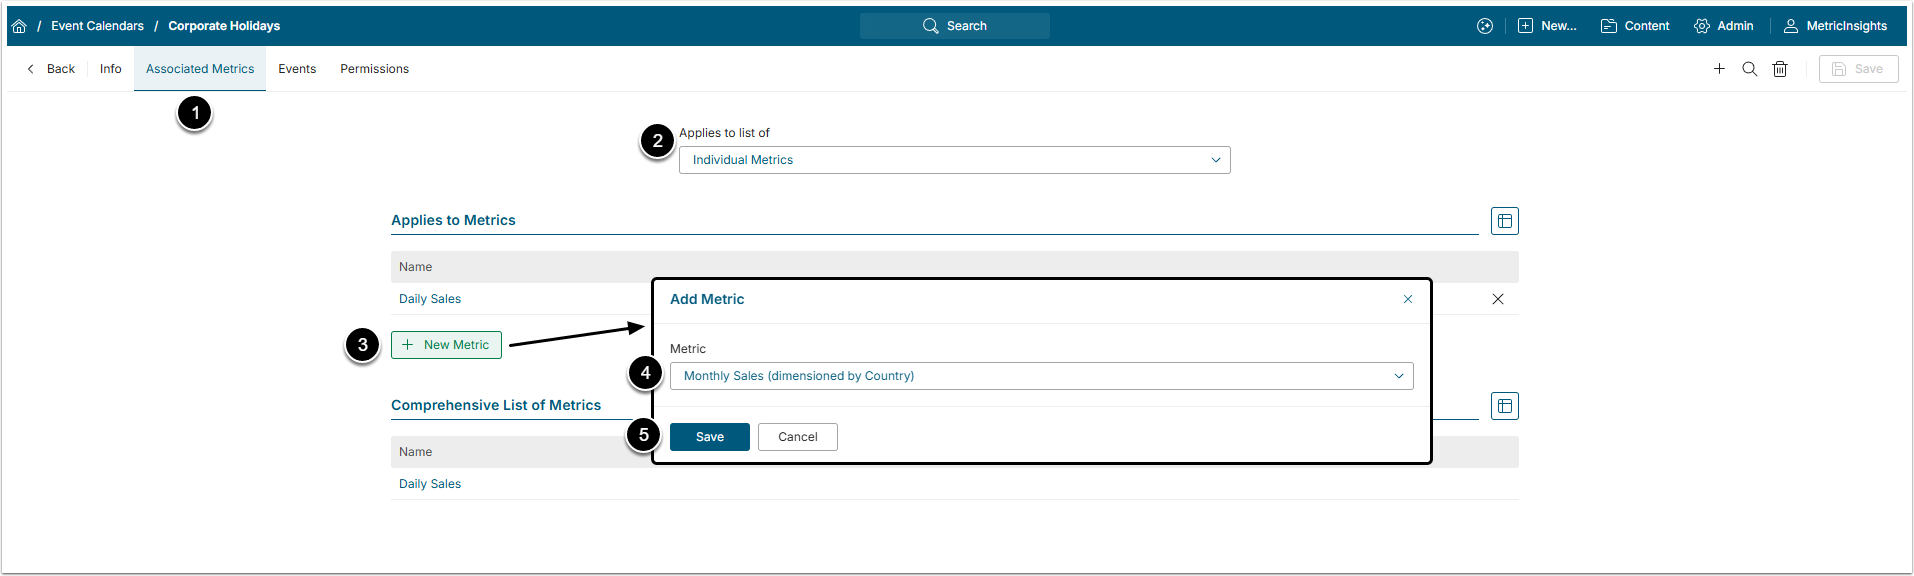
- Open the Associated Metrics tab.
- Make sure that the Applies to list of field is set to 'Individual Metrics' value
- [+ New Metric]
- Metric: Select a required Metric from the drop-down list.
- [Save]
3. Open the Metric Viewer
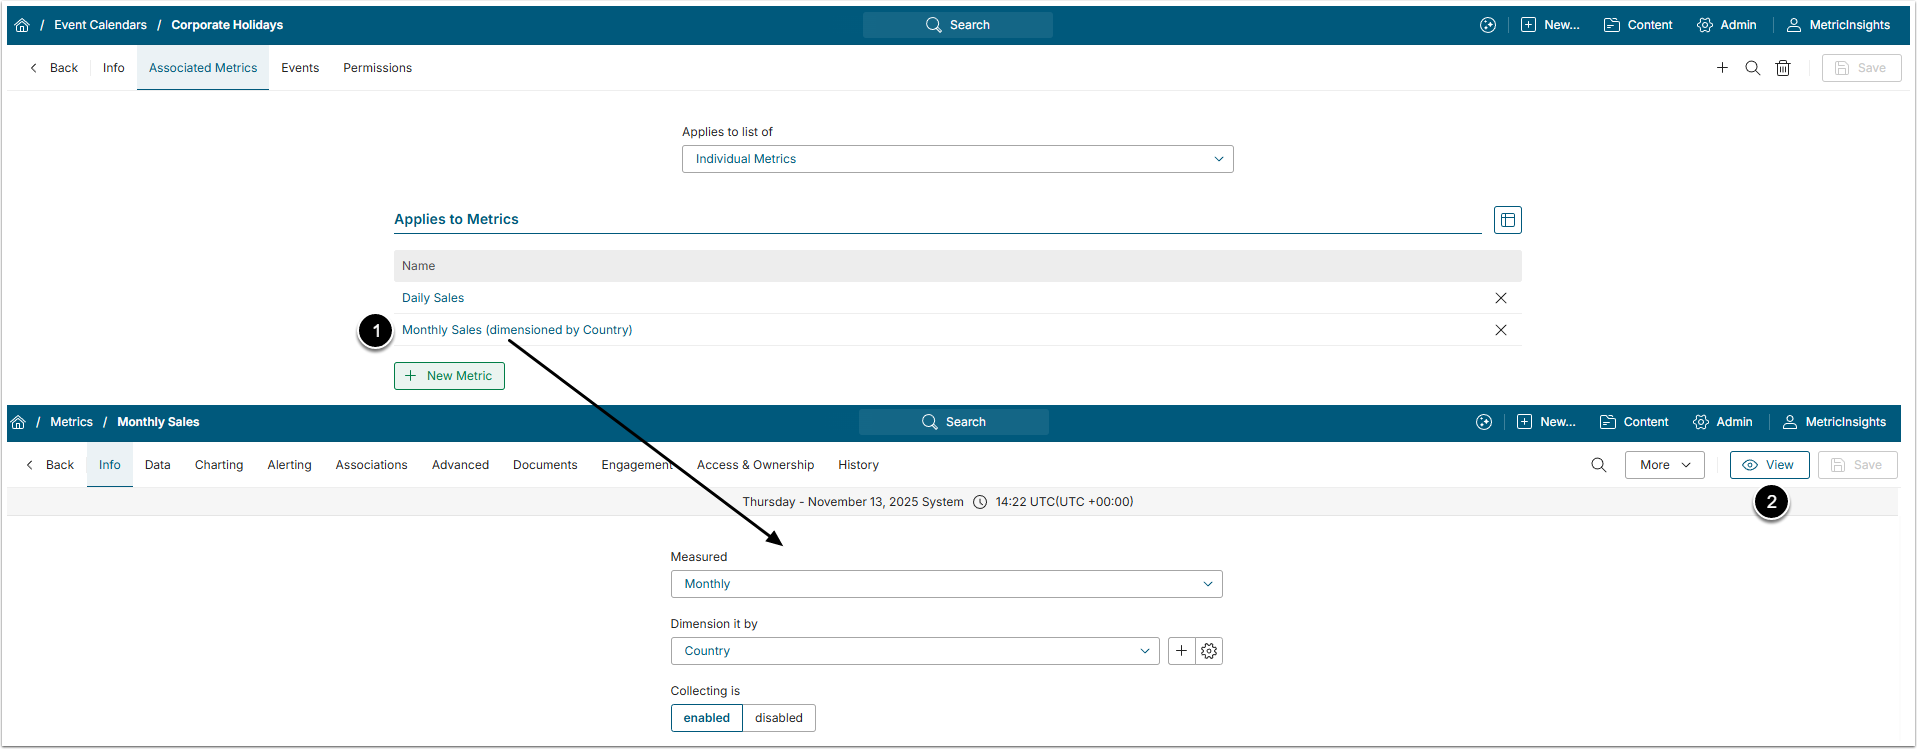
- Click the Metric Active Name link to open the Metric Editor.
- In Metric Editor, click [View].
4. Events on the Metric's Chart
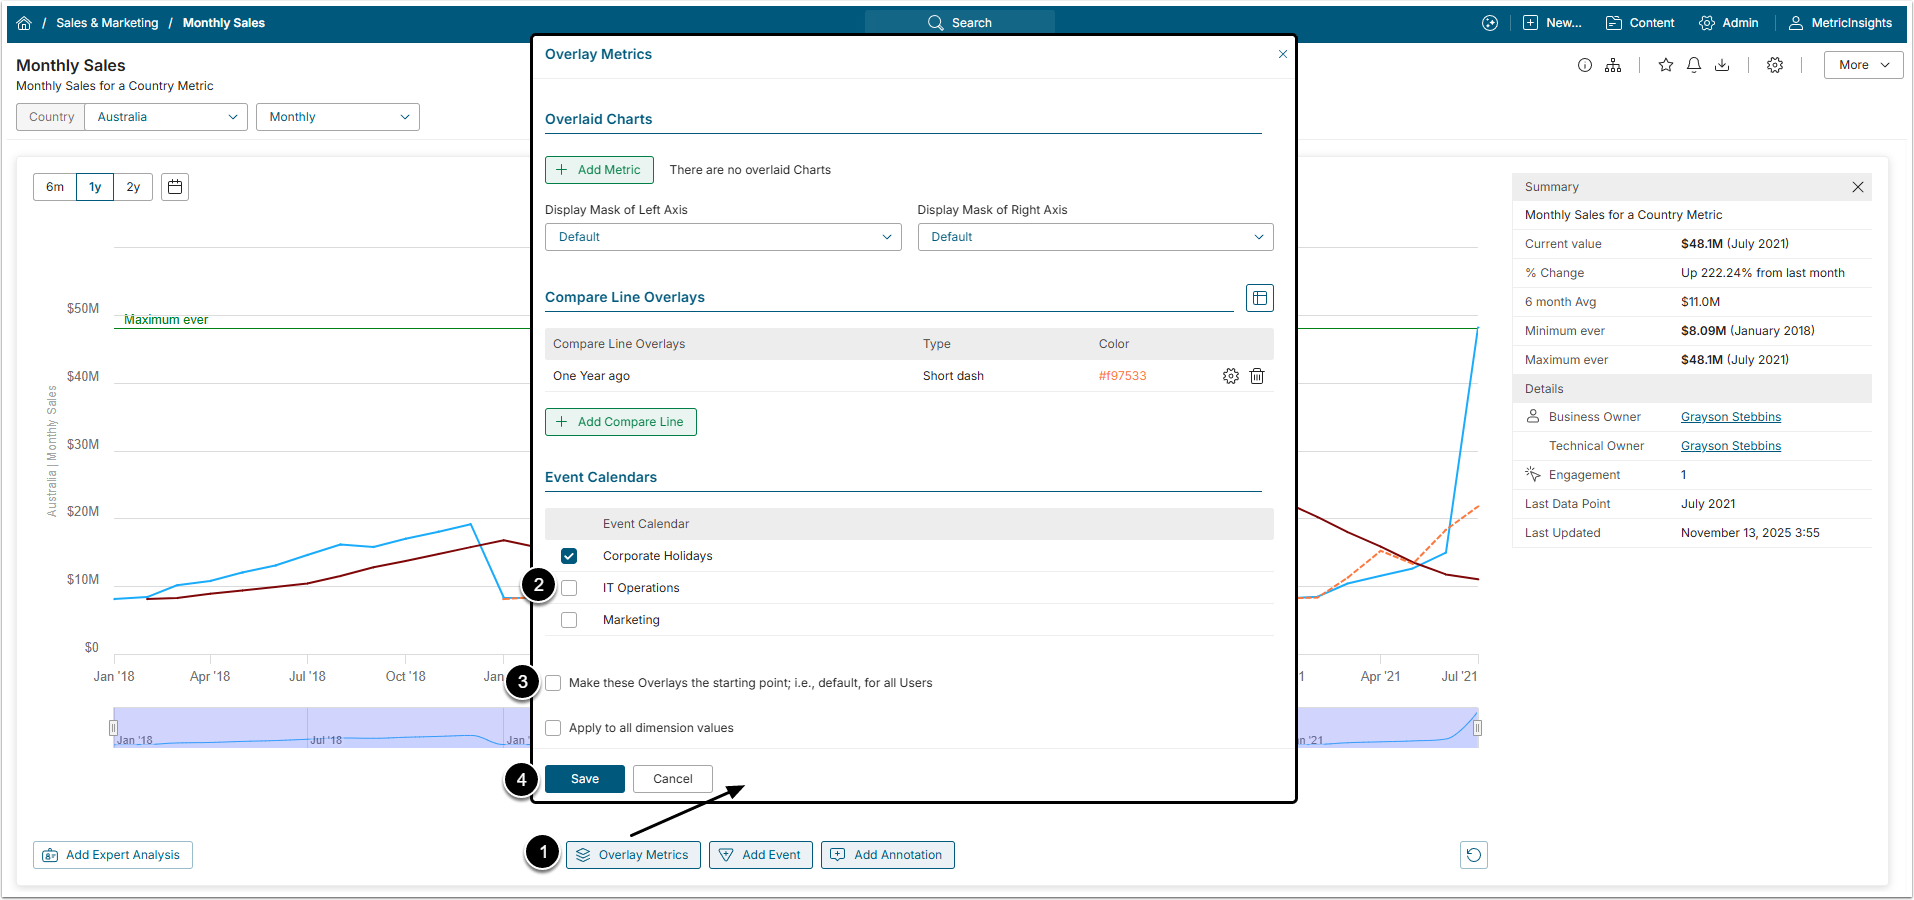
If you wish to hide events from a specific calendar from the chart:
- [Manage Overlays]
- Find an Event Calendars table and define which of the calendars should be shown at the chart by selecting the Event Calendar boxes.
- Make these Overlays the starting point; i.e., default, for all Users: You may also set which Calendar Events other Users will see as default on this Chart.
- [Save]