There are cases when the User would like to hide the Event for himself, leaving it visible to other Users. There are few options to do that and this article describes them one by one.
Rules governing display of Events:
- In general, Key Events are always automatically shown while simple Events are only displayed when determined to be Impacting; i.e., Statistically Significant.
- All other Users continue to see see the Events that you hid.
1. Hiding All Events from the Chart
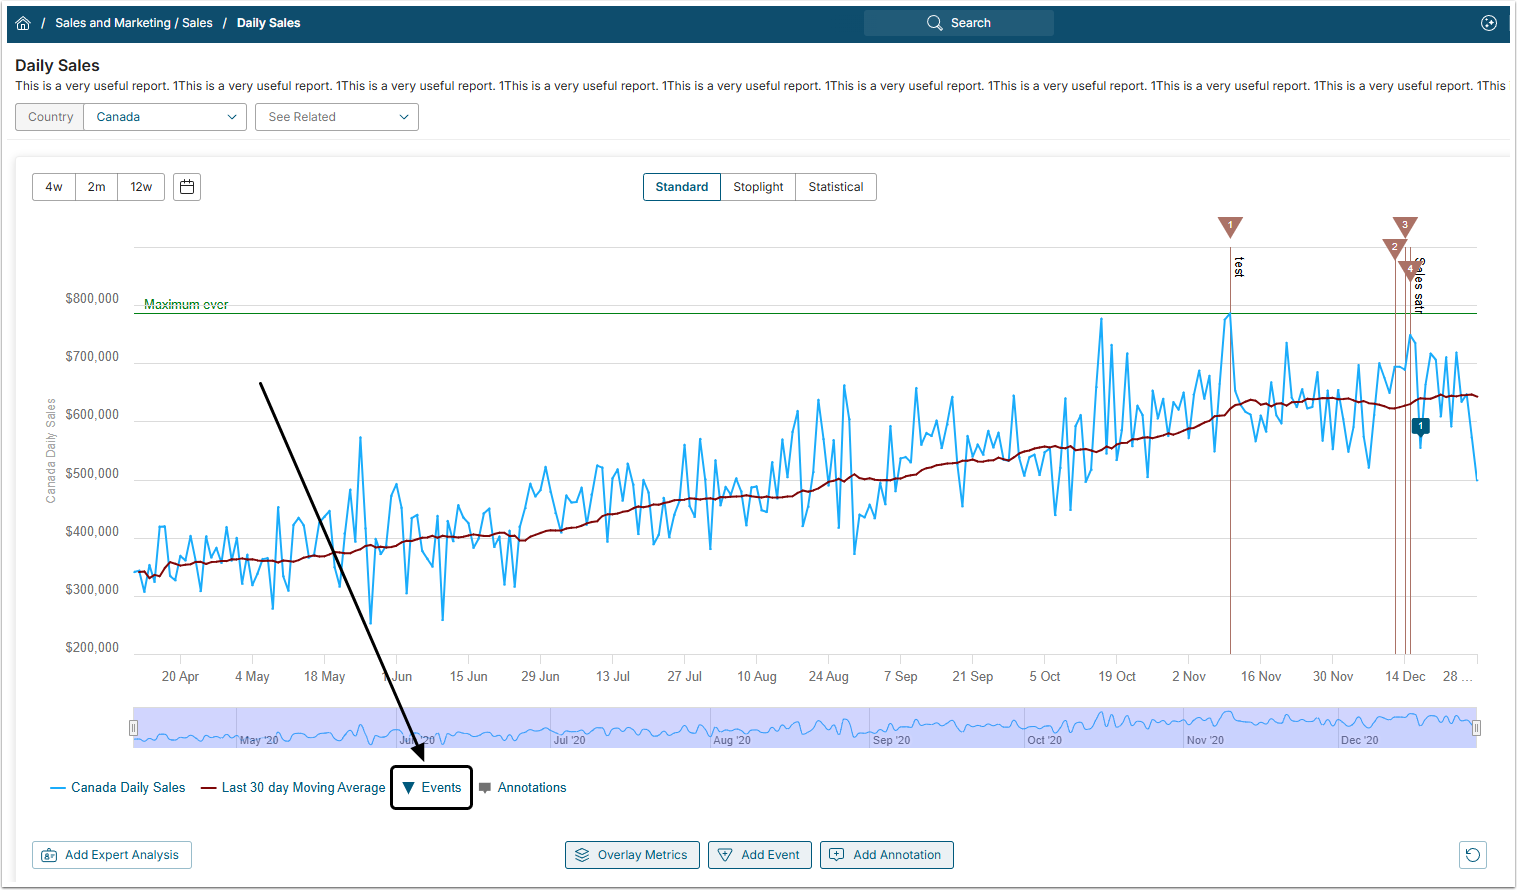
To hide all Events from the Chart, single-click the Events legend button below the Range Selector. Once the Events legend is dimmed, all Events are hidden from the Chart.
To make Events visible again, single-click the Events legend button one more time.
2. Hiding Events from specific Event Calendars
Events from different Event Calendars are usually shown in different colors.
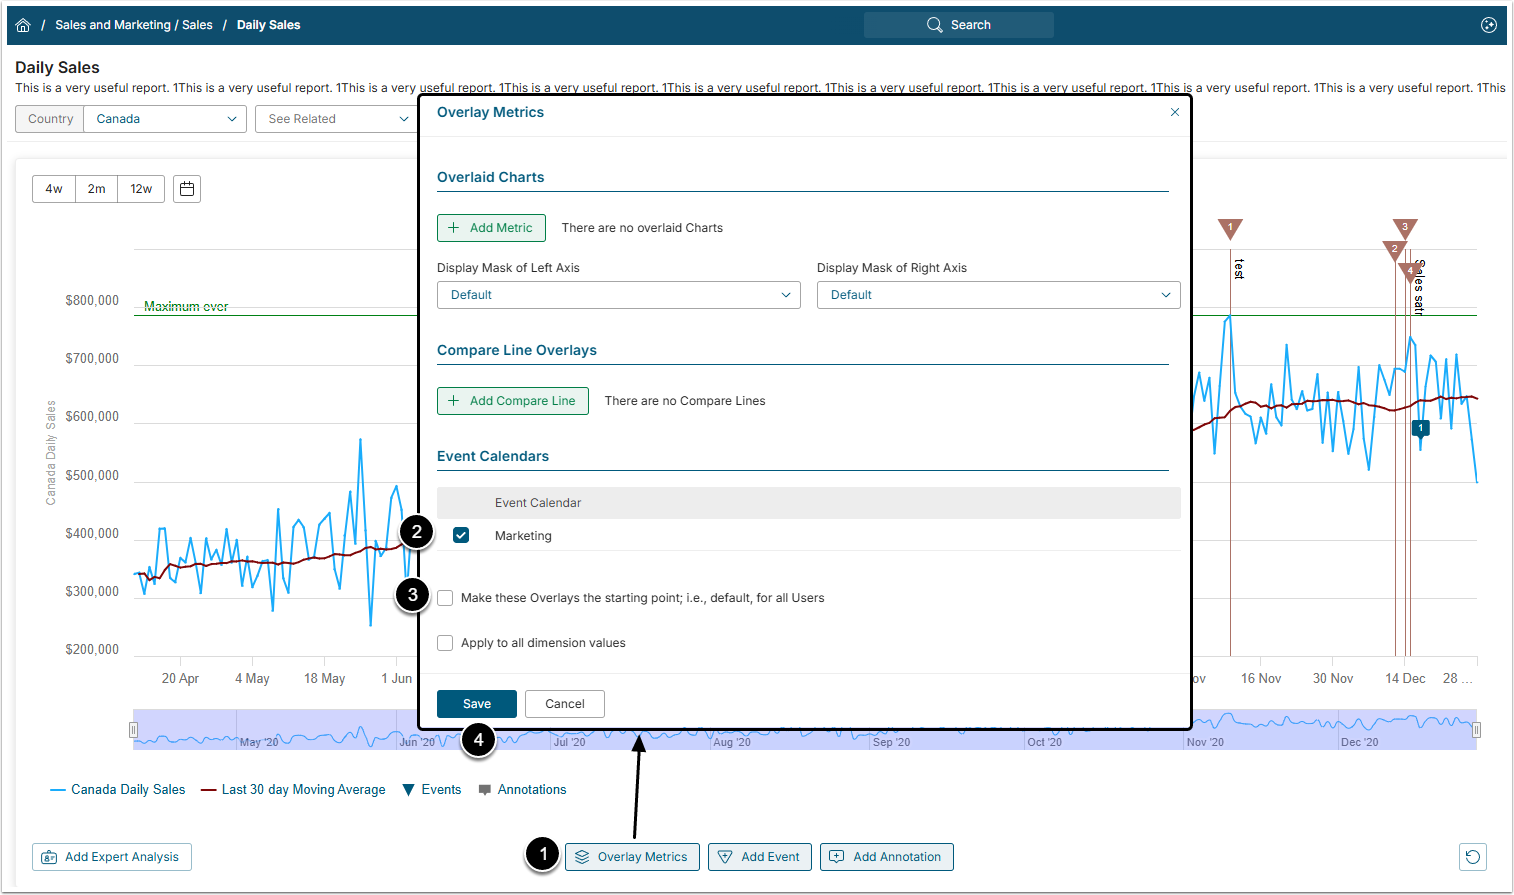
- Сlick [Overlay Metrics] below the Chart legend to open the Overlay Metrics window.
- Find an Event Calendars table and define which of the calendars should be shown at the Сhart by selecting / deselecting respective boxes.
- If you are an Admin User, you can make these settings default for other Users.
- NOTE: Other Users will still be able to set up their custom view though.
- [Save] your changes.