In 7.3.1, creating new Metrics will no longer be supported. All Metric use-cases will be supported via Report Metrics.
A Stoplight is a visual indicator of how well a Metric is doing. This article describes how to set the Stoplights of the Metric.
A Metric can have an underperforming, performing, or outperforming Stoplight indication that is denoted by different background shading in the various Metric Views over time. The Stoplight for the latest available Metric Measurement Value is depicted by the color of the numeric value shown on the tile. In addition, Stoplights can be used to trigger Alerts (for example, if a Metric suddenly enters an underperforming level).
Stoplight values are set by comparing a Metric's most recent Measurement Value to one of the following:
- A fixed value
- A single historical value for the metric; for example, "Value same time last week"
- A computed historical value for the metric; for example, "Average of values collected over the last 30 days"
- A target value; for example, Budgeted value for a given Measurement Time
- A defined range of values
NOTE: Stoplight bands are shown even if Metric is represented as a single data point.
1. Open the Metric Editor
Access the Metric Editor and open the Charting tab
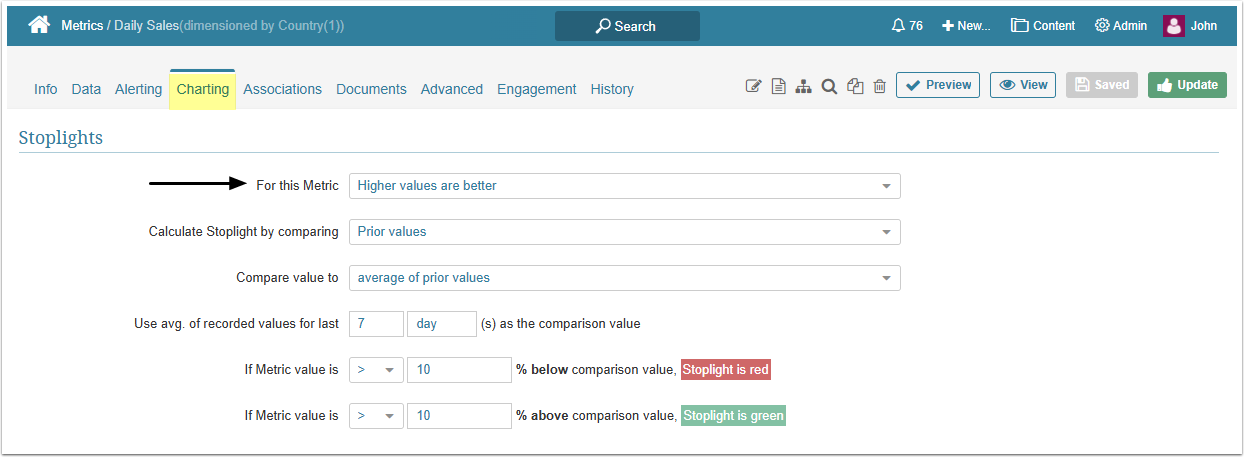
Define the basic Stoplight settings in the For this Metric field.
Stoplight settings are expressed differently based on whether expectations For this Metric are set to 'higher' or 'lower' values (described in Step 2) or if 'measurements should fall within a certain range' (described in Step 3) of values indicating desired results.For example, if you are measuring "Sales", the more sales made, the better; if reporting complaints, the less complaints, the better.
NOTE: If there is 'no expectation for what is better', no other configurations are required.
2. "Higher / Lower Values are Better" Option
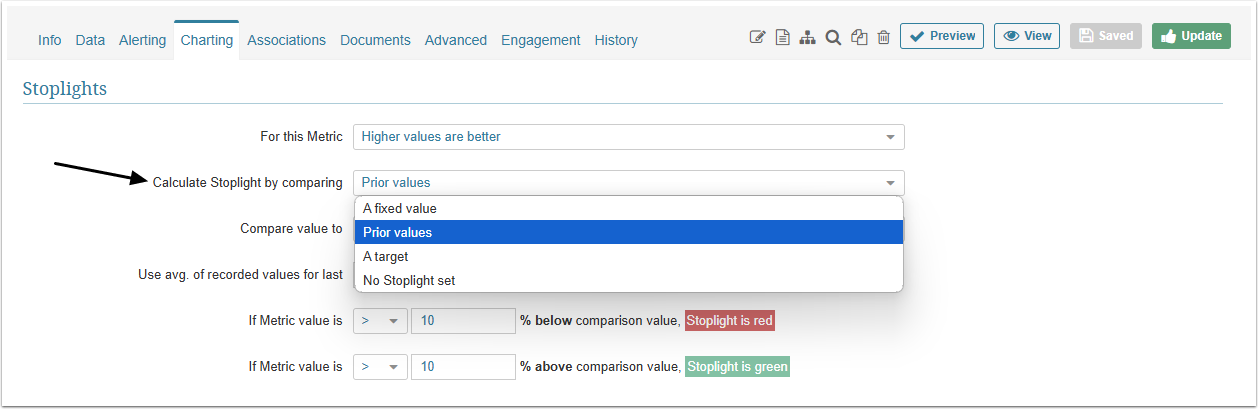
Define the Stoplight calculation method.
2.1. Calculate by Comparing to "A Fixed Value"
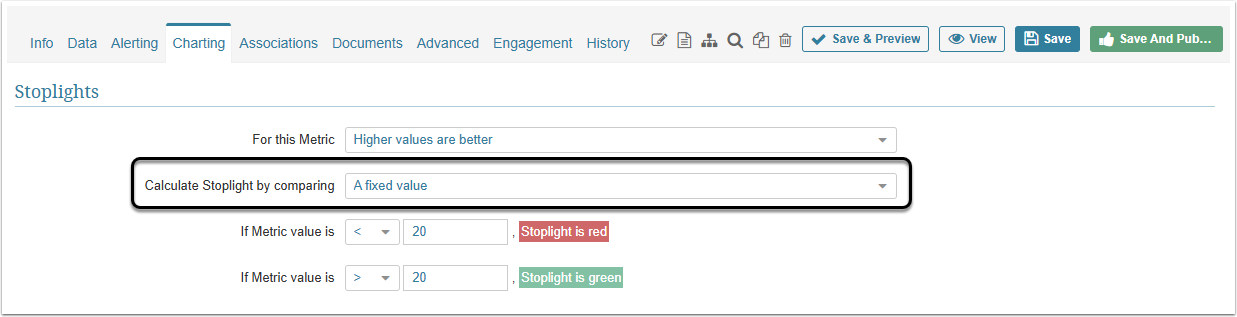
Define specific fixed values to determine underperforming (Stoplight is red) and outperforming (Stoplight is green) results.
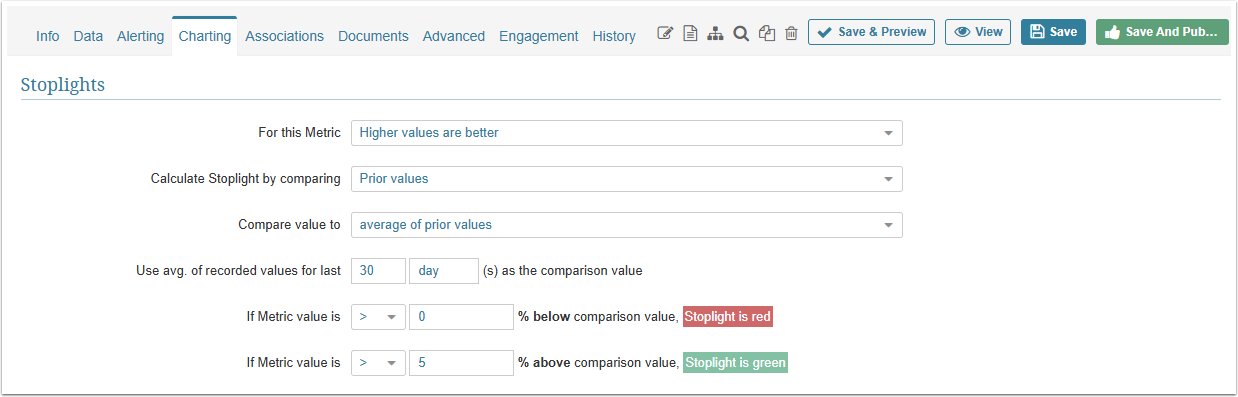
2.2. Calculate by Comparing to "Prior Values"
Stoplight can be calculated by comparing "average of prior values" (Step 2.2) or "specific prior value" (Step 2.3).
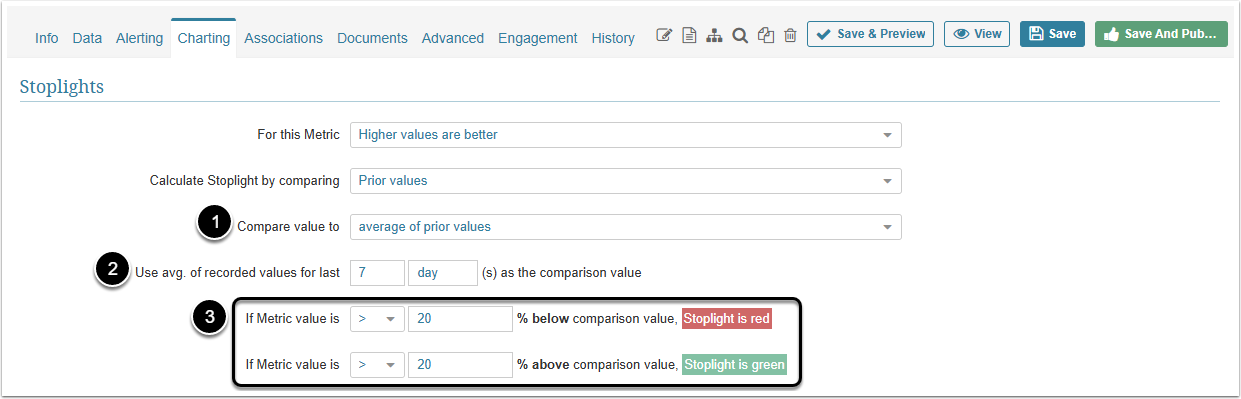
- Compare value to: Select "average of prior values"
- Use avg. of recorded values for last: Enter the number and measurement period for comparison
- Define the Percentages used to determine underperforming (Stoplight is red) and outperforming (Stoplight is green) results
2.3. Calculate by Comparing to "Prior Values" (Specific Prior Value)
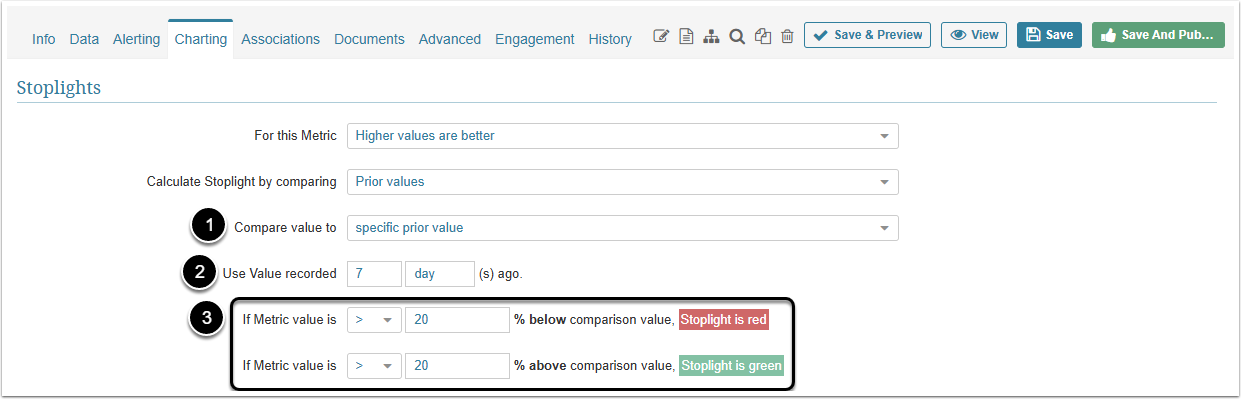
- Compare value to: Select "specific prior value"
- Use Value recorded: Enter the number and measurement period for comparison
- Define the Percentages used to determine underperforming (Stoplight is red) outperforming (Stoplight is green) results
2.4. Calculate by Comparing to "a Target"
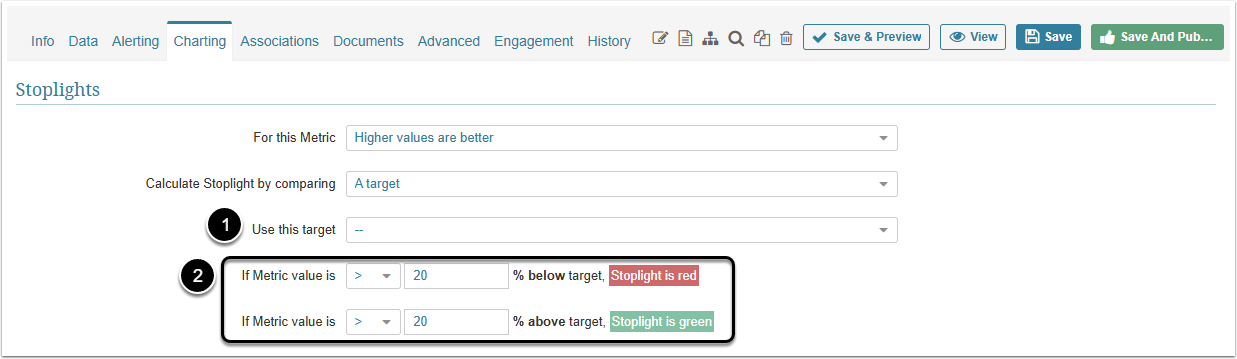
- Use this target: Select a target from the drop-down list. Follow the link to learn more details on How to create a Target
- Define the Percentages used to determine underperforming (Stoplight is red) and outperforming (Stoplight is green) results
3. "Measurement Should Fall Within a Certain Date Range" Option
- Calculate Stoplight by comparing: In this case the Stoplight can be calculated by comparing to "a fixed value"
- Compare value to: A fixed value should either 'fall within a specific range' (Step 3.1) or its specified percent should fall within a specific range (Step 3.2)
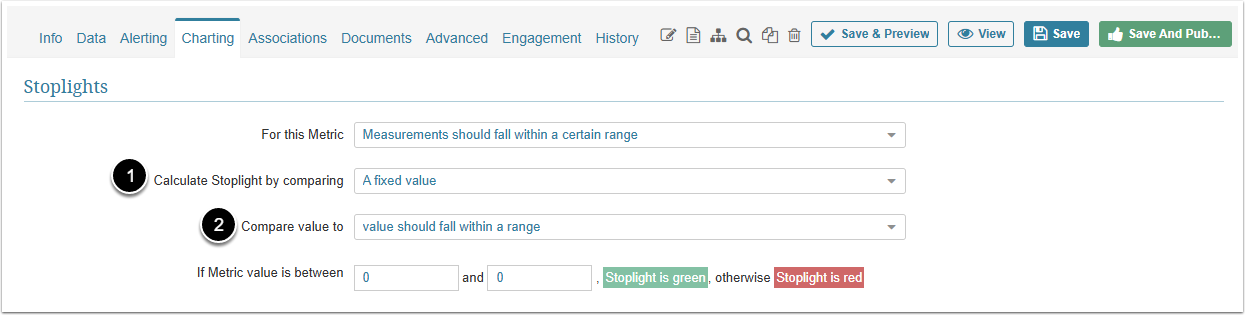
3.1. Comparing to "A Fixed Value" (Value Falling Within a Specific Range)
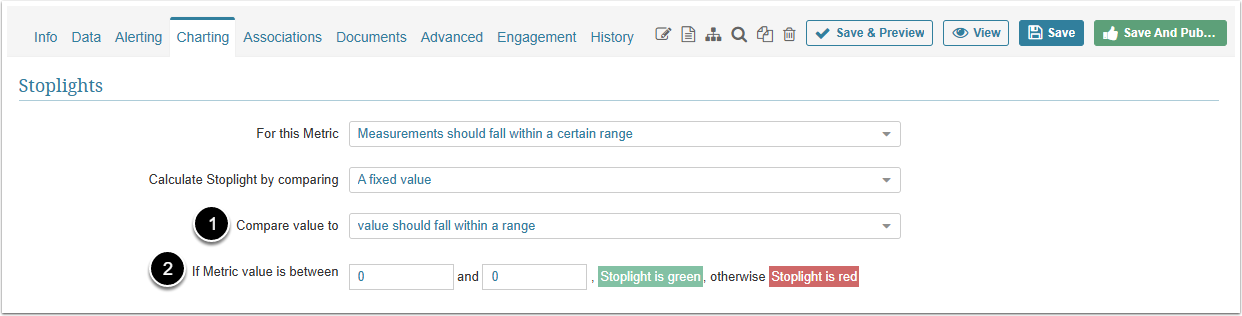
- Compare value to: Select "value should fall within a range"
- Define the required range to determine performing (Stoplight is green) and underperforming (Stoplight is red) results
3.2. Comparing to "a Fixed Value" (Percentage Falling Within a Specific Range)
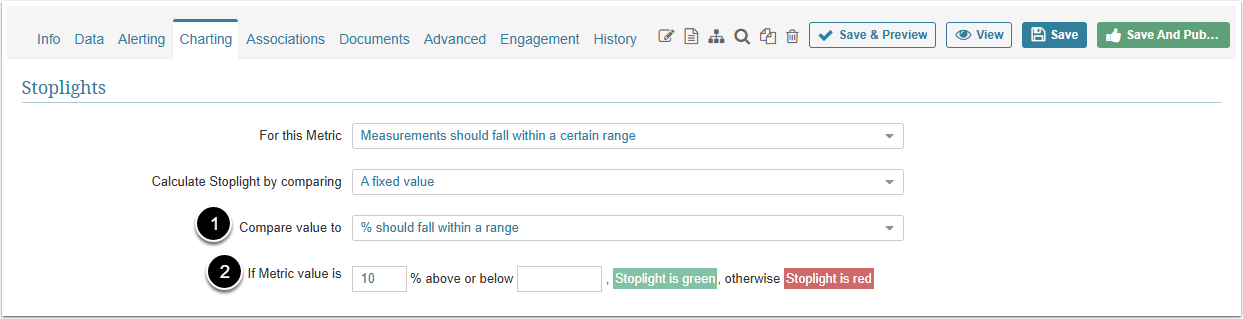
- Compare value to: Select '% should fall within a range'
- Define the Percentage and the value to define performing (Stoplight is green) and underperforming (Stoplight is red) results
4. Example of Stoplight View Settings for a Metric Chart
Settings governing the example below
4.1. Open Metric Viewer's Stoplight View
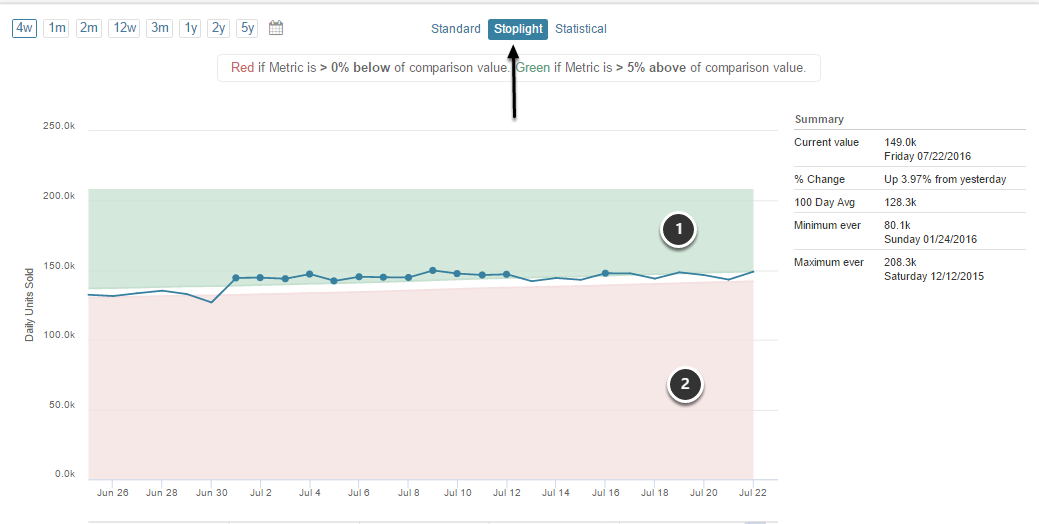
- Outperforming results area is colored in green
- Underperforming results area is colored in red
4.2. Example of Stoplight display on a Tile on your Home Page
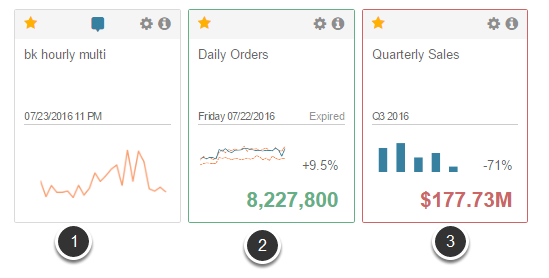
Stoplight value is reflected in the color of the latest value:
- Normal Range (grey)
- Outperforming (green)
- Underperforming (red)
NOTE: The colors of the underperforming, outperforming and normal range values may vary depending on your settings in My Preferences.