This article describes how to set Carting Interval and what impact it will have on Chart.
The setting for Index Charting Interval on the Measurement Interval Editor is established when a Charting Interval is added to a Measurement Interval. This setting is used to govern the generation of the thumbnail shown on the tile and the Chart Preview images, and it is also the Charting Interval that opens up when you access the element in the Viewer. Only one Charting Interval is 'indexed' for each Measurement Interval.
This setting impacts Metric Charts. See the example below.
For more information, see Update Measurement Interval Settings.
1. Open Charting Interval List
Access Admin > Reference Objects > Measurement Intervals and click the Measurement Interval Active Name link
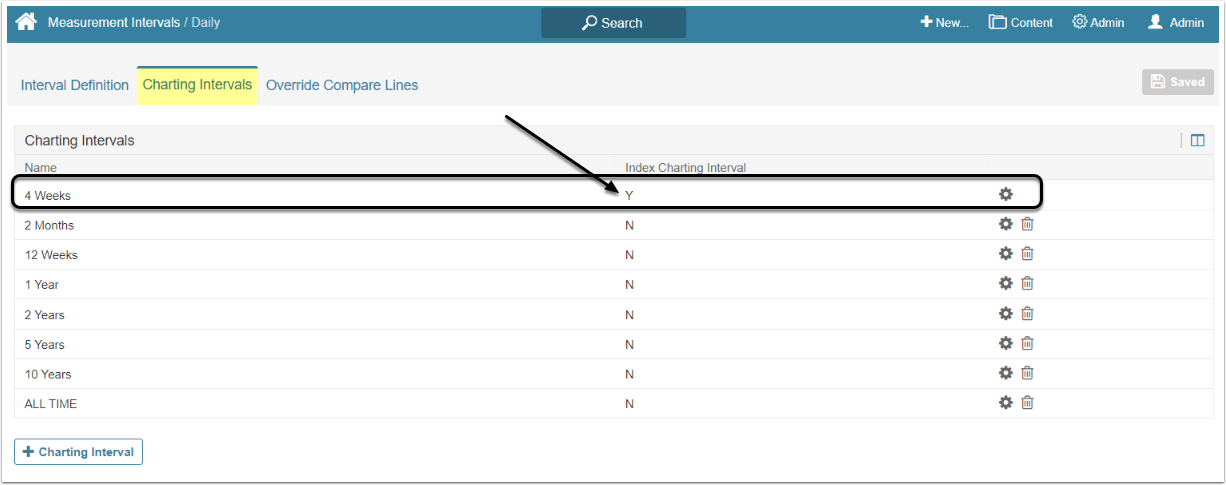
Open the Charting Intervals tab. The Charting interval that has "Y" in the Index Charting Interval column is defined as the Index Charting Interval.
2. Open a Daily Metric
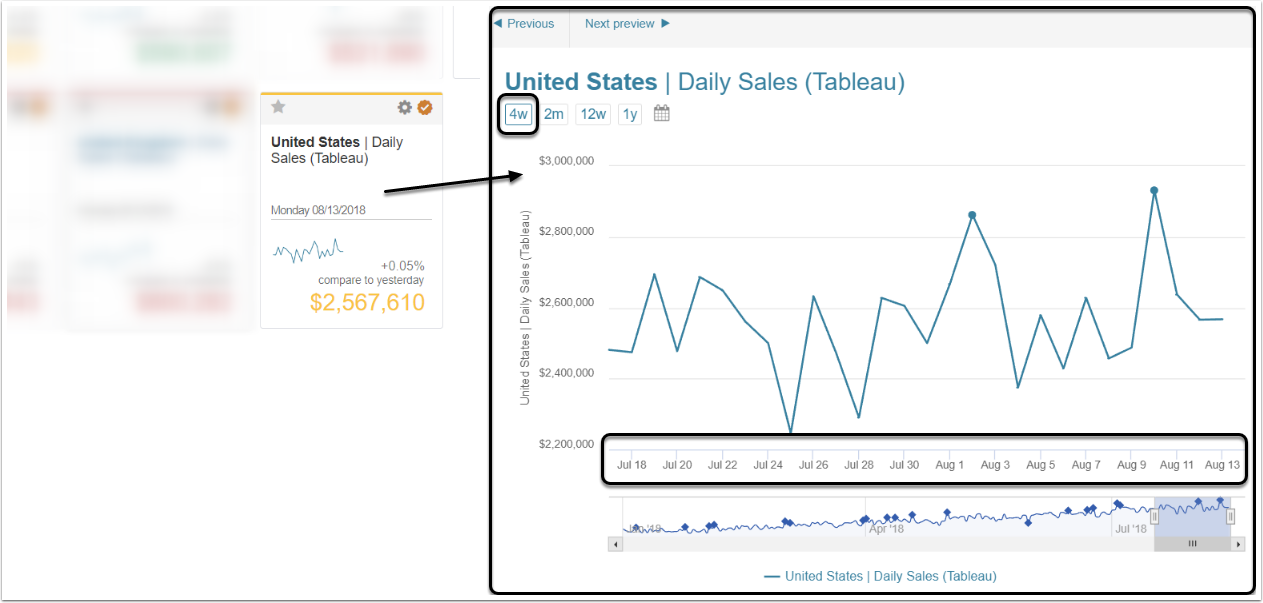
The time frame in the tile and the Chart Preview are the same. The time frame represents the 'indexed' Charting Interval of '4 Weeks' ('4w') and corresponds to the Full Chart view shown below.
NOTE: You can use any Charting Interval button to see more or less data points on a Chart