Projections predict values based on calculation settings that you specify. These Future Projections appear on a special Projection View of your Metric Viewer. This article describes how to add a Future Projection to a Metric.
On the Metric Editor, you can create one or both of the Projections:
- Future Periods: For a specified number of future periods
- Partial Period: For the remaining portion of the period, if the Measurement Interval is longer than one day and the Metric supports collecting data for less than a full period. For more information, see Create a Partial Period Projection
1. Open the Metric Editor
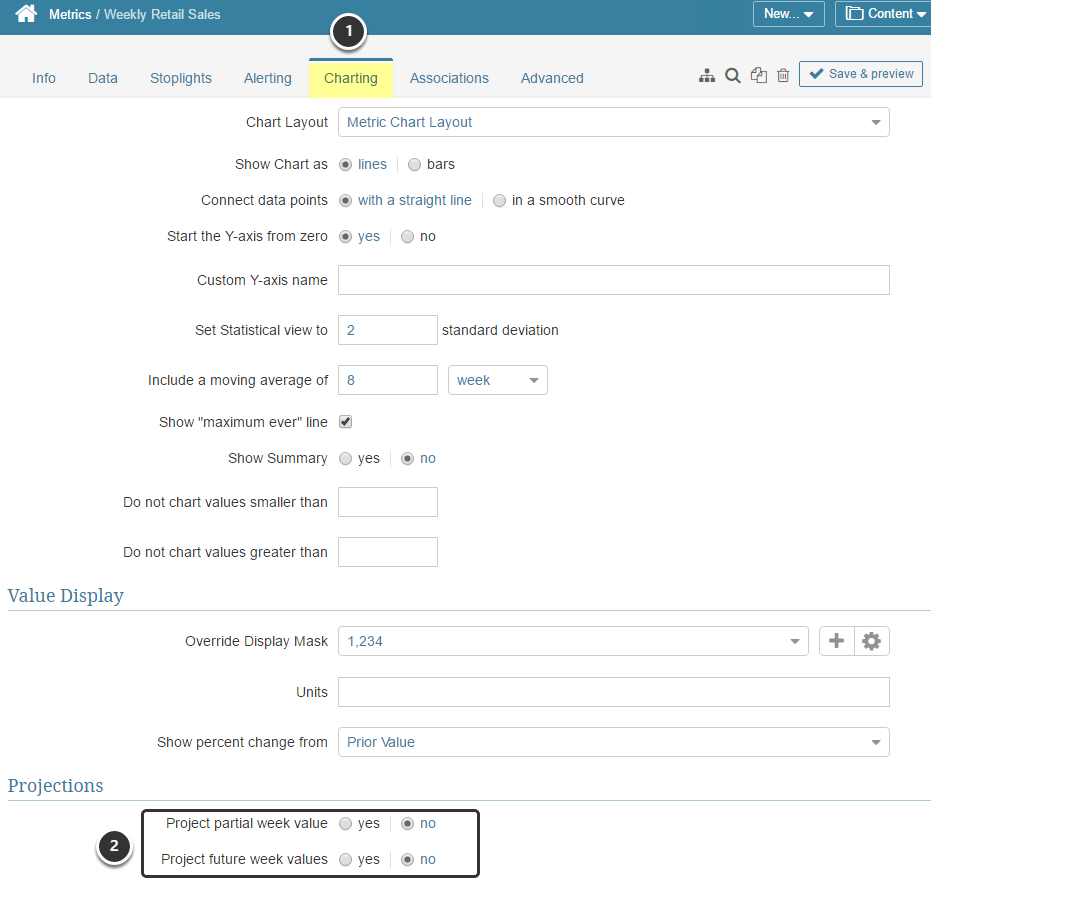
- Open the Charting tab
- Page down to the Projections section
2. Define Settings
To specify the manner in which a Future projection is calculated using the "Linear Regression" formula:
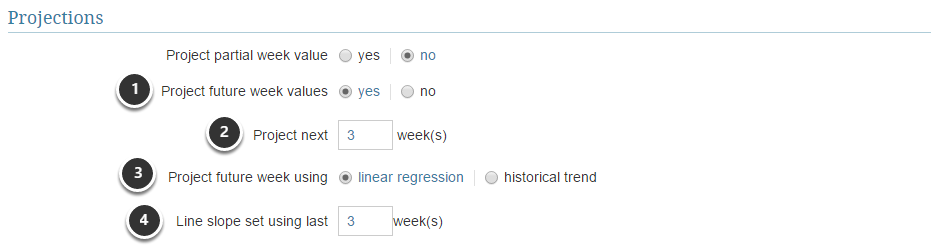
- Project future <Measurement Interval> values: Select "yes" option
- Project next: Enter how many weeks (months, quarters, etc.) of Projections to be calculated
-
Project future week using: It can be based on either:
- "Linear Regression" (Default) using the standard statistical calculation
- "Historical Trends" (see Step 3)
4. Line slope set using last: Select how many of last weeks (months, quarters, etc) should be used for calculating future results
[Save & Publish] afterwards.
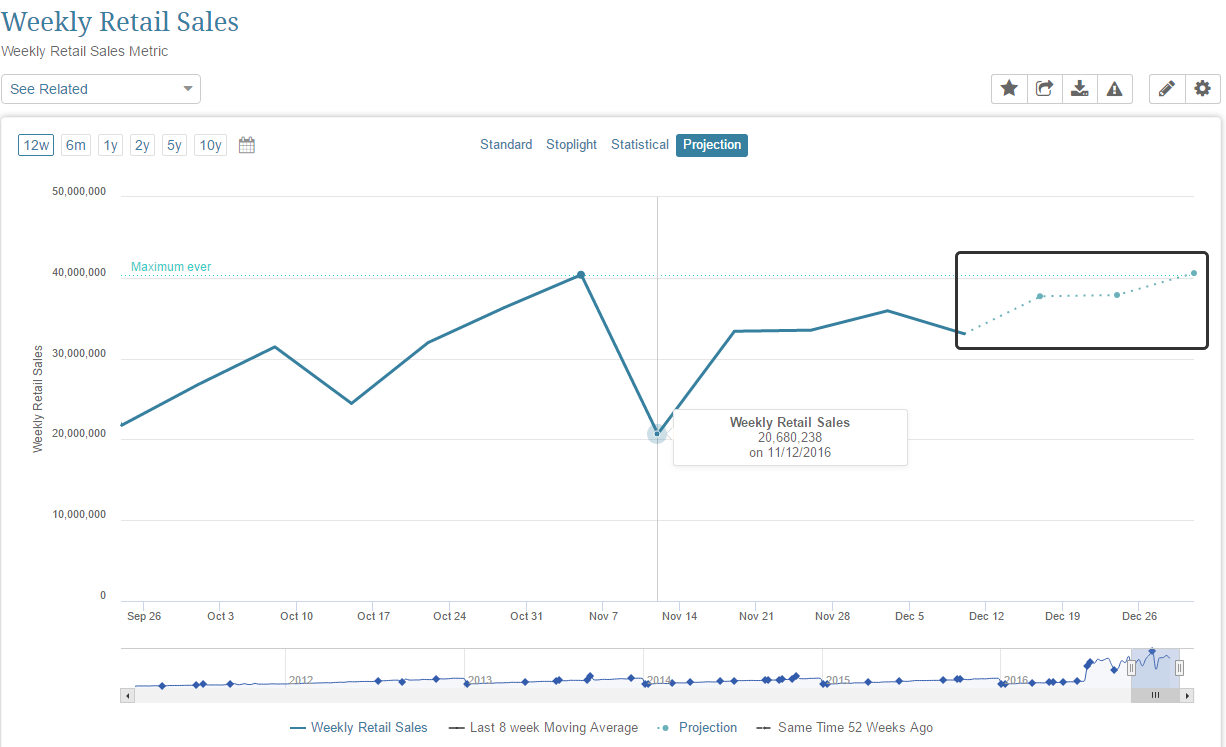
2.1. Review the Metric Chart
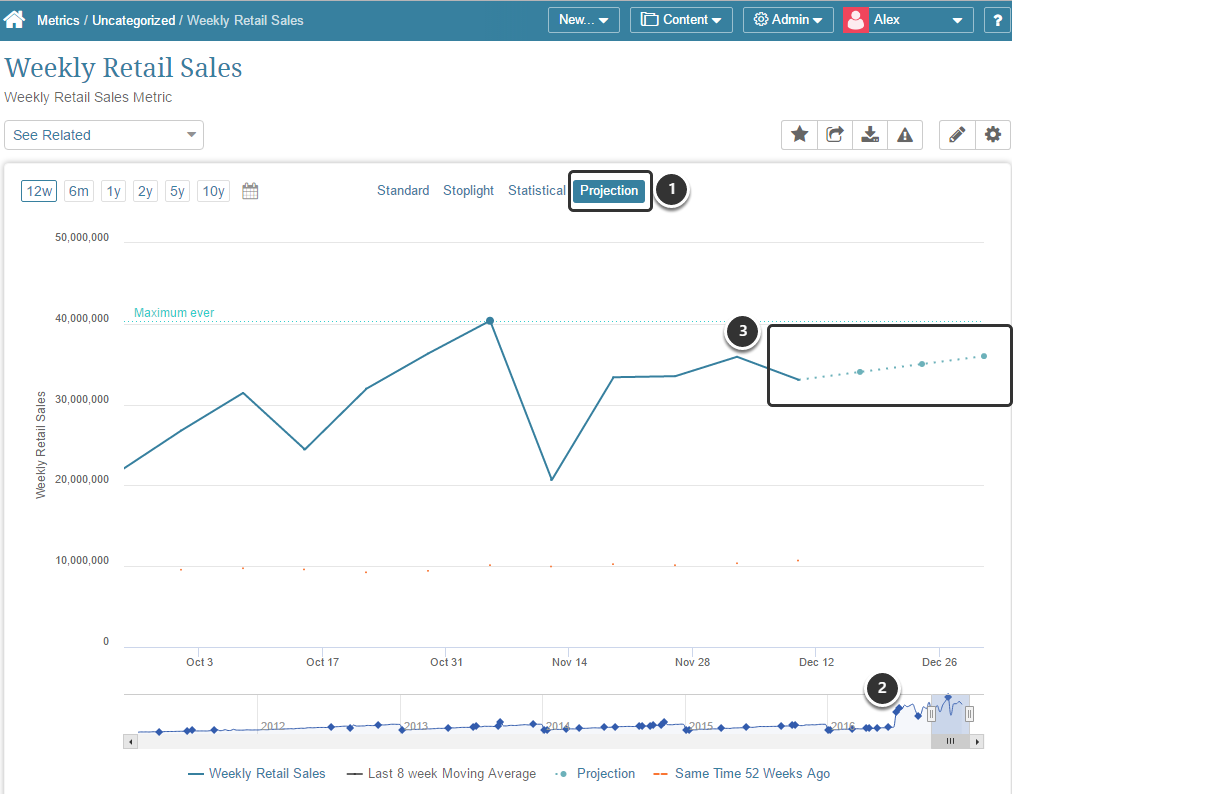
- Open the Projection View
- Adjust Time line to display the future
- Review the projected future values
3. Define the Historical Trend Projection
Modify the initial settings:
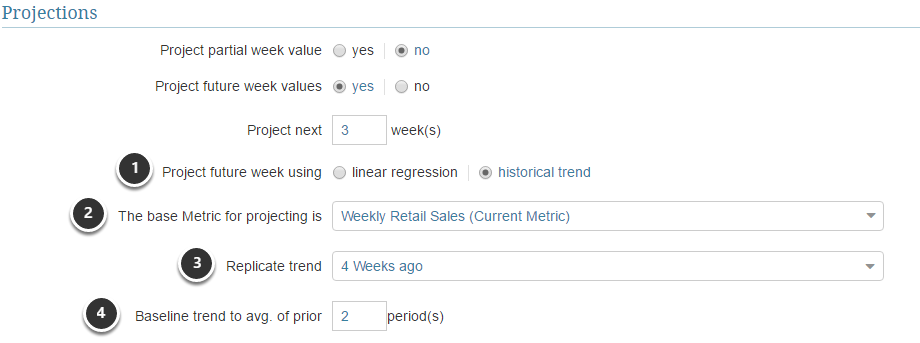
- Project future <Measurement value> using: Select 'historical trend' as an option of projecting future <Measurement Interval>
- The base Metric for projecting is: Select "Current Metric" option
- Replicate trend: Select a period on which to replicate trend from the drop-down list
- Baseline trend to avg. of prior: Enter the number of prior periods to be used to calculate
[Save & Publish] afterwards.
3.1. Review the Metric Chart
Notice the projected future values displayed are based on historical values rather than linear formula.