This introductory article describes how to define the basic settings for creating a simple Metric from SQL statement.
PREREQUISITES:
- Prepare SQL Statement: Be sure ti write a SQL statement that returns a set of measurement times and values for the Metric. See Writing SQL for a simple Metric for more details.
- Data Source: Metric Insights must have a working Data Source connection. For more information, see Connecting to Data Sources.
What is a Metric?
Metric is an Element that displays a value that is tracked over time and can be dimensioned. Along with the Report, it is one of the most basic Elements of Metric Insights. Metrics are shown on the Catalog Page as tiles. Metrics can be:
- Simple, or Undimensioned. In this case, the data is gathered into one Metric.
- Dimensioned. It is possible to apply a Dimention to the Metric and specify the data according to the Dimension Values. For more details about how to create a Dimension refer to Create a Simple Dimension article.
All types of Users can create Metrics via the +New menu.
This article describes how to create only an Undimentioned Metric. To learn ho to create Dimensioned Metric check this article.
1. Start Creating a New Metric
Access +New > Metric > Create New
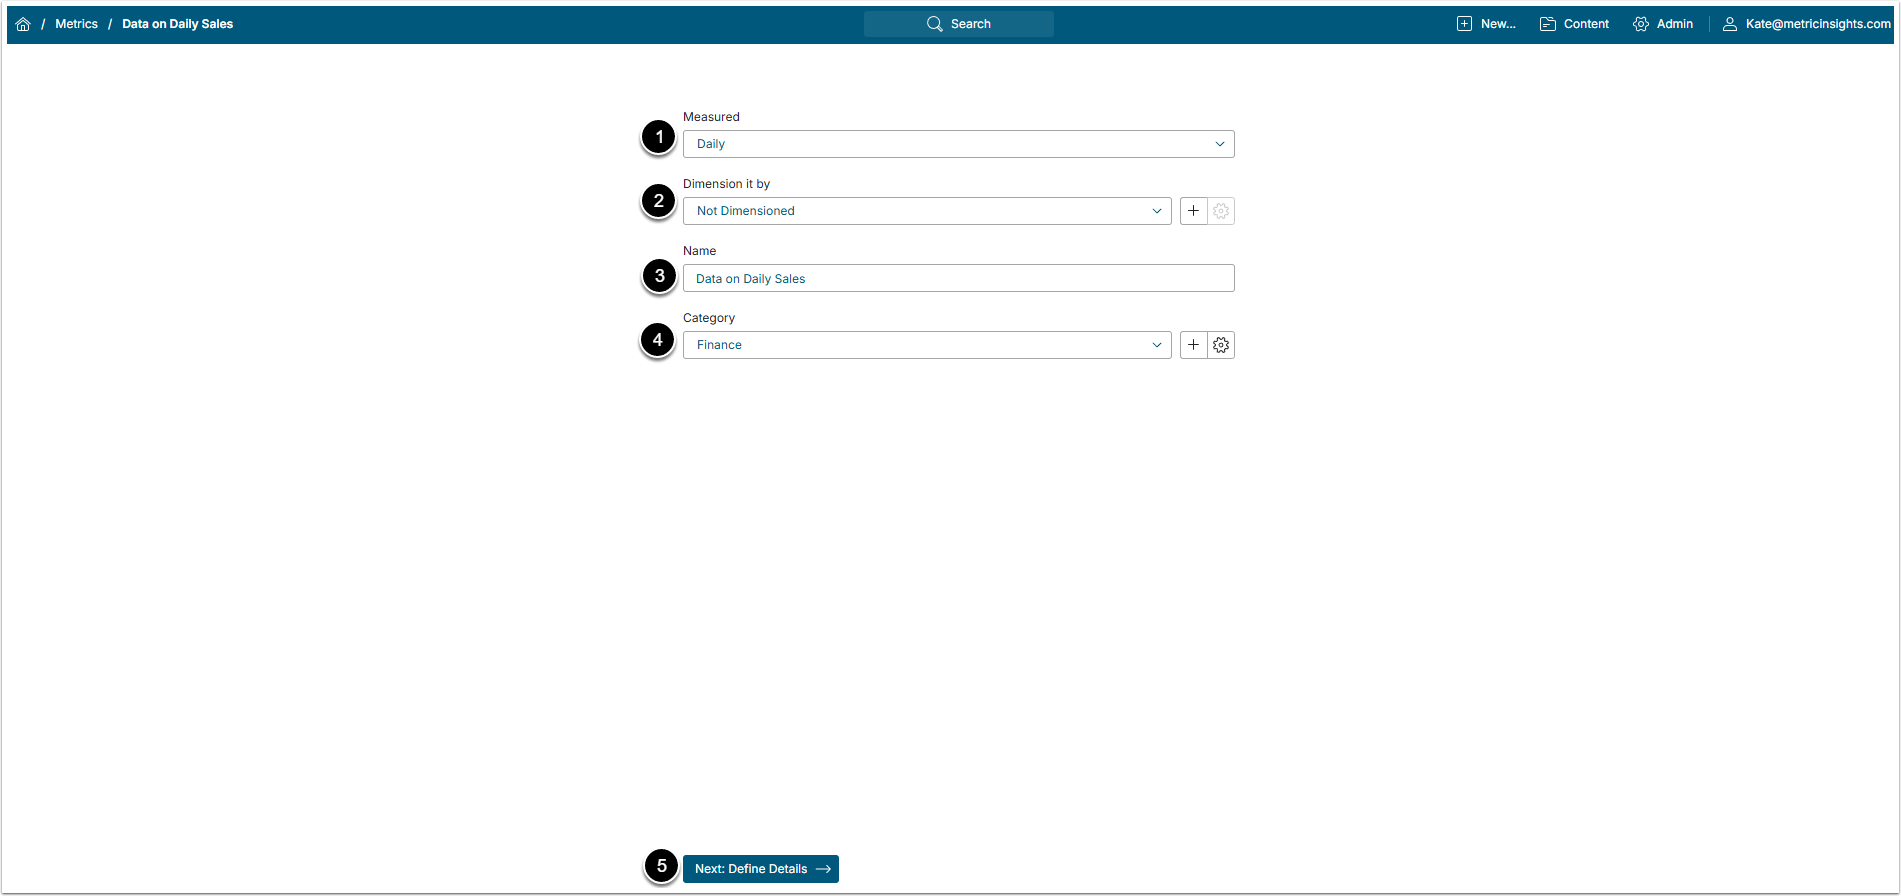
- Measured: Select the measurement interval that applies to the level of aggregation that you want in your result set.
- Dimension it by: The default value in this field is "No Dimension".
- Name: The system automatically generates name based on the values selected in the fields above, however, you can change it to a unique descriptive name of your choice.
- Category: Select the Category where the new Metric will be placed.
- [Next: Define Details] to open Metric Editor.
2. Set Additional Fields
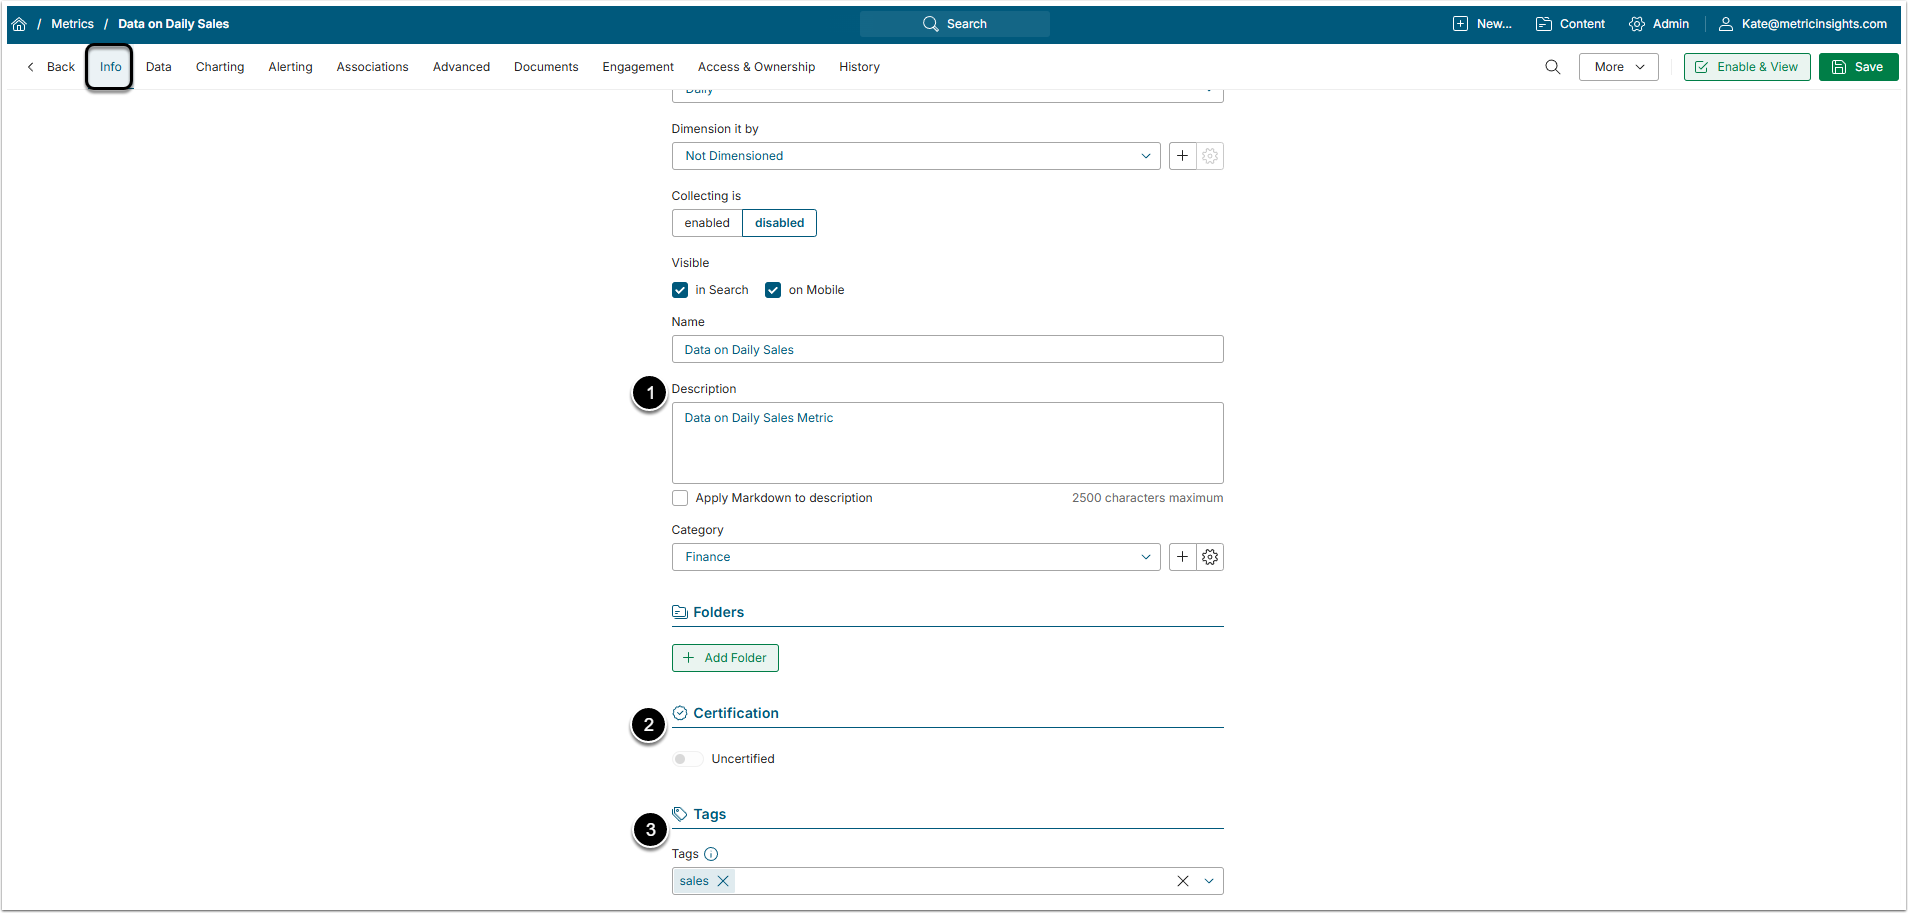
- Description: This field defaults from the Name, but if this is not sufficiently descriptive, you may change it.
- Certified: Certification is a means for Admin and Power Users to identify Elements that have been approved as being valid and accurate. For details, refer to Certifying an Element article.
- Tags: Tags are used to relate Elements to each other for identifying purposes. For details, refer to Create a Tag article.
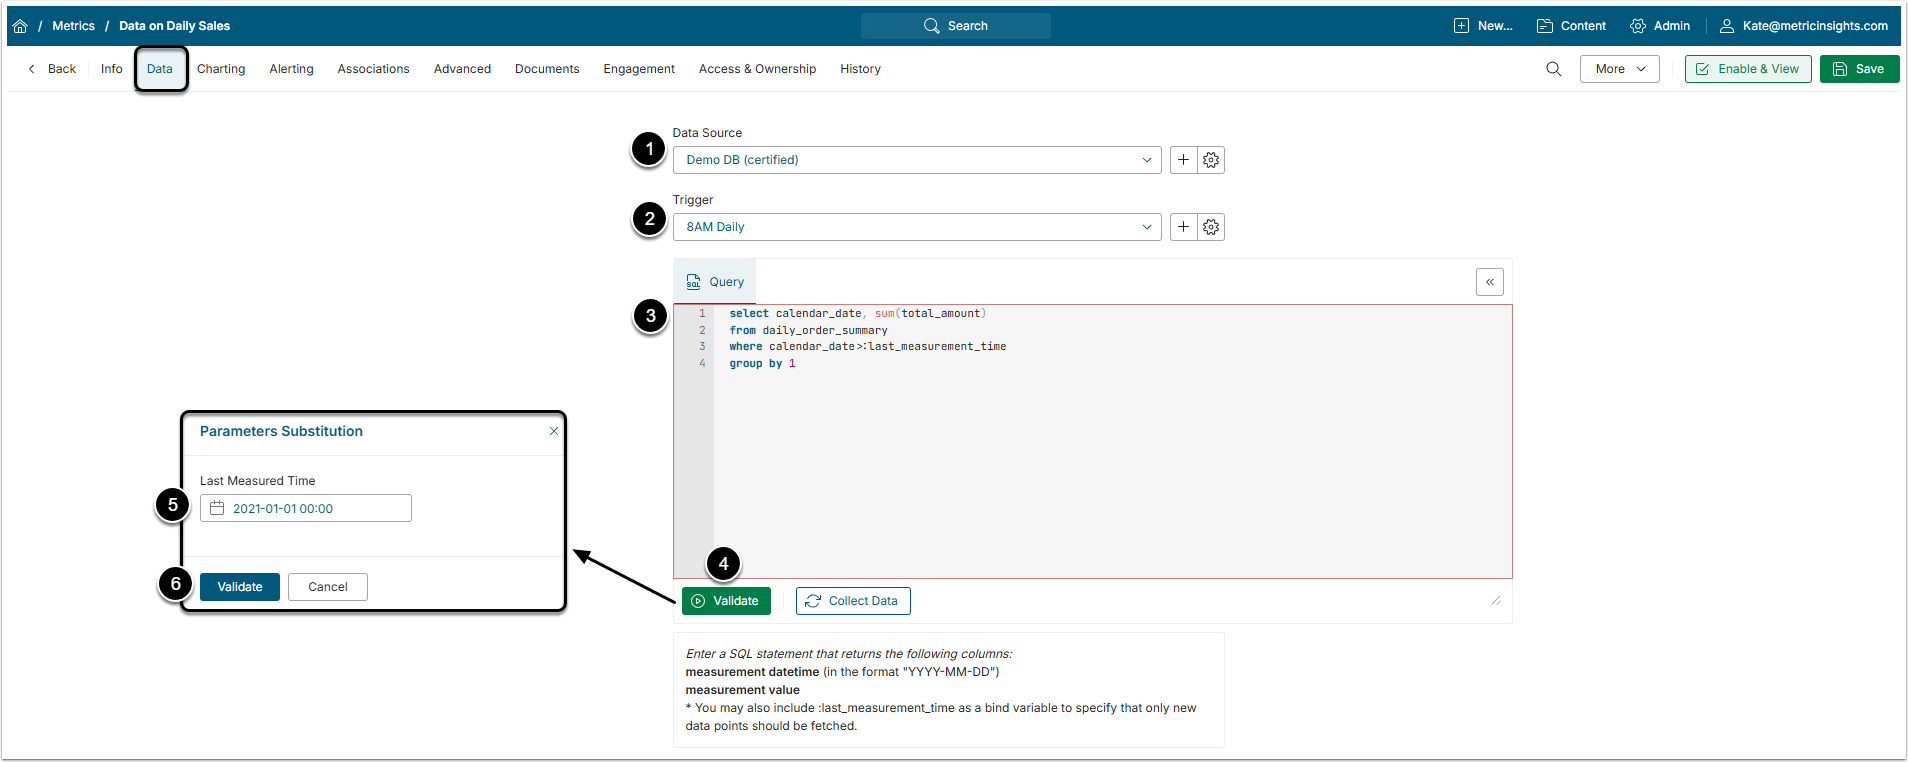
3. Define Data Collection Parameters
-
Data Source: Select the repository which contains necessary data. SQL Database is used for this example.
- For more info on Data Sources, refer to Understanding Data Sources article.
- Trigger: Select a Data Collection Trigger that will initiate Metric data collection process.
-
Query: Enter an SQL query.
- For more details, see Write a SQL Statement for a Dimensioned Metric article.
- [Validate]
-
Latest Measured Time: Enter Last Measurement Time value.
- NOTE: This pop-up only appears if you included ':last_measurement_time' in the SQL Statement field.
- [Validate] to verify that the SQL statement is valid.
4. Collect Data
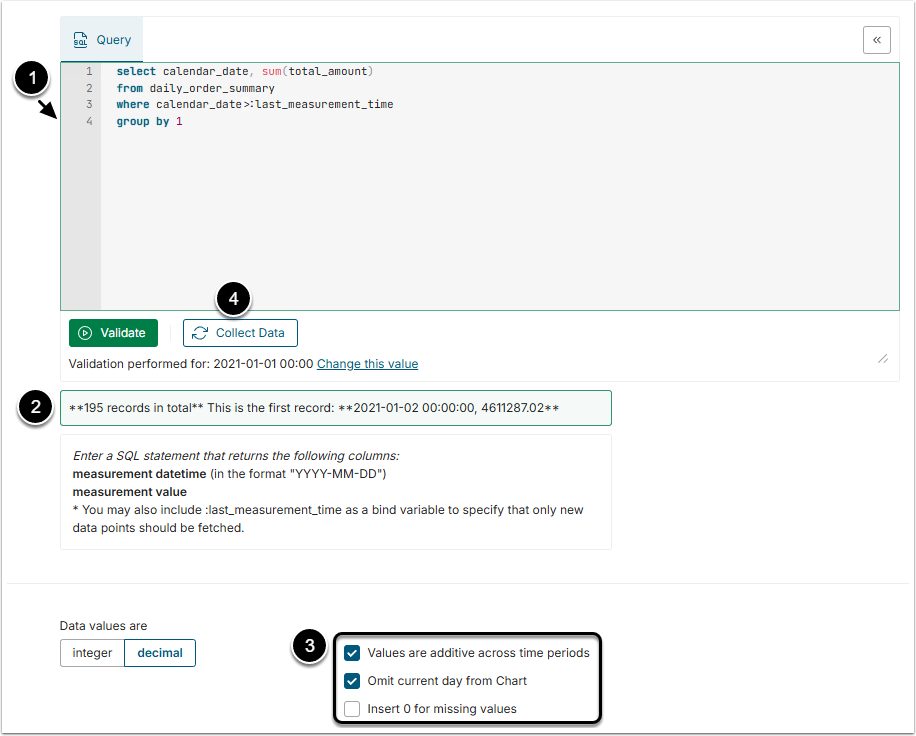
- If your statement is valid, the query box color is green; if there are any errors, the box is colored in red and errors are explained below the query box.
- The total number of found records and an example of first one are displayed below the query box.
- Specify data collection advanced options.
- To proceed with fetching data, click [Collect data].
5. Enable & View Metric
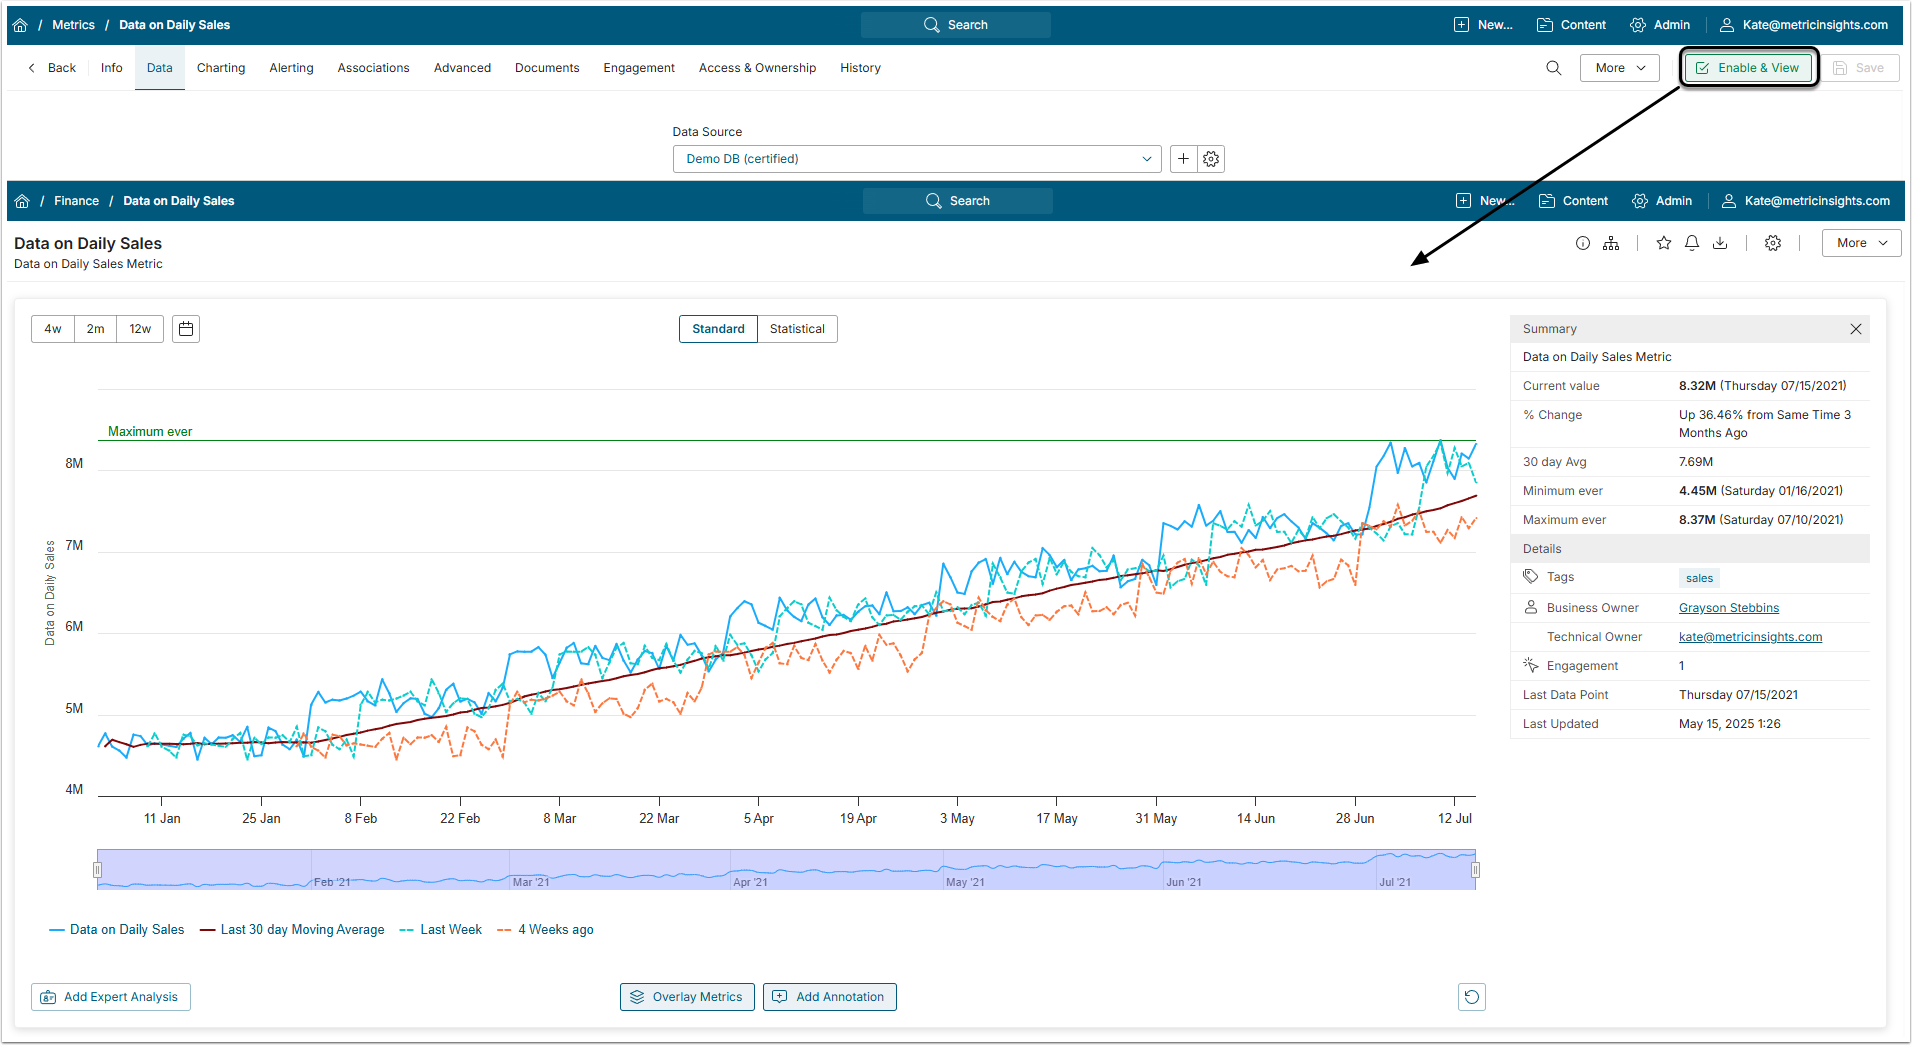
[Enable & View] to view the Metric in the Viewer.