Datasets serve as a staging layer between Data Sources and Metric Insights Elements (Metrics and Reports).
The ultimate goal of Dataset functionality is to separate data loading, staging and discovery from data display and distribution. A Dataset (and its Dataset Views) can be used as the source for multiple Reports and Metrics, allowing a single source for many different Elements and use-cases.
In this article:
For Dataset-based use-cases for Custom Apps, indexes are created on-the-fly once a Dataset is being accessed via the dataset_data endpoint. Indexes can also be configured manually.
1. Understanding Datasets
As was said above, Datasets function as an additional layer between Data Sources and Elements created in Metric Insights. This functionality gives Users without a technical background the ability to utilize data. With Datasets there is no need to understand the structure of source database, know SQL or the syntax of other BI tools. Datasets allow:
- Data to be easily staged to support business users in creating their own Metric Insights content without having to understand underlying Data Sources.
- Snapshots of data from a Data Source without having to create and maintain "staging reports".
- Creation of exception and change reports from any Data Source without having to understand Data Source-specific syntax or SQL. See also Granting Power User Access to Dataset.
- Utilization of dynamic filtering to identify exceptions and changes in large, complex data sets without any dimensional restrictions.
2. Info Tab
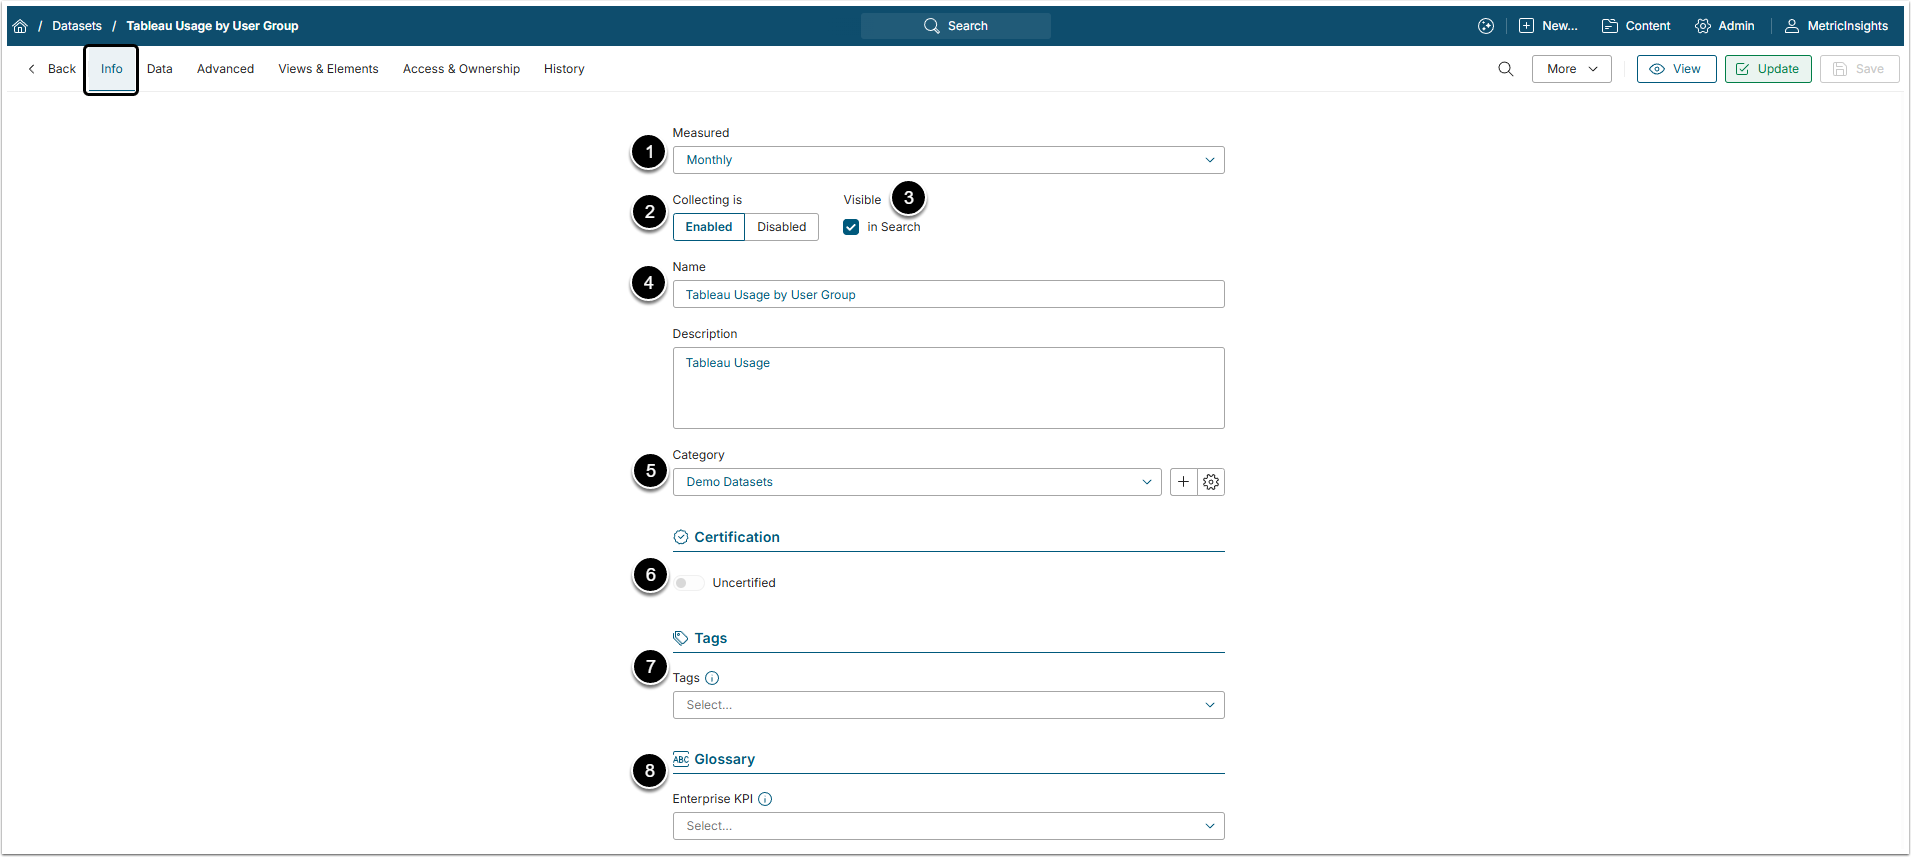
- Measured: Select the measurement interval that applies to the level of aggregation in the result set.
- Collecting is: New Datasets are always disabled by default to make sure that you can take time to configure them properly before enabling.
- Visible: Select this checkbox to make the Dataset visible in search.
- Name:Provide a unique descriptive name for the Dataset.
- Category: Select the Category to place the Dataset into.
- Certification: Allows Users to validate Datasets.
- Tags: Add Tags that help with searching and organizing content.
- For more details, check the Create Tag article.
- Glossary: Add Glossary terms for data governance purposes.
- For more information, go through the Understanding Glossary article.
3. Data Tab
3.1. Data Tab for a Plugin
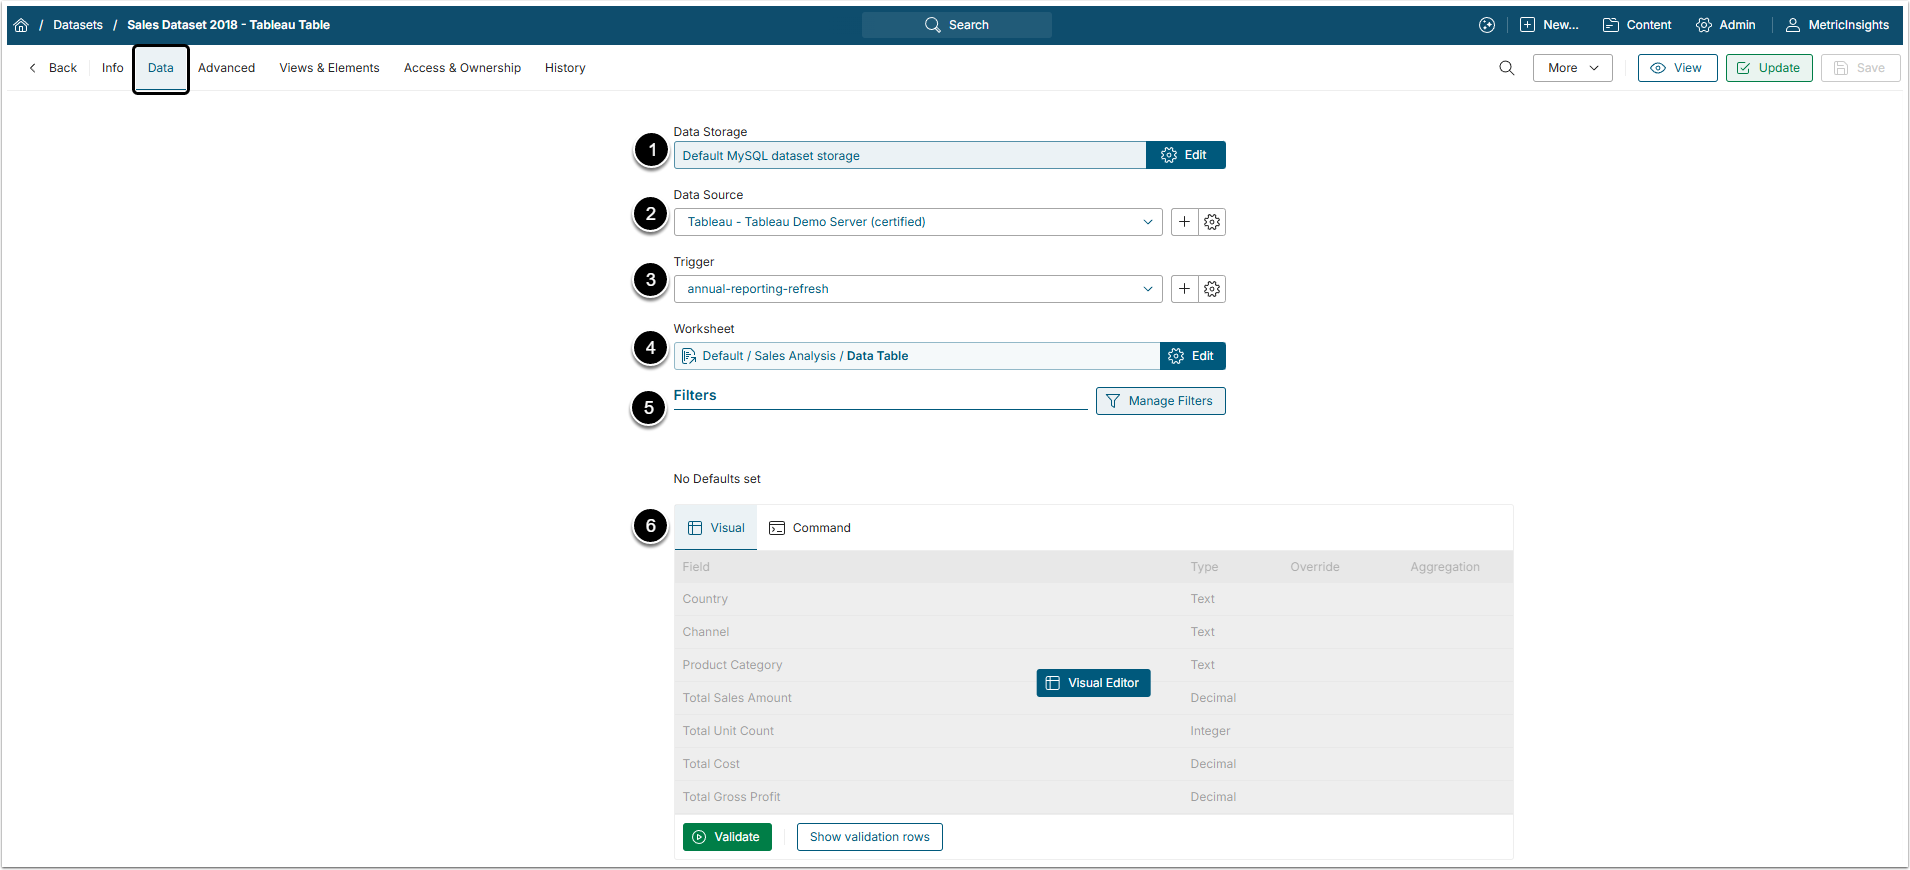
- Data Storage: Select a MSSQL/MySQL server that stores Datasets.
- For more details, check Configure a Data Storage article.
- Data Source: Select the plugin serving as a Data Source for this Dataset.
- Trigger: Select a Data Collection Trigger which is going to initiate updating information in a Metric or Dimension Values. If there is no option matching your requirements, click the plus icon to create a new Trigger.
- Object: Select an Object , from which the Dataset will be created.
- Filters: Set Filtering for the Reports.
- For more information, check the Filtering in External Reports article.
- Query: The query can be given two ways:
- Visual Editor: It doesn't require knowledge of SQL and allows the User to select necessary columns and data via a simple editor. For more details, check the Dataset Visual Editor Overview article.
- Manual Command: Allows the User to enter an SQL command for fetching data from the data source.
3.2. Data tab for SQL Data Source
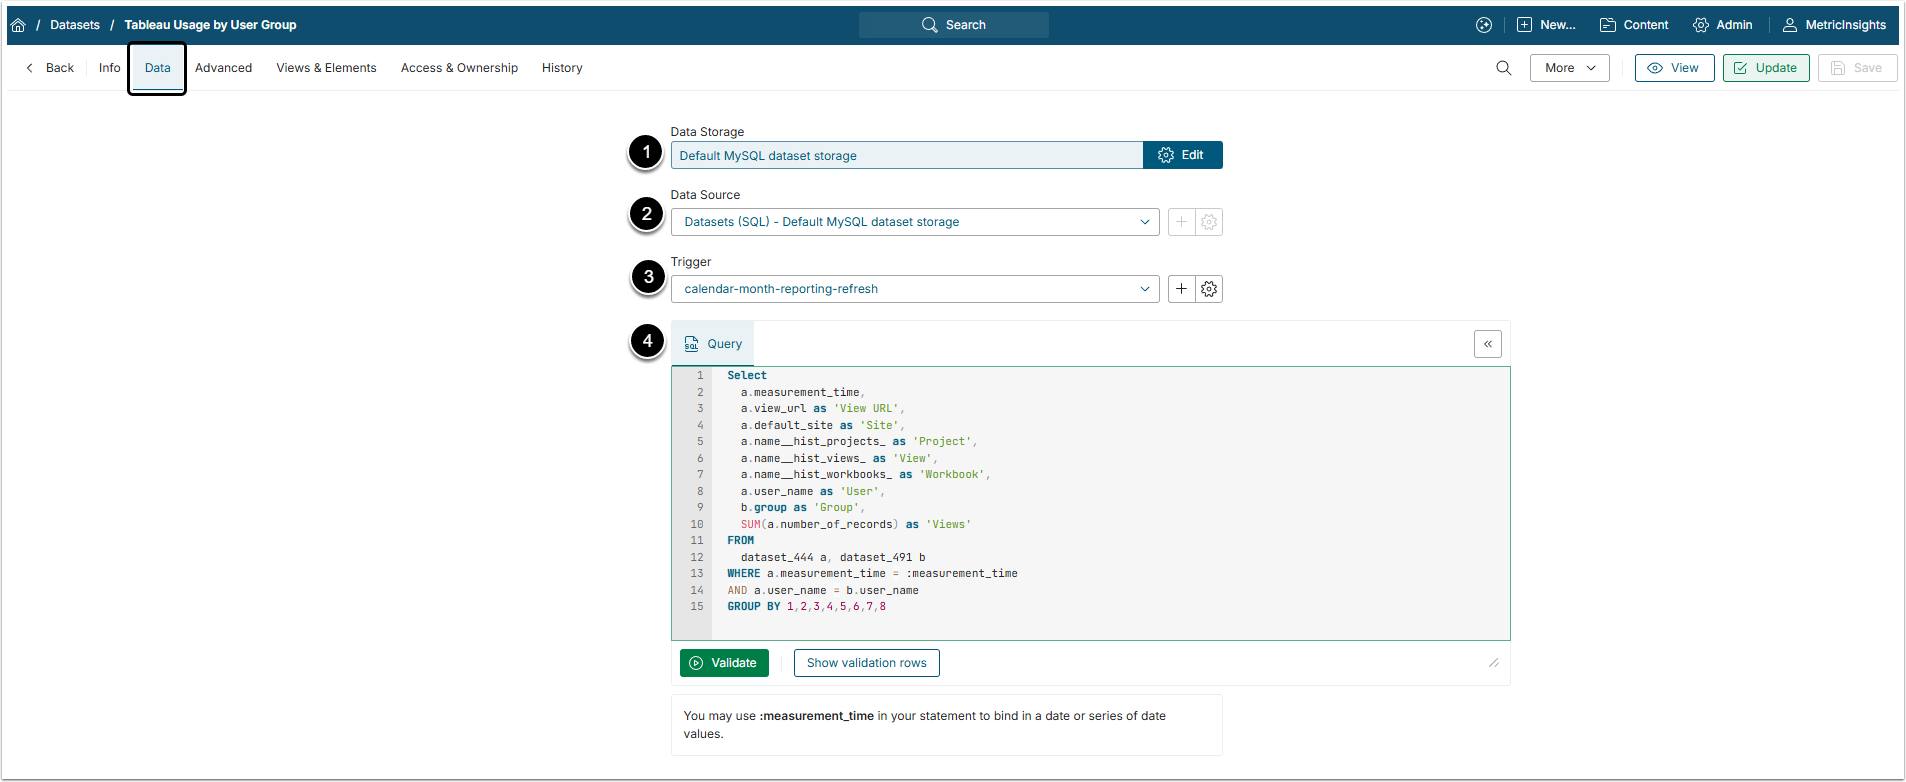
- Data Storage: Select a MSSQL/MySQL server that stores Datasets.
- For more details, check Configure a Data Storage article.
- Data Source: Choose a data fetch method from drop-down list.
- Trigger: Select how often data should be recollected for this Dataset to ensure that it contains relevant data.
- Query: Write an SQL Statement defining the data to be extracted from the database. You may use
:measurement_timein your statement to bind in a date or series of date values.- Also, check the Usage of the ":measurement_time" Bind Variable article.
3.3. Other Settings
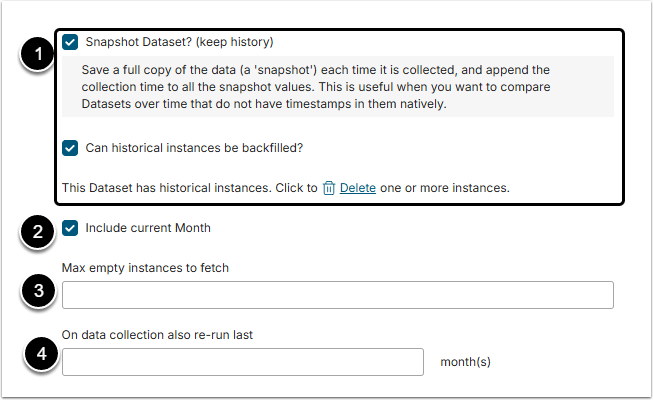
- Snapshot Dataset: Enable it to keep the history of changes in the Dataset.
- For more details, check the Snapshot Datasets Overview article.
- IfCan historical instances be backfilled? field is disabled, then only one instance of the Dataset will be computed at run time and it is required to set the value for the
:measurement_timevariable in the field below. It's important to note that while only one instance of the Dataset will be computed at run time, a new instance of the Dataset will be computed at each succeeding refresh interval. Since history is kept (the Snapshot Dataset? field is enabled), all instances will be retained. This technique can be used to create snapshots of your underlying data at fixed time intervals. - If Can historical instances be backfilled? field is enabled, then multiple instances of the Dataset can be computed at run time and the
:measurement_timevariable is defined automatically by the system.
- Include current measured time period: Enable to include the data, collected in the current time period to the Dataset.
- Max empty instances to fetch: Define the acceptable number of empty instances.
- On data collection also re-run last: This field allows the User to collect data incrementally.
- For more information, check the Collect Metric Data Incrementally article.
3.4. Special and Accented Characters
Special and accented characters (Éé Êê Èè Ëë Ââ Àà Ää Ïï Îî Üü Ûû Ùù Ÿÿ Çç Ôô Öö ẞß Ææ Œœ)
Regardless of the Dataset's Data Source, Metric Insights supports special and accented characters. Please note, that after the command is validated, and data is distributed to columns and the Dataset Columns table is shown, the special characters may be converted to the underscore symbol [ _ ] in the Reference Name column. This behavior is only characteristic for the Dataset Editorand doesn't cause issues in the Viewer.
4. Advanced Tab
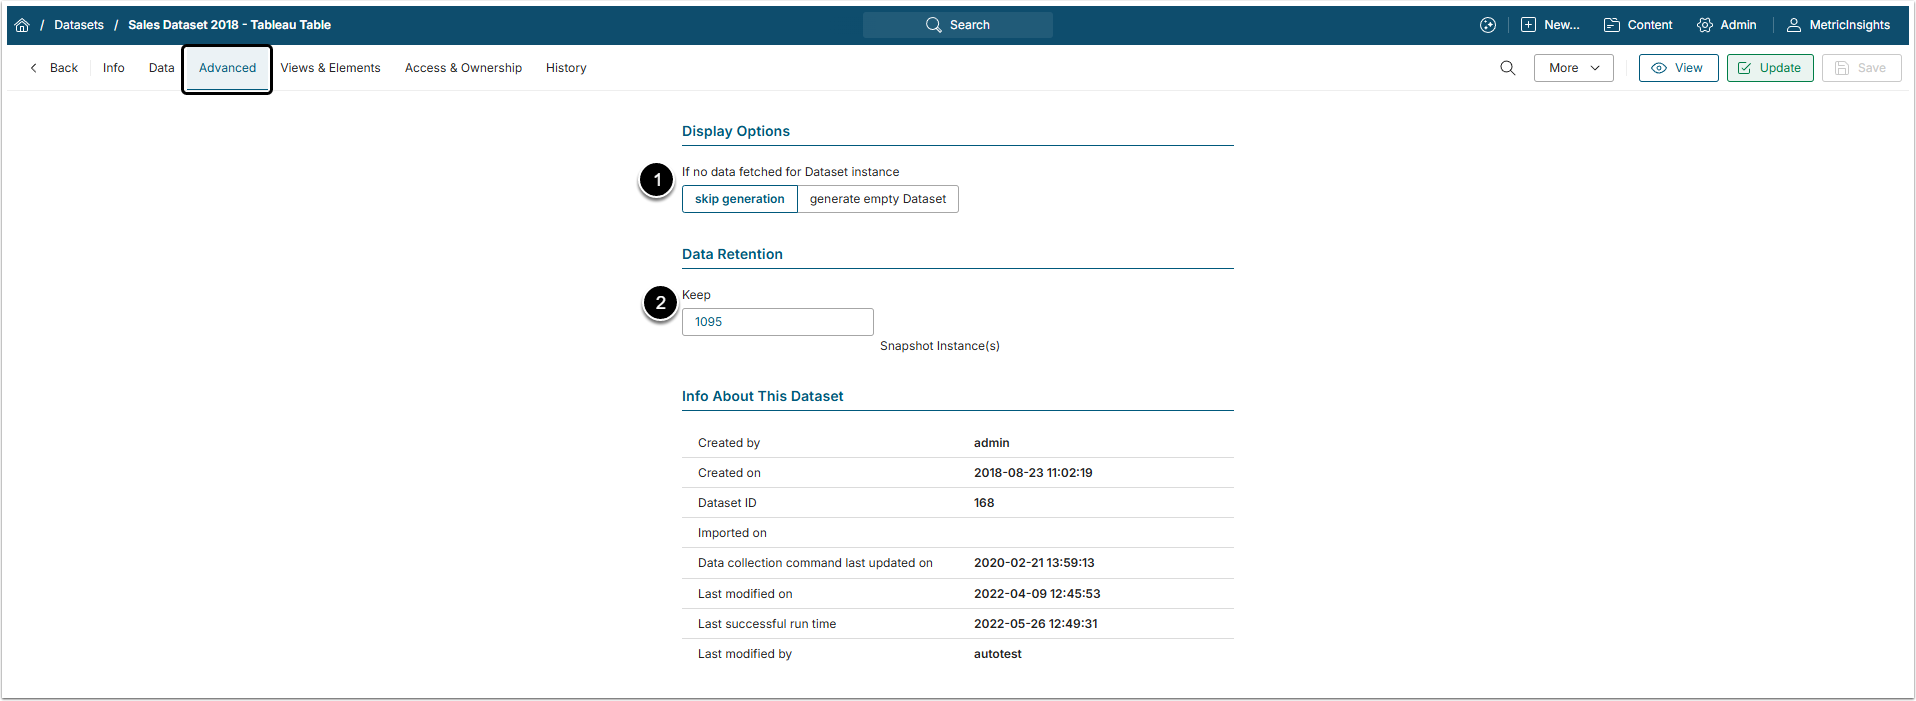
- If no data fetched for Dataset instance: Define how to proceed if the Data Source doesn't contain any data for this Dataset.
- Data Retention: This field is shown only for Snapshot Datasets and allows to choose how many snapshot instances to keep.
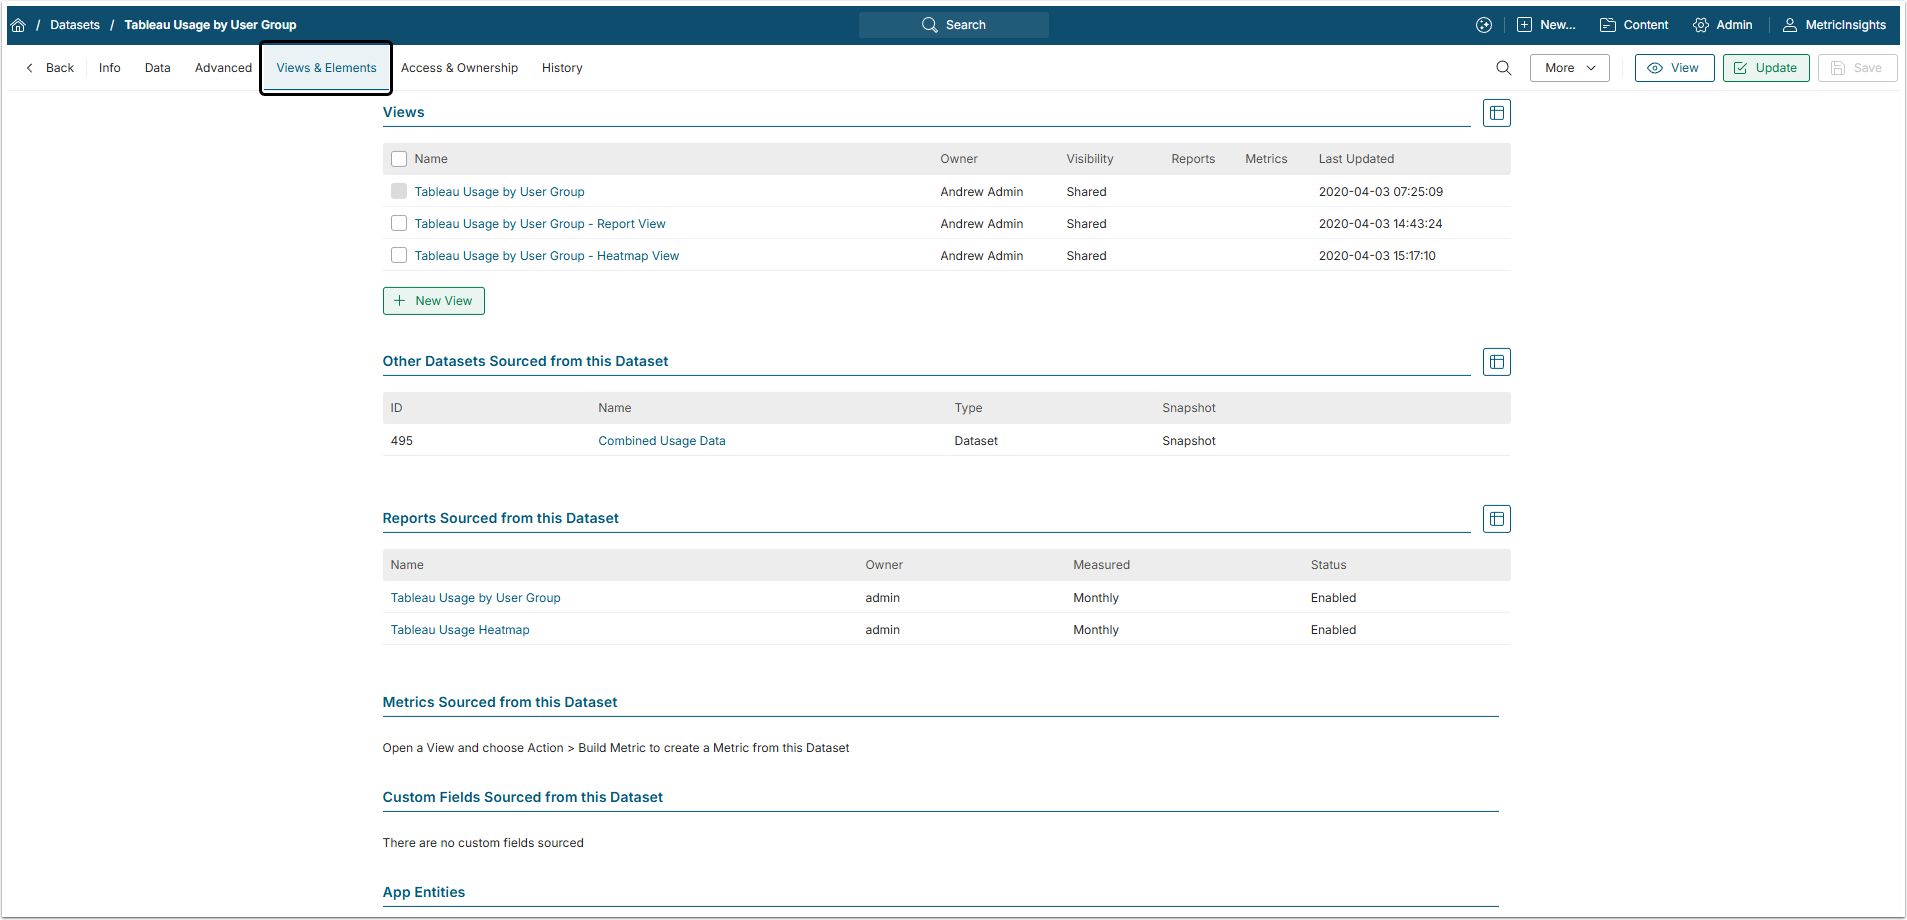
5. Views & Elements Tab
This tab shows all the Views, Elements and Entities, generated from this Dataset.
6. Access & Ownership Tab
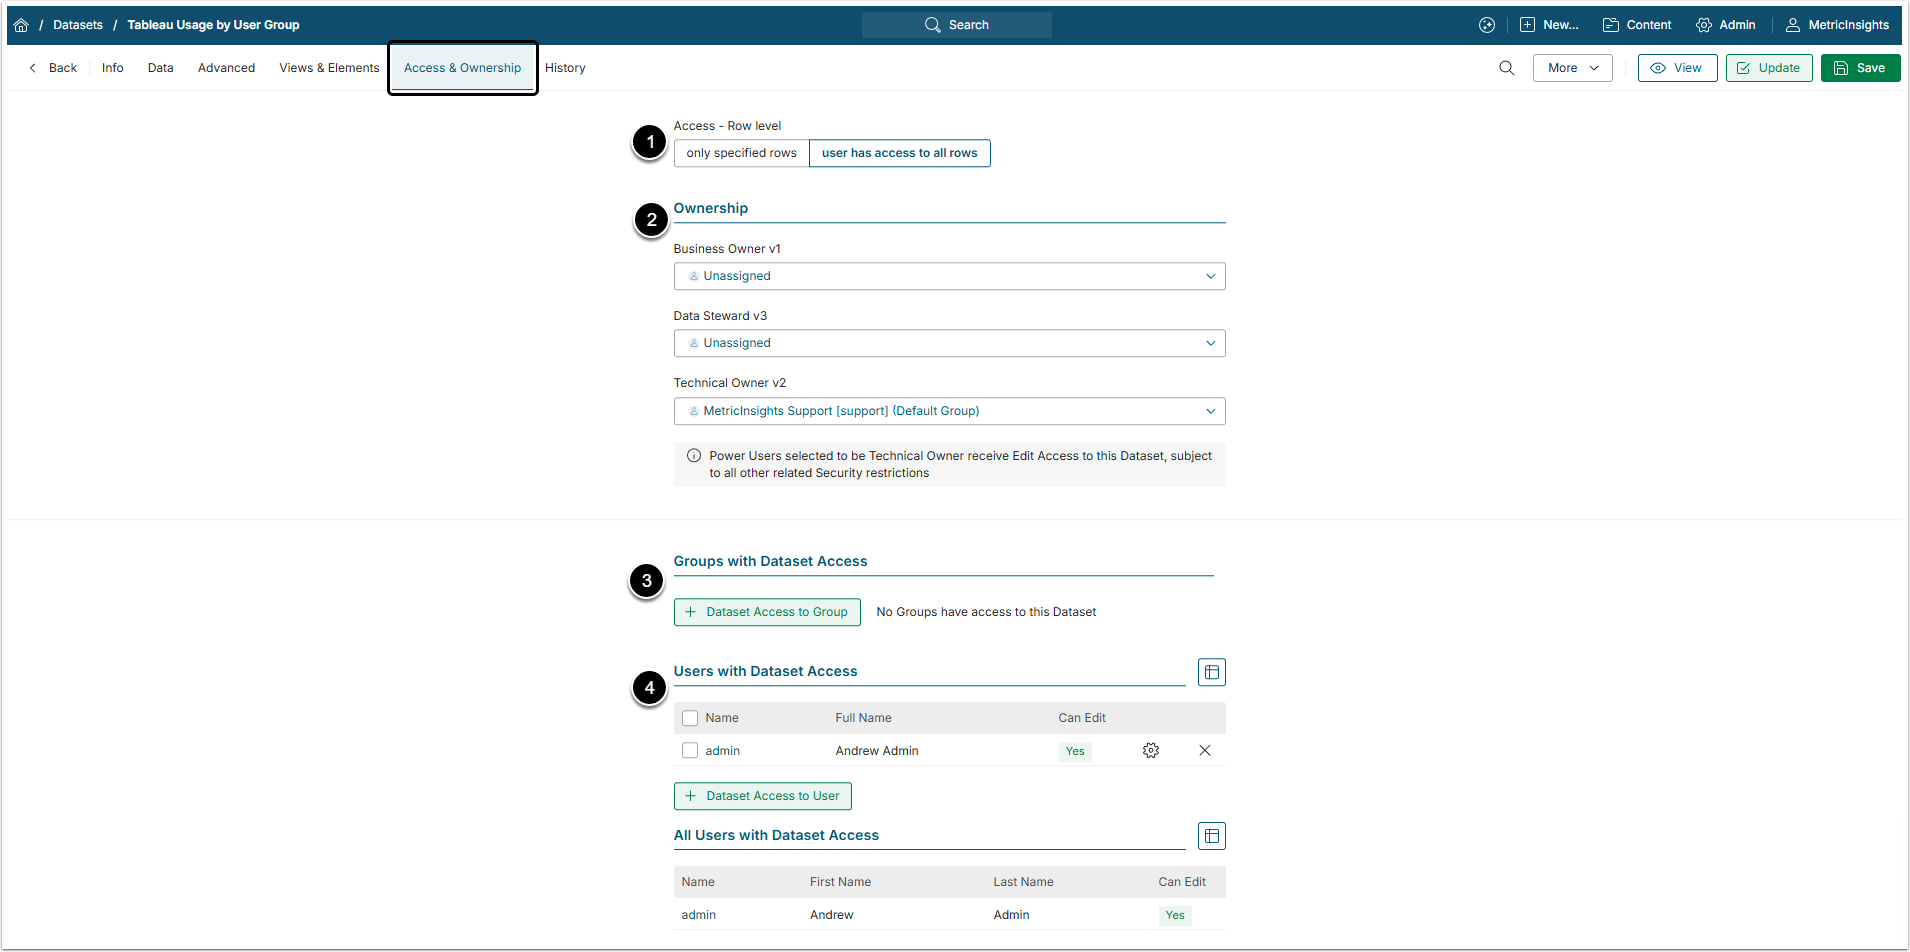
- Access - Row Level: Define what access will all the Users have by default.
- Ownership: Define the owners of the Dataset.
- For more details, check the What Types of Users Exist in Metric Insights article.
- Groups with Dataset Access: In this section the User can grant Groups of Users access to the Dataset.
- For more information, check the Assigning Privileges and Permissions to the Group article.
- Users with Dataset Access: In this section the User can grant individual Users access to the Dataset.
- For more details, check the Granting Power User Access to Dataset article.