In 7.3.1, creating new Metrics will no longer be supported. All Metric use-cases will be supported via Report Metrics.
Using a Moving Average feature allows you to smooth out volatility in a Metric so that the User can see a smoother trend-line for the data. A Moving Average is computed over a preset interval (for example 30 days) for all points included in a chart. This article describes how to add a Moving Average Line to the Metric Chart.
1. Open a Metric Editor
Open a Charting tab of the Metric Editor
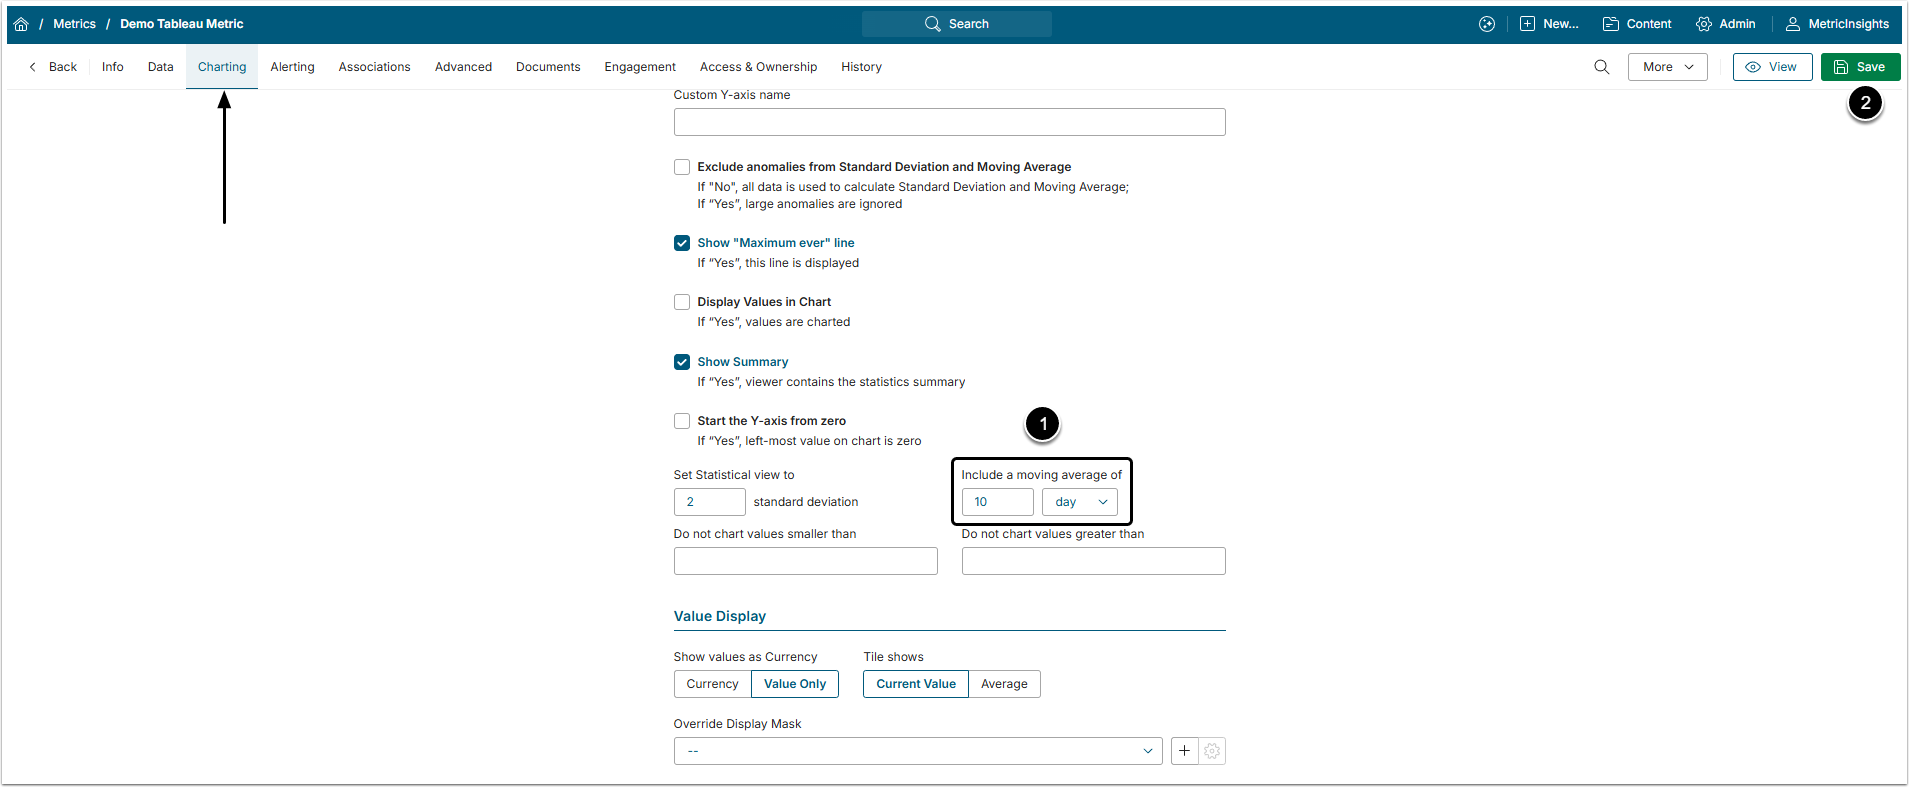
- In the Include a moving average of field specify the interval for which moving average should be calculated. In designating this interval, you provide the number of intervals followed by the interval unit. The interval unit can be expressed as 'second', 'minute', 'hour', 'day', 'week', 'month', 'quarter' or 'year'.
- [Save] to update your Chart View.
2. View the Chart
Open the Metric Viewer
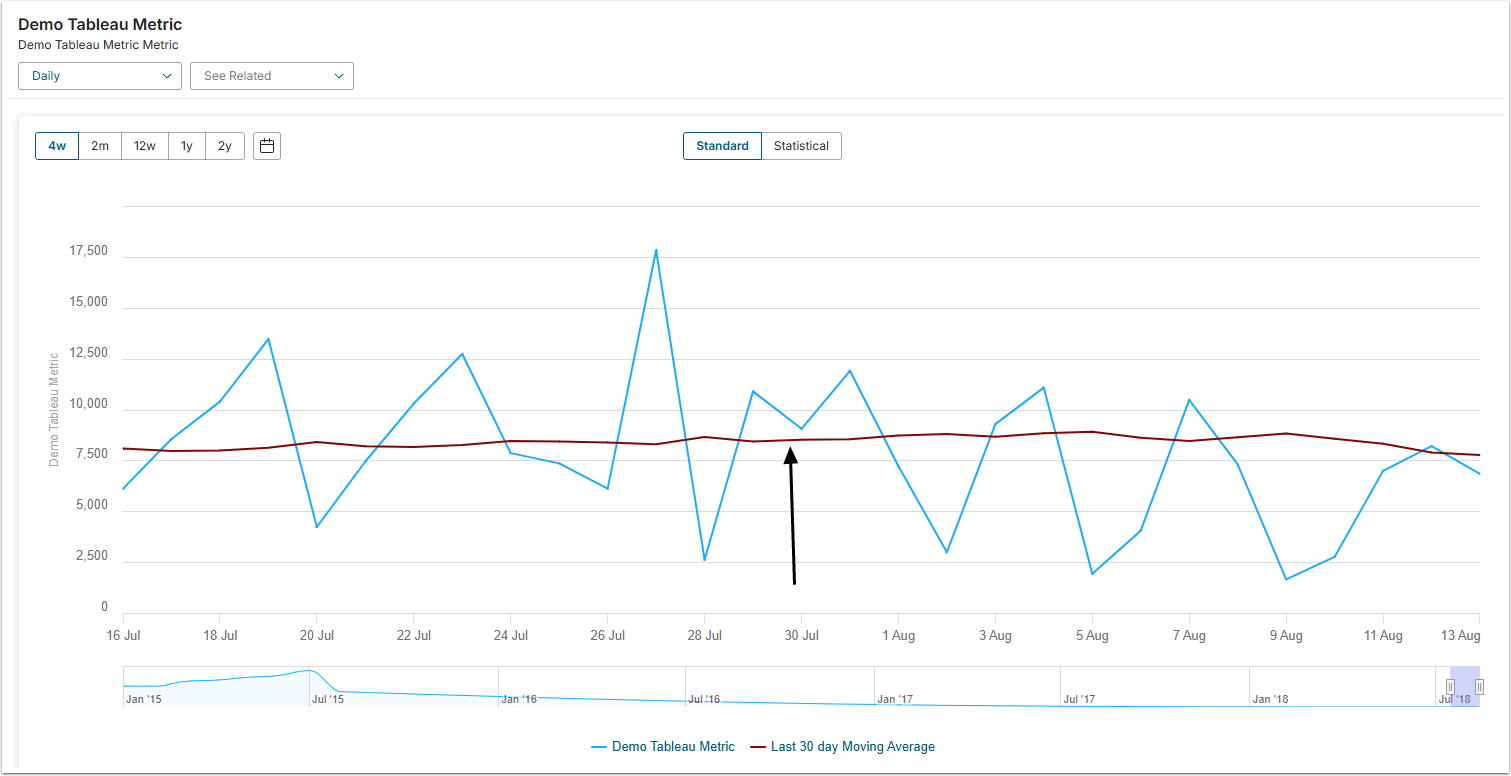
The legend describes the basis of the Moving Average calculation as set for the Metric and provides the format of its trend line.