Metric Insights allows Users to easily create a Statistical Model to find anomalies in data containing a large number of Dimension Values. This process can surface specific anomalies across thousand of records and Dimensions, allowing Reports and Metrics to be easily created with this reduced information.
For an example, we will create a Stats Model from an existing Dataset containing sales data from our test database. We want to find any values of 'Cost of Product', 'Sales Amount' or 'Gross Profit' that fall outside of 2 standard deviations from a 30-day moving average. We want to perform this evaluation across these dimensions: Country, Channel, and Product sub-category.
You can only create Stats Models on Datasets that 'keep history', aka Snapshot Datasets, and you need to use the 'All Data' View.
To learn more about security requirements for Power Users, check Understanding Power Users and Dataset/User Map Security Overview.
1. Creating Statistical Models from the Dataset Viewer
Stats Models can only be created from the 'All Data' Views.
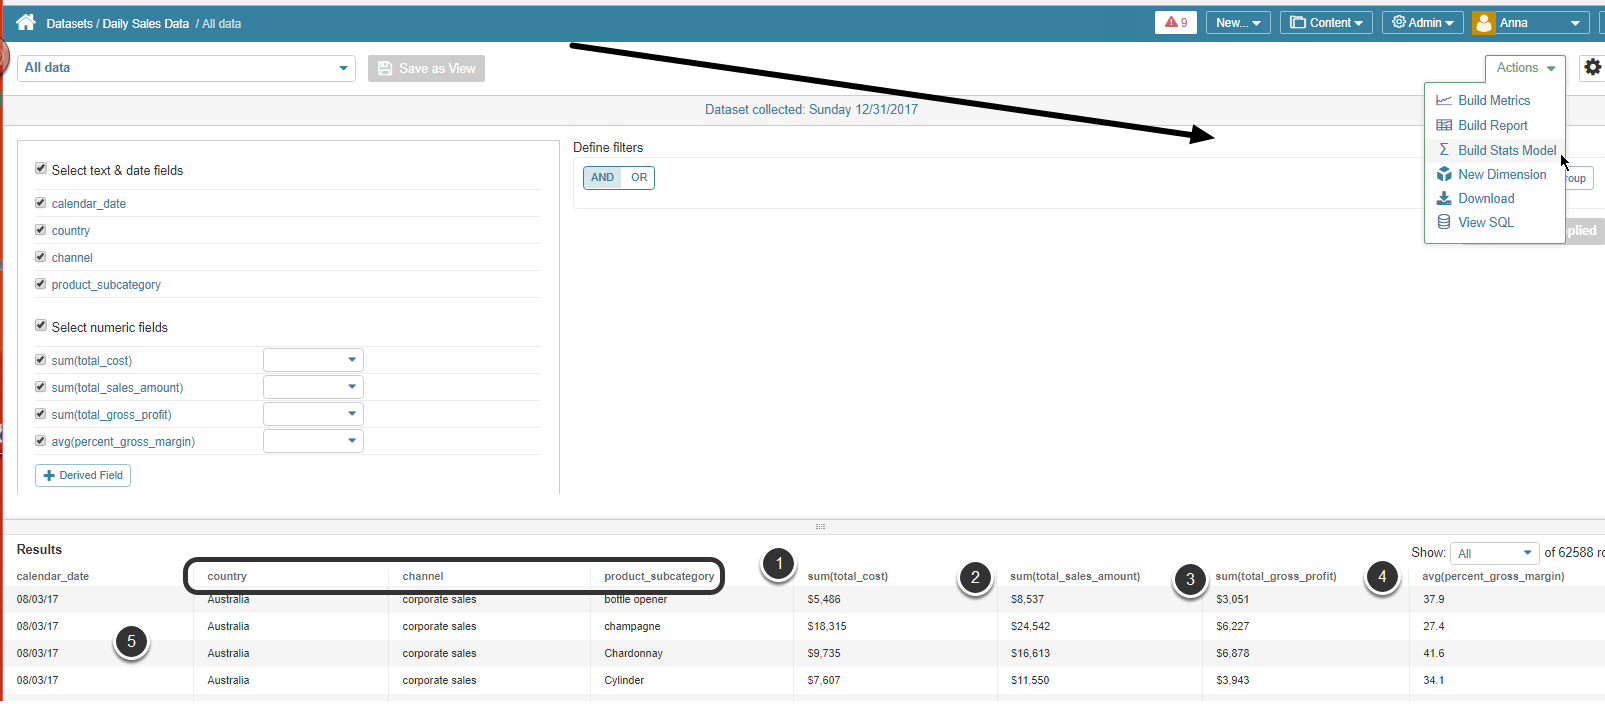
In our example, the All data View of the Dataset provides the following:
Measures :
- Cost of product
- Sales amount
- Gross profit amount
Dimensions:
- Product_subcategory
- Country
- Channel
2. Defining Settings
Access Actions > Build Stats Model to open the Stats Model Editor
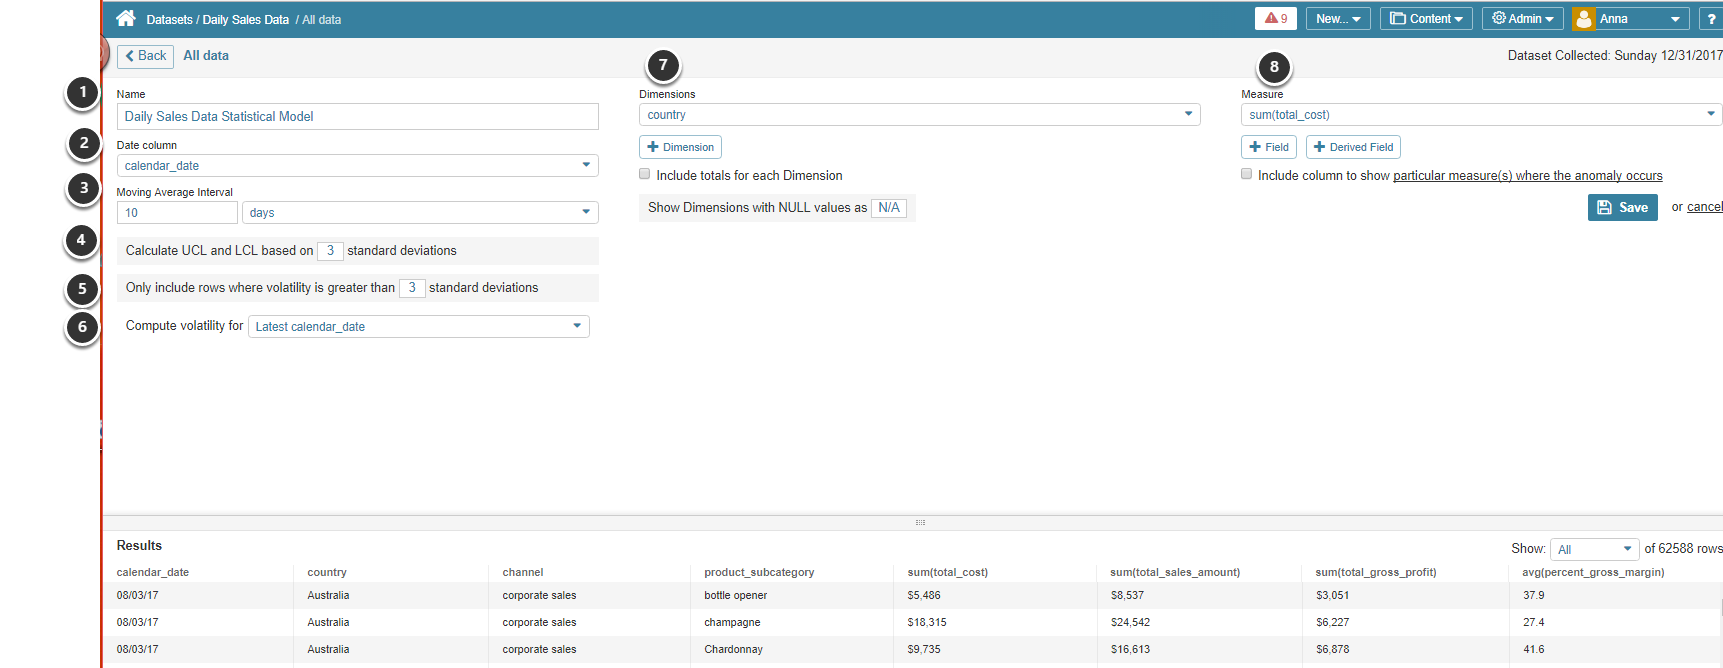
- Name: Default is 'Statistical Model' appended to your Dataset Name
- Date column: Choose a date from the Results field or use 'Snapshot Date' if your Dataset is snapshotted
- Moving Average Interval: Select a moving average range that will produce statistically relevant data
- Calculate UCL and LCL based on .. standard deviations: Upper (UCL) and Lower Control Limits (LCL) provide calculations used in I-MR statistics. Provide the multiplier used to generate upper and lower control boundaries
- Only include rows where volatility is greater than .. standard deviations: Set your Volatility limit to control the number of records returned in your Stats Model. The generated Stats Model returns only records that fall outside of a specified number of standard deviations. Lower numbers will include more significantly anomalous results
- Compute volatility for: You can compute volatility for the either the current (latest) Calendar date or for all Calendar values
- Dimensions: Dimension Value is defaulted, but can be changed or added to by clicking [+Dimension]
- Measure: Measure values is also defaulted but can be changed or added to by clicking [+Field]
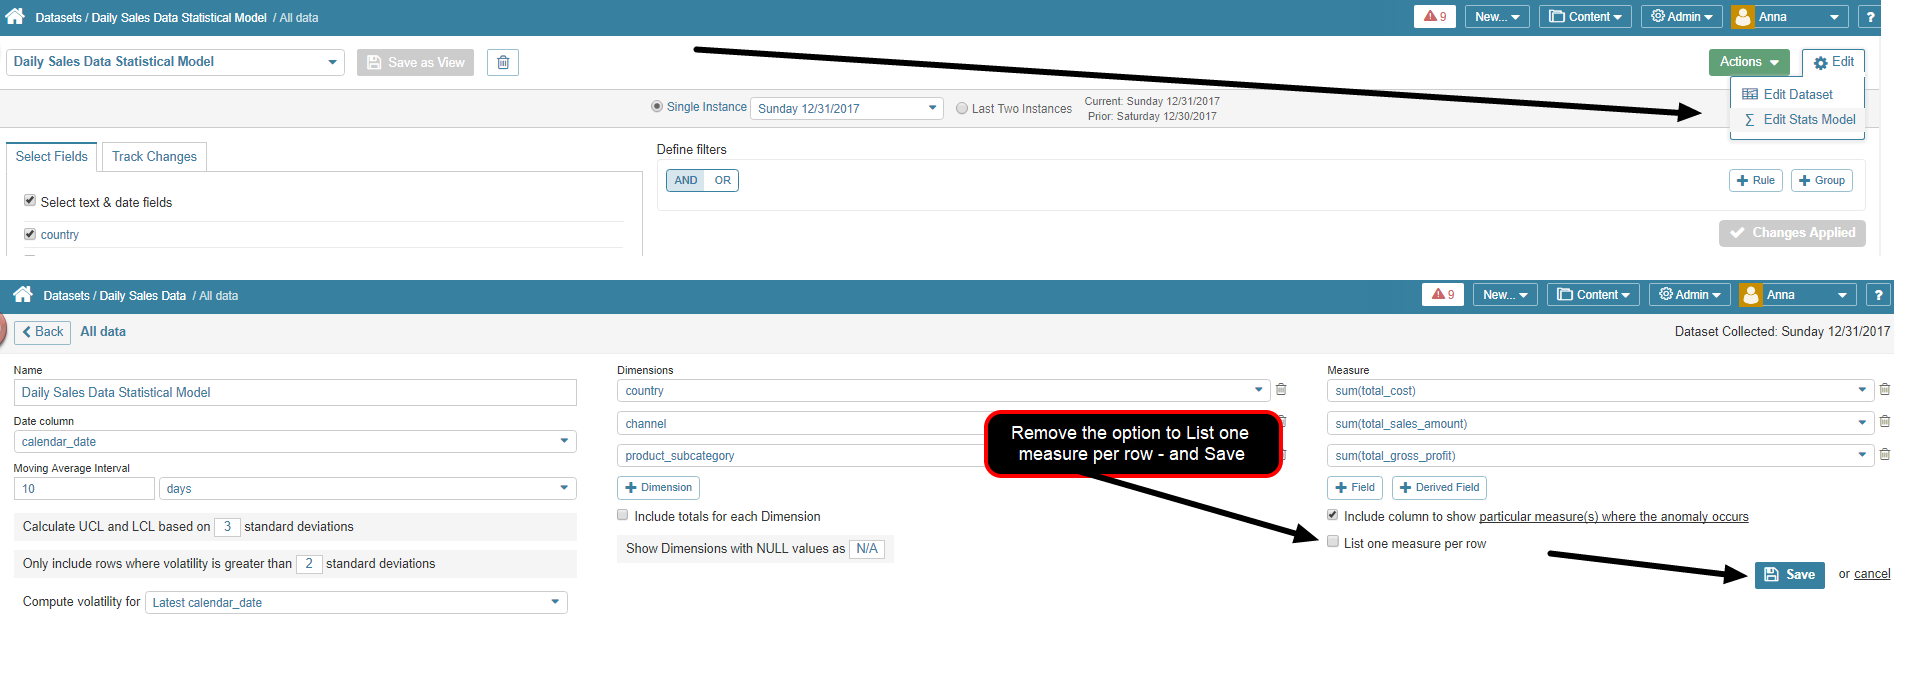
3. Select Dimensions (Filters) and Measures for the Stats Model Results
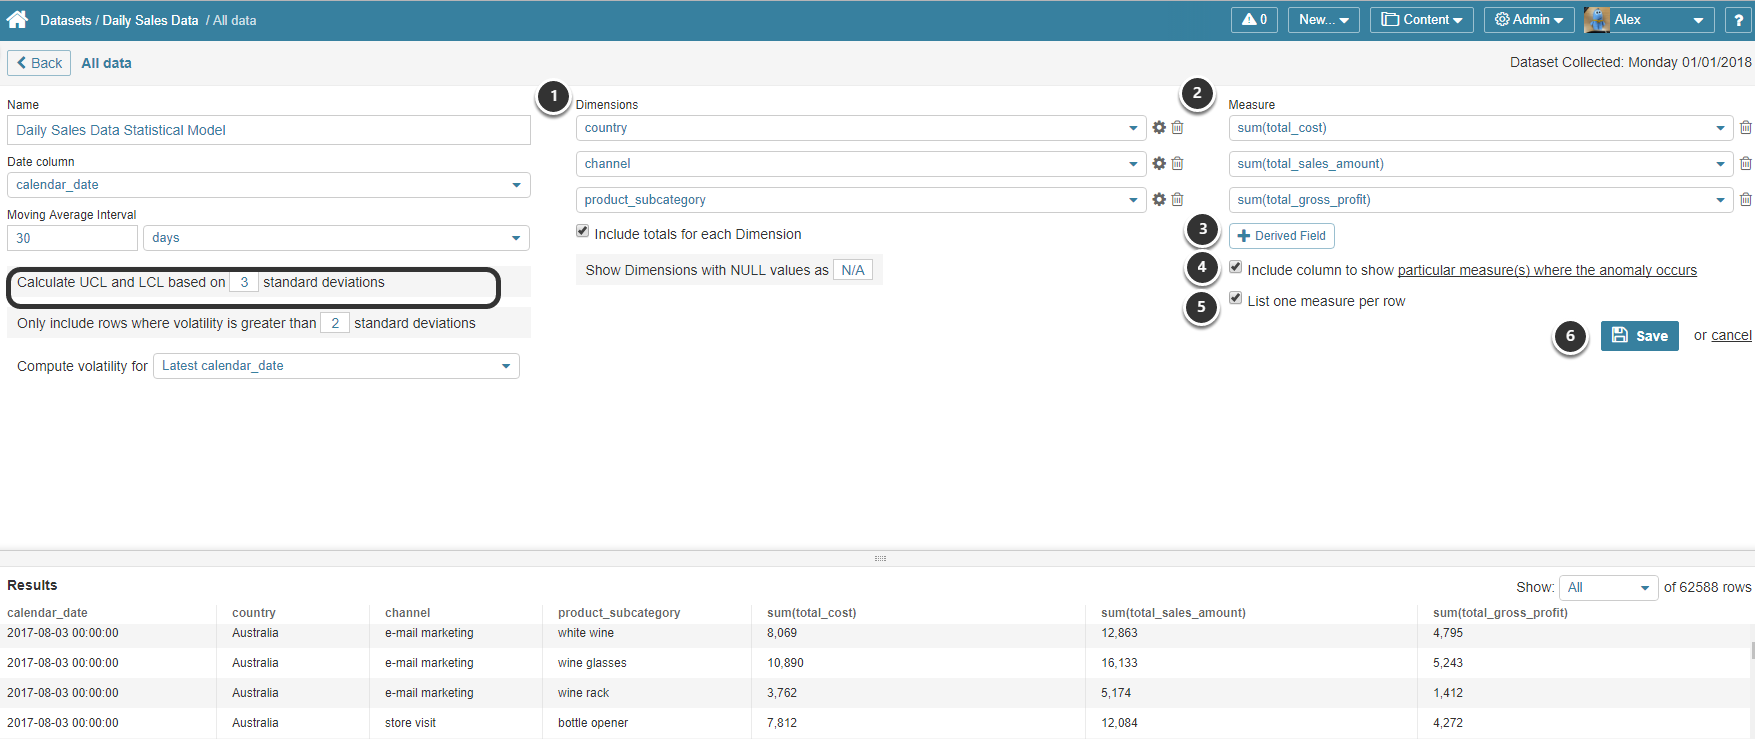
- Dimensions: There are 3 filters selected. The Include Totals for each Dimension checkbox is also selected to generate stats for every unique combination of filter values against all other filter values including aggregated totals. In this example, a Total Value will be calculated for All Countries, All Channels, All Product-subcategories, as well as all channels and products for each country, all countries and products for each channel, etc
- Measures: Select those measures you are interested in
-
[+Derived Field] to add add any number of computed fields
- For more details about Derived Fields, check Understanding Derived Fields article
- Include column to show particular measure(s) where the anomaly occurs: Check to include a generated column that concatenates all Measure Names greater than your specified volatility limit (in this example, all measures with values greater than 2 standard deviations from 30-day moving average)
- List one measure per row: Select to alternately display one row for each separate measure with an anomaly instead of concatenating
- [Save] to create your Stat Dataset
NOTE: Stat Dataset creation process may take some time and you can exit this page while processing is still going
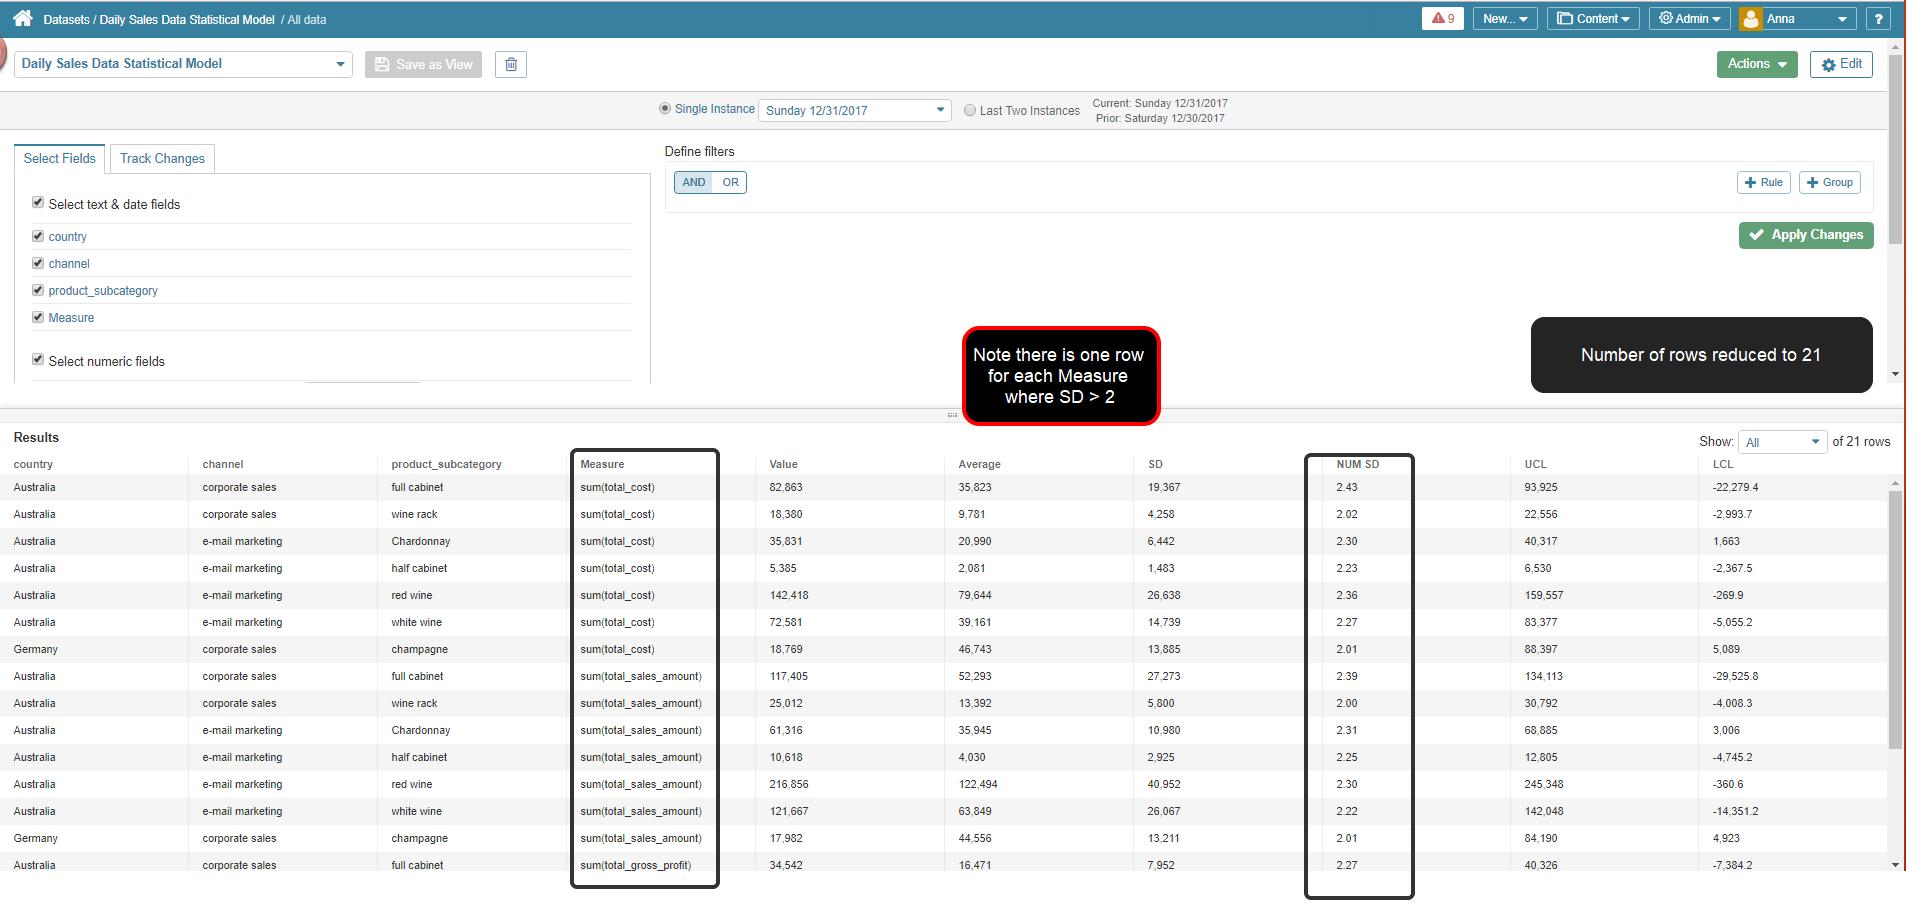
4. Review Results of One Row Per Measure Setting
5. Editing Stats Model
To change options access Edit > Edit Statis Model
6. Reading the Results

Review Results of this Model will quickly highlight those elements with Anomalies:
- For email Marketing in Australia, Chardonnay has anomalies in all 3 Measures - Total Cost, Total Sales Amount, Total Gross Profit
- For Website Visits in Australia, the Gift Set has only one measure showing an anomaly - Total Gross Profit
- And Germany is showing anomalies for Champagne in two channels
7. Save Stat Model as a New View
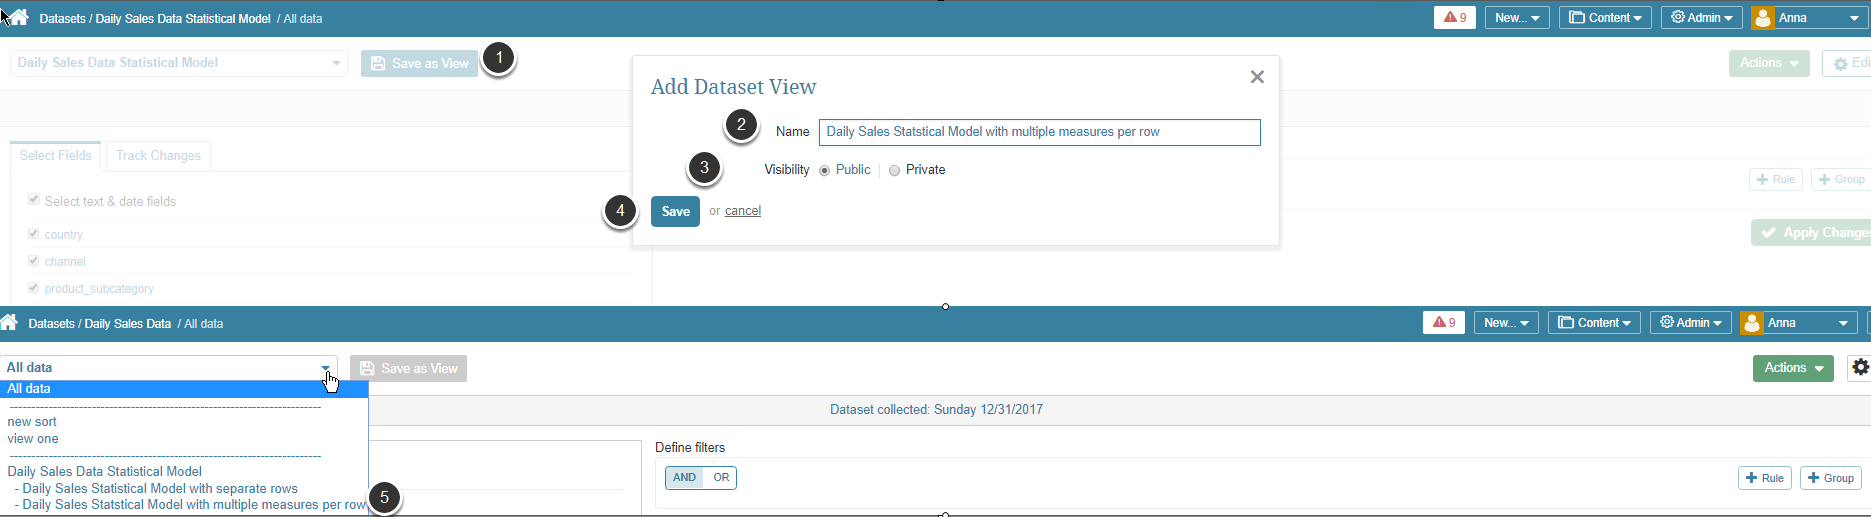
You can create Rules for the Stats Dataset and save these as Views.
- [Save as View]
- Name: Add meaningful name for your View
- Visibility: Select "Public" if you want others to be able to View and Use this Stat Model, otherwise it this view will only be available to you
- [Save]
- Statistical Models are saved as Views
All editing of Statistical Models must be done from the Dataset Viewer as Stat Datasets will not appear in Dataset List (Content > Datasets)
8. Creating Reports and Metrics from the View
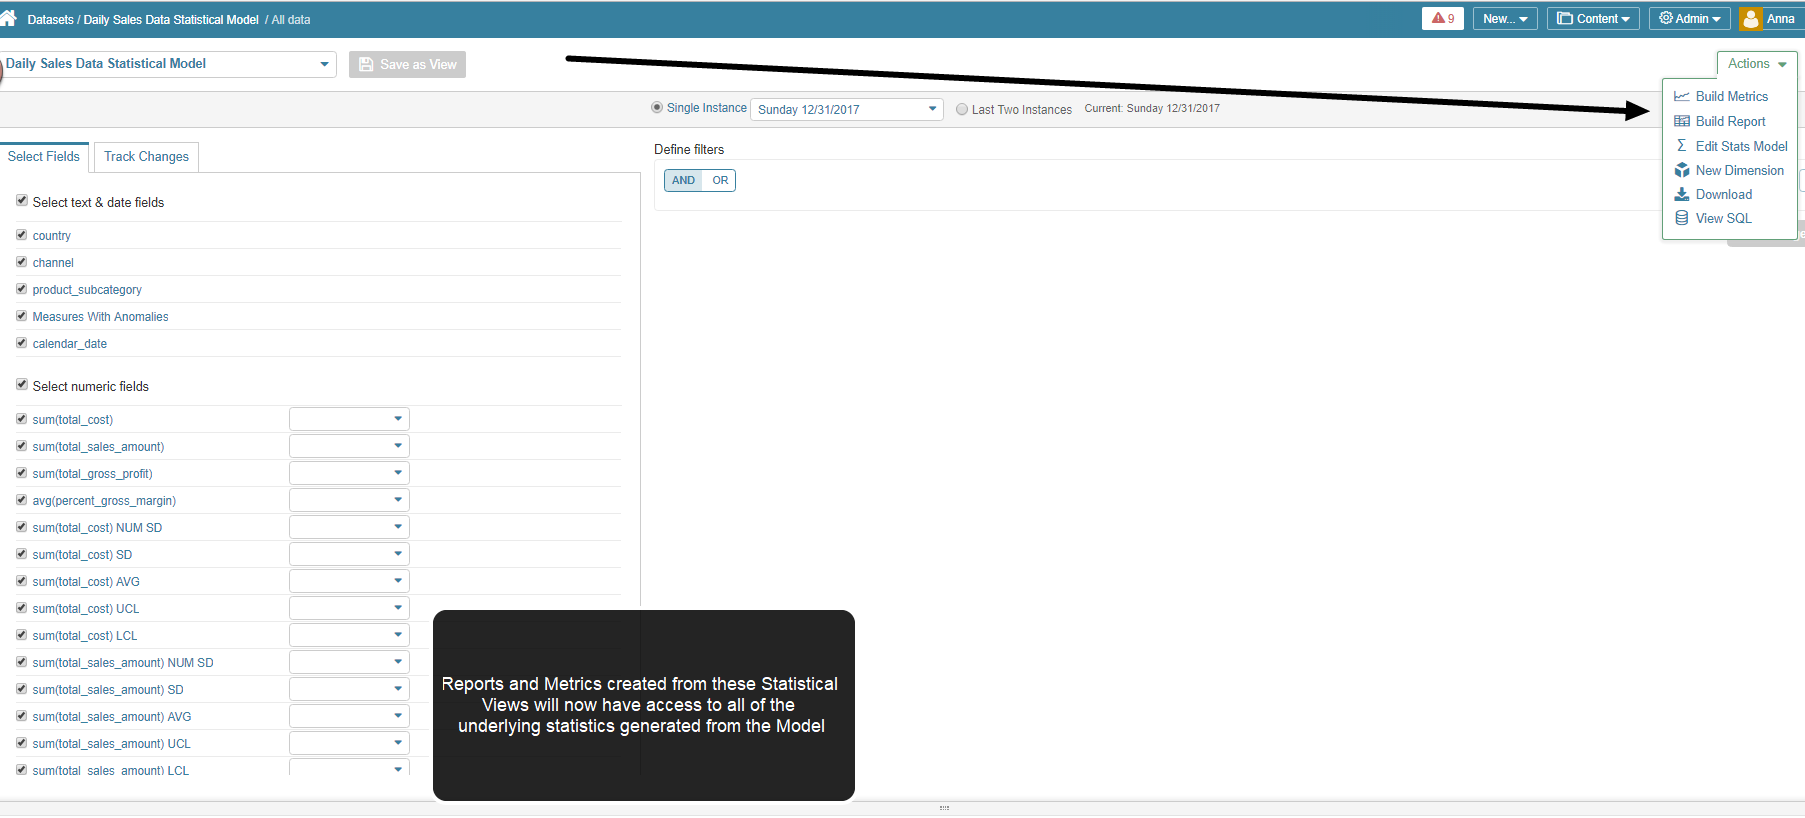
Selecting Action > Build Report will take you directly to a defaulted report that you can edit, or simply Publish and Enable to display on your Homepage.
For details on creating elements from Statistical Datasets refer to this article for more information: Sourcing Reports / Metrics / Dimensions from "Existing Datasets - SQL"