Metric Insights is a dockerized application. All logs from Docker containers are stored in one directory /opt/mi/log.
- See deployment details in Docker Deployment (Simple Installer) and Deploying Metric Insights in an Orchestrated Environment
- All logs are redirected to the rsyslog service that will store them in files. Alternatively, Splunk logging service can be used.
Table of contents:
NOTE: Metric Insights' logs follow the ISO-8601 standard of date and time representation.
- Example:
2025-01-23 10:35:00
1. Access the Log Files
1.1. Access Log Files via Status Monitor
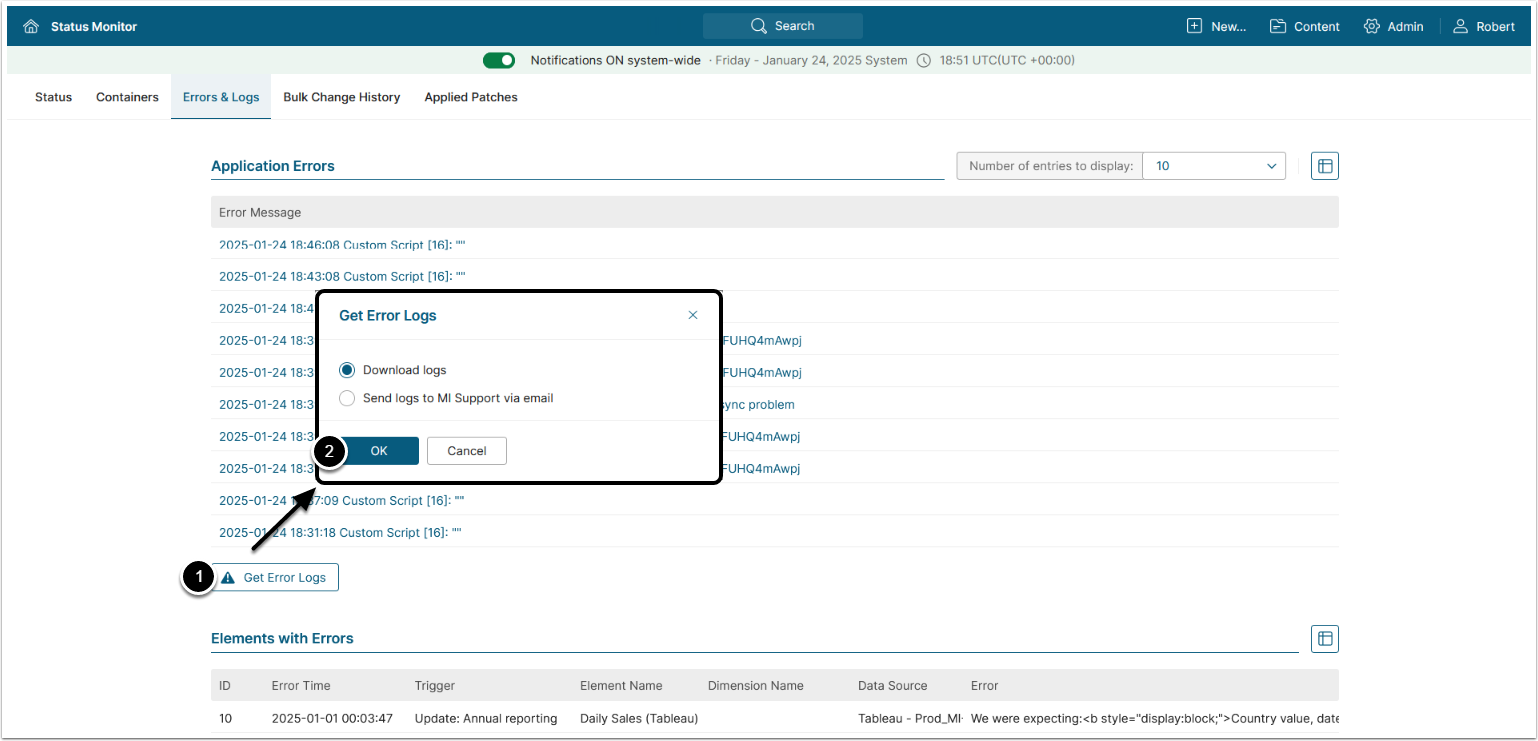
Access Admin > Status Monitor > Errors & Logs tab
NOTE: Logs from Status Monitor do not include Docker container logs, which can be accessed via MI Console or directly via Docker containers.
- [Get Error Logs]
- From the pop-up, you can download the logs (zipped) to your local machine or send them to our support team for assistance
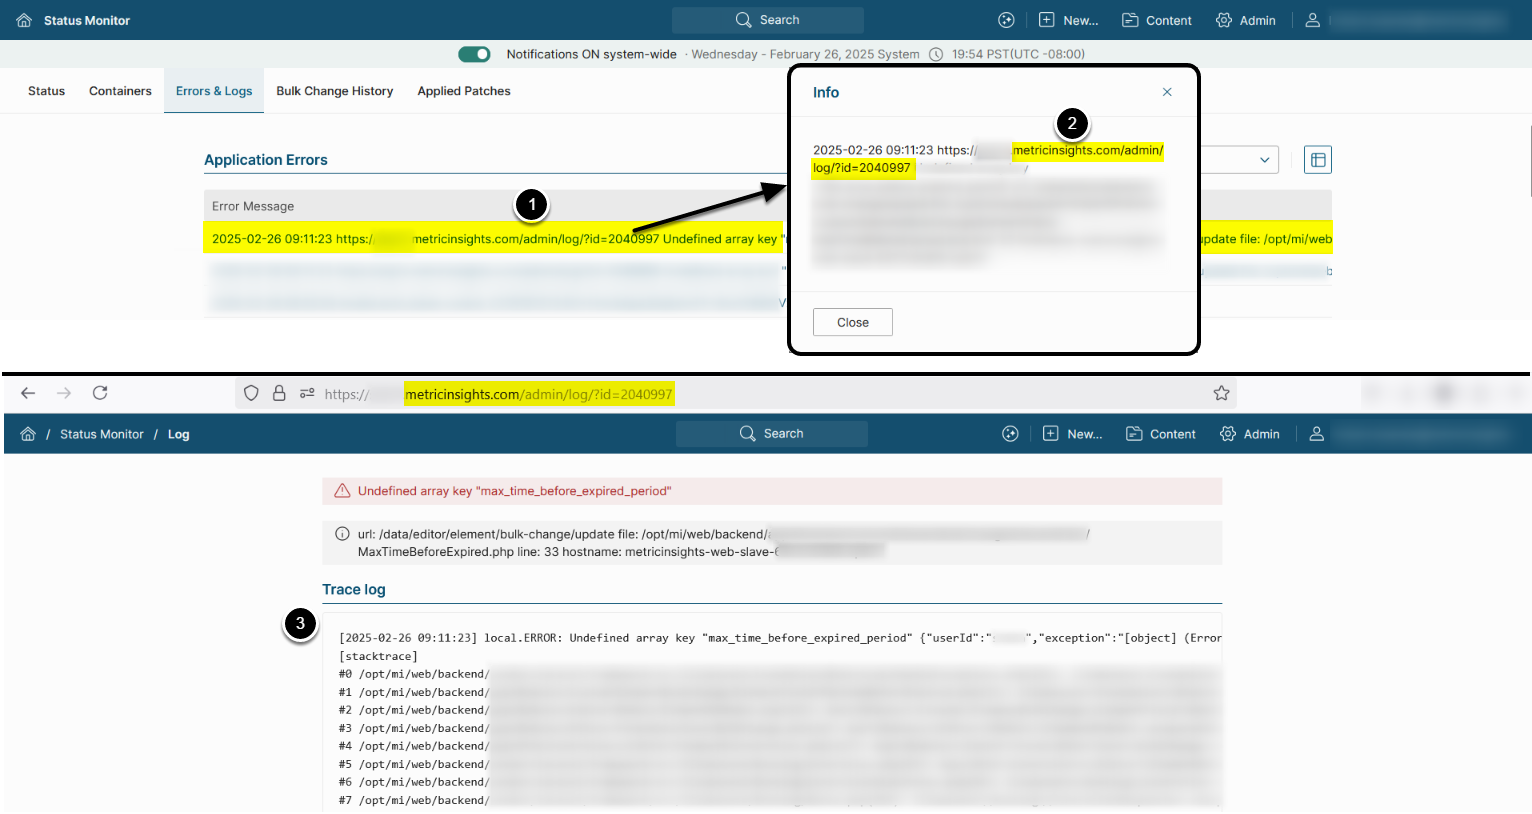
Access Verbose Logs from Status Monitor
NOTE: Verbose logging can be enabled for specific application errors. This is controlled by the System Variable ENABLE_APPLICATION_ERROR_LOGGING_INTO_DB. See Additional Logging Options for details on enabling it.
- Click on the Error Message
- Copy the link and open it in the browser
- The link has the following format:
<hostname>/admin/log/?id=<log id>
- The link has the following format:
- The verbose log is displayed in the Trace log section
1.2. Access Log Files via MI Console
NOTE: The MI Console is available beginning in v7.0.1.
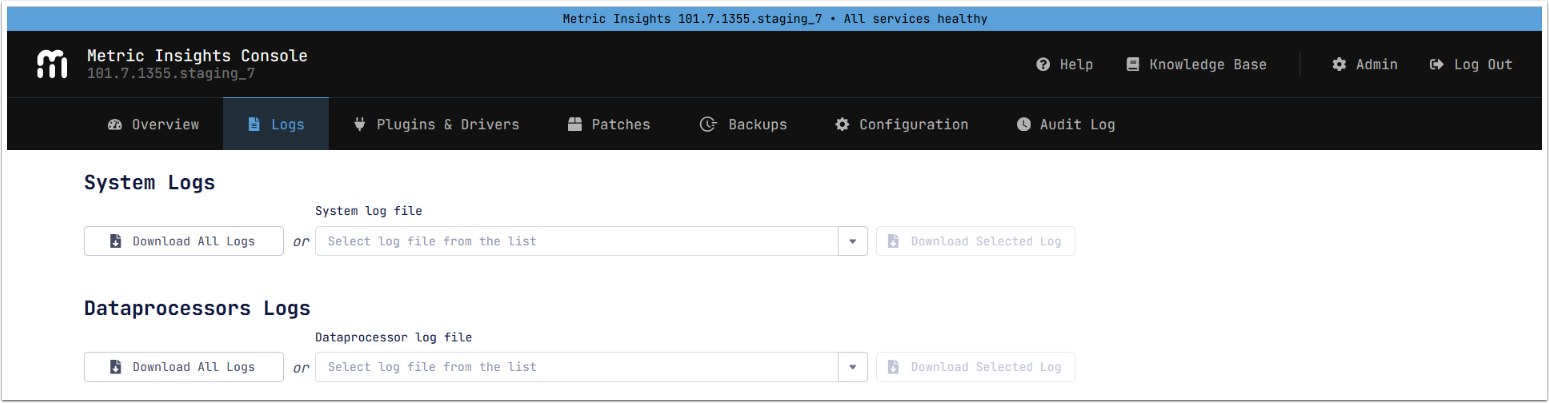
See the Logs section of the MI Console Overview article for details.
1.3. Access Log Files Directly via Docker Containers
All system logs are stored in the web container at /opt/mi/log. To access log files for a specific service, navigate to /opt/mi/log inside the corresponding container.
2. Log Files Description
See the logs description for your MI version and deployment type in the corresponding section:
MI v7
Simple Installation
Orchestrated Environments
Container Logs are managed by the orchestration service and can be accessed using the respective commands:
- Kubernetes (K8s): Use
kubectl logs -n <namespace> <pod id>. - ECS: All logs are available in AWS CloudWatch.
- Docker Swarm: Use the default Docker command:
docker logs.
The table below describes log files available for all orchestrated environments.
MI v6
Simple Installation
Orchestrated Environments
3. Additional Logging Options
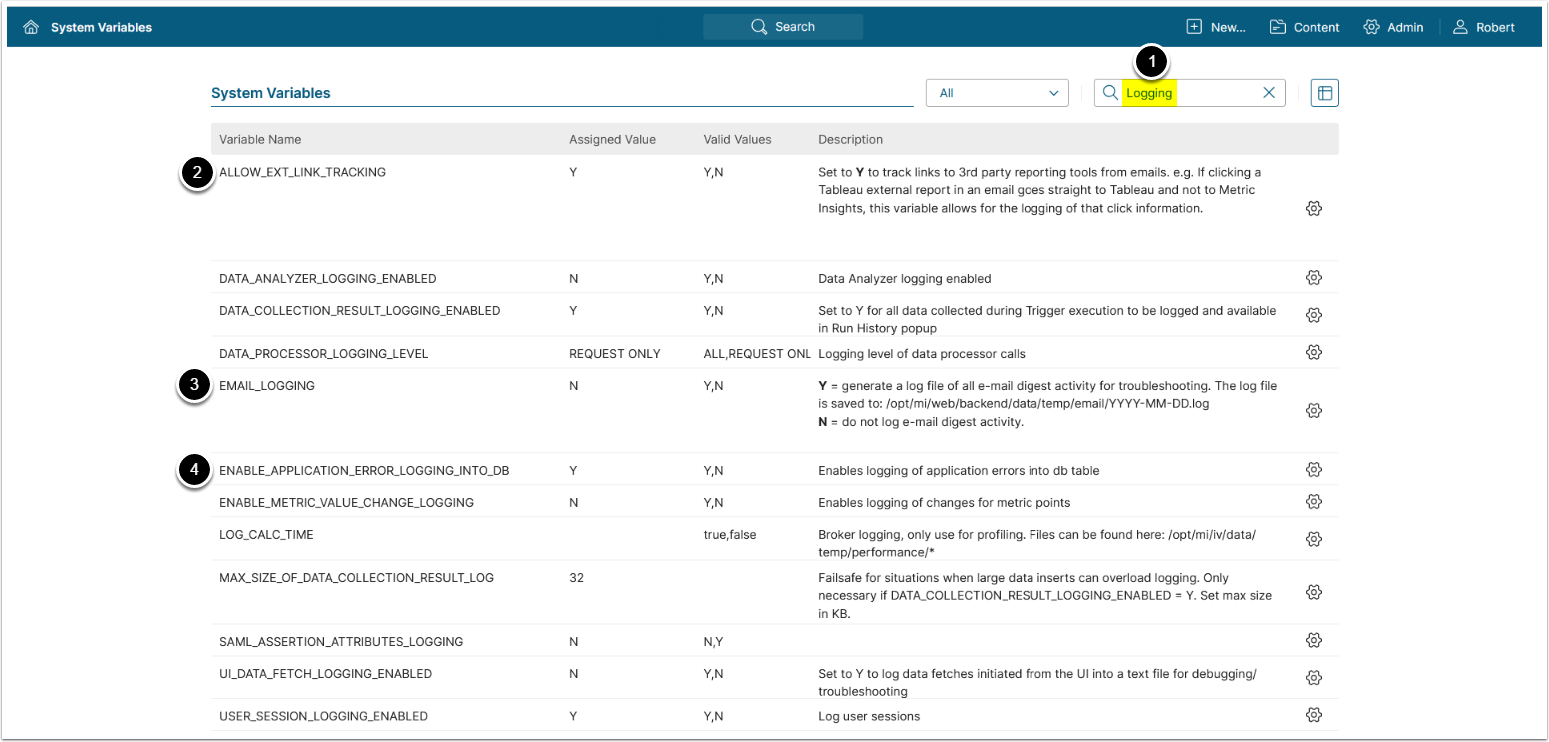
Access Admin > System > System Variables
NOTE: See Setting System Variables for details on System Variables configuration.
Logging for different components of MI application can be configured via System Variables:
- Enter
Loggingin the search field - Set
ALLOW_EXT_LINK_TRACKINGto 'Y' to enable tracking of links to 3rd party reporting tools from emails. This information is stored indashboard_element_view_log_detailtable in thedashboarddatabase - Set
EMAIL_LOGGINGto 'Y' to generate a log file of email digest activity for troubleshooting- See Check Email Log Files for details
- Set
ENABLE_APPLICATION_ERROR_LOGGING_INTO_DBto 'Y' to enable more detailed MI application error logs, accessible via Admin > Status Monitor > Errors & Logs- See Access Verbose Logs in Status Monitor for details
- NOTE: This System Variables configures only MI application errors and does not include Data Source connection errors, which have separate logging in the
dataprocessorcontainer.
4. Enable Log Duplication to Container Stdout
Beginning in v7.1.2, Metric Insights logs can be optionally redirected to the container standard output (stdout). This feature is controlled by the MI_LOG_ENABLE_STDOUT_REDIRECT environment variable. This enhancement supports integration with external log aggregation tools that require access to container-level log streams. When enabled, logs from /opt/mi/log/mi.log are duplicated to stdout, while the original file-based logging remains active. This ensures no disruption to internal monitoring tools, including Status Monitor.
Simple Install:
- Add the following to
/opt/mi/config/deployment/credentials/web.env:
MI_LOG_ENABLE_STDOUT_REDIRECT=true- Re-create the
webcontainer:
mi-control up -d --force-recreate webOrchestrated Deployments (Kubernetes example):
- Edit the deployment manifest for both
Web MasterandWeb Slavepods:
- name: MI_LOG_ENABLE_STDOUT_REDIRECT
value: "true"- Apply changes using:
kubectl --namespace <namespace> apply -f deploy.yml