Accessed via Content > Content Center > Portal, the Engagement feature provides better understanding on content usage, how users interact with it, and how active they are. This grants control over unused content and inactive users as well as helps free up valuable resources. Engagement page includes four tabs that reflect the same data, but differ in representation. The article elaborates on the capabilities of each tab.
- See more information on Engagement in Track Content Engagement Counts
PREREQUISITES:
To allow Power Users to access Content Center, the Power User must be granted the Use Content Center Privilege.
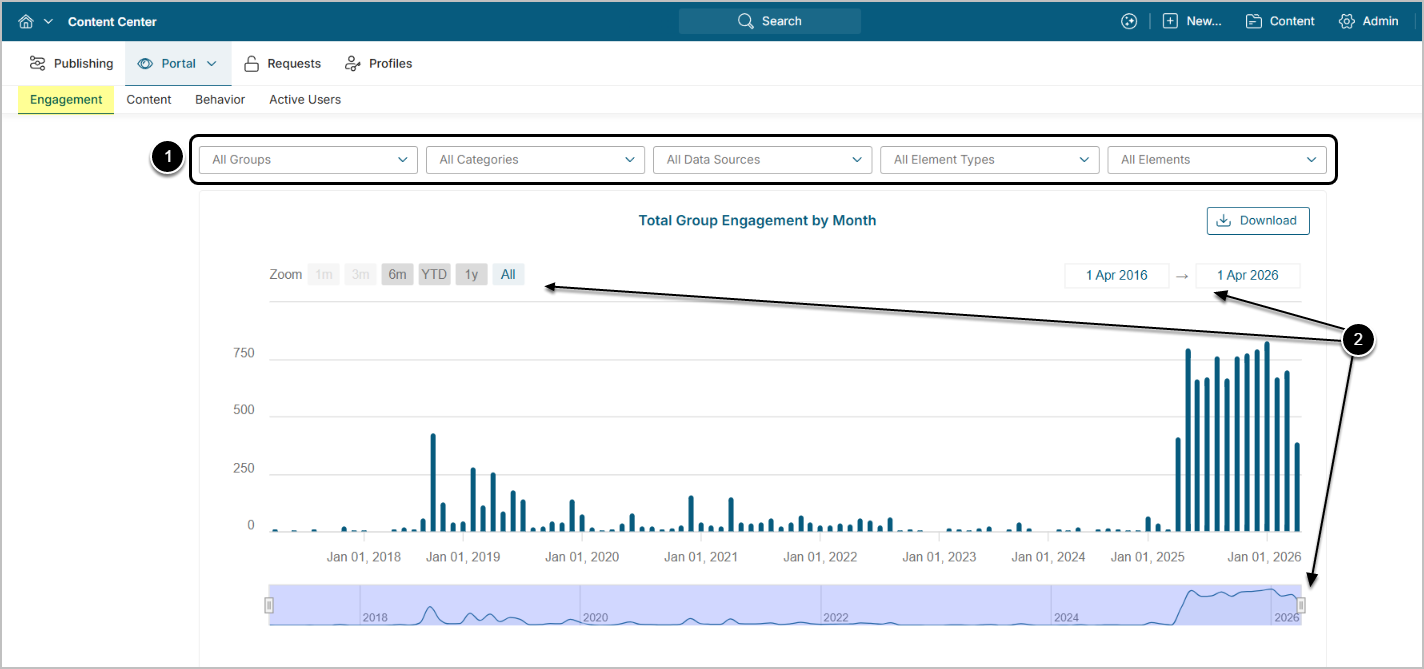
Engagement
The chart below shows total engagement with all Elements from all users in the system by month.
You can filter the display by using:
- The options in the filter bar
- The three options for filtering by time period
Engagement = Views from Element Viewers on desktop + Views from Element Viewers on MI mobile apps + Number of distributions
Distributions include:
- Bursts
- Favorite Digest
- Immediate, Monthly, Daily, and Weekly Report Digests
- Collaboration Notifications
- Immediate Alerts
For each distribution method: 1 engagement count/per user/per day (counted per Element)
For Example, a Burst goes out on Monday, Tuesday, Wednesday to 1 user, with the same Element.
- Monday: 1 total engagement
- Tuesday: 2 total engagement
- Wednesday: 3 total engagement
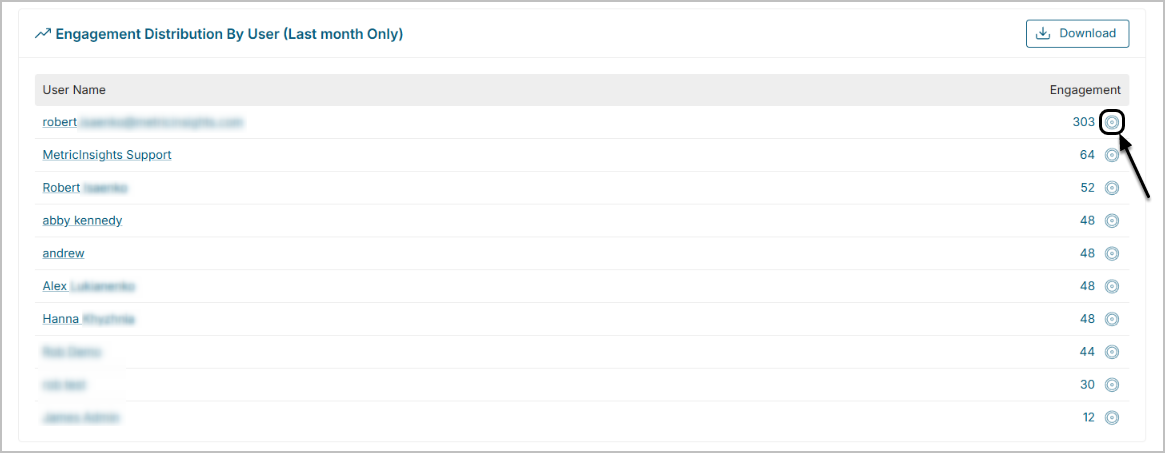
The grid below shows top 10 users who interact with content the most over the last 30 days. Clicking the target icon will take the User to the Behavior Tab.
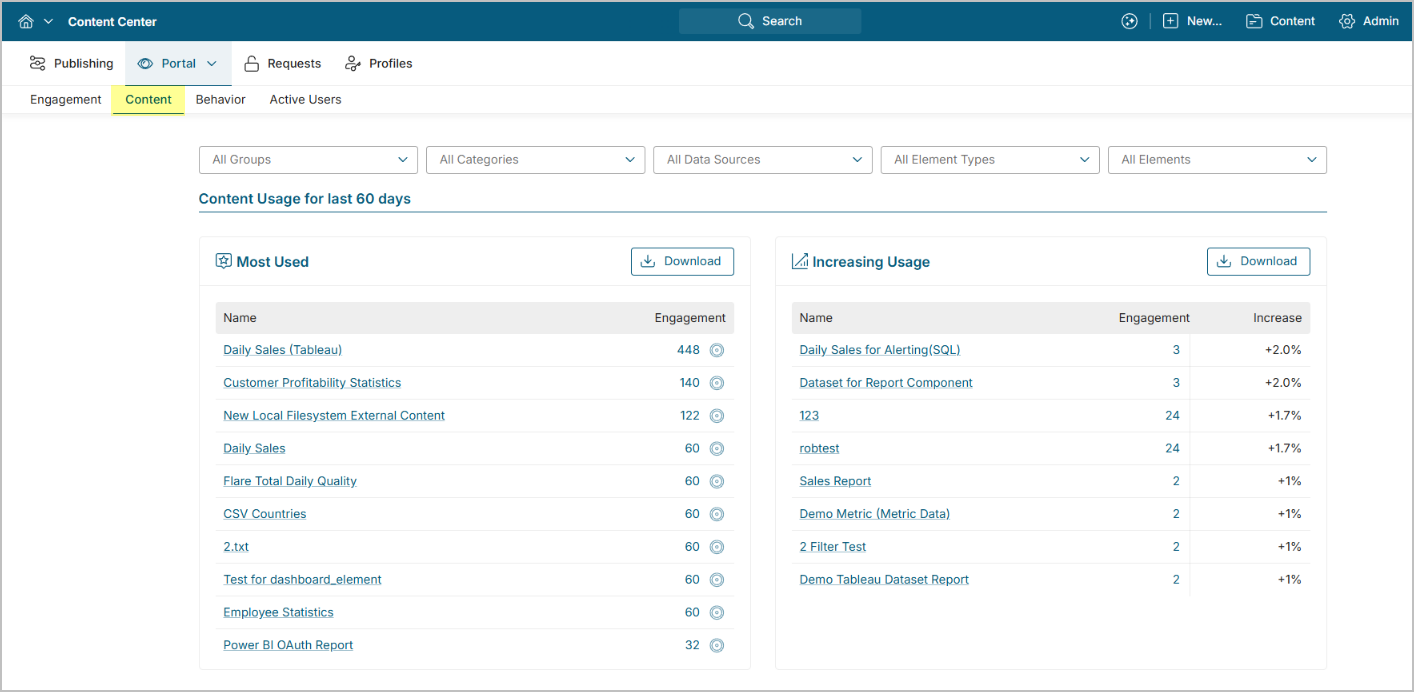
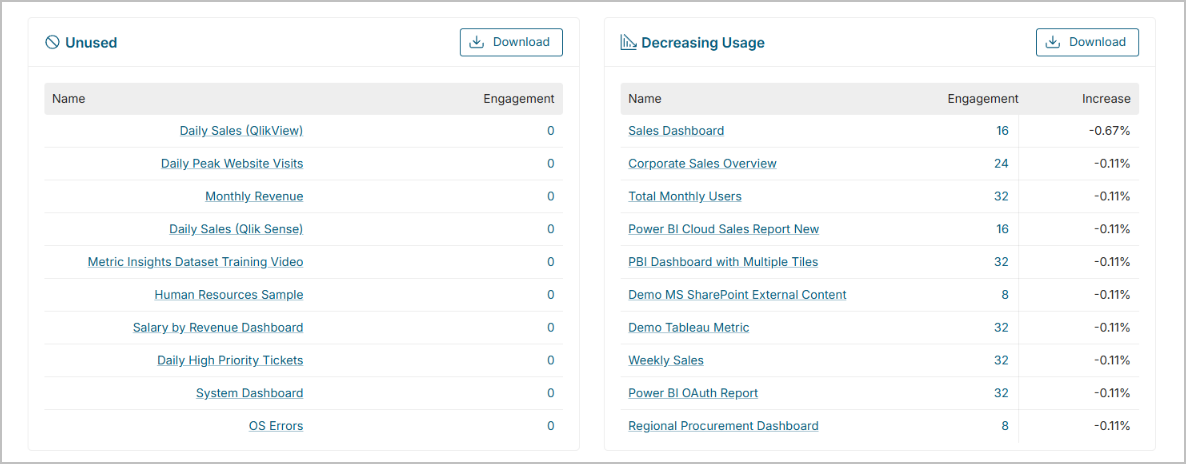
Content
This Tab reflects engagement from the standpoint of content and its usage over the last 60 days.
- Most Popular shows the most popular Elements based on engagement.
- Increasing Usage reflects most used Elements.
Increasing/Decreasing Usage = (Total amount of Element views for the last two months / total amount of Element view for two preceding months - 1) x 100
For example, in August the popularity will be calculated in the following way:
- Views in June: 60 + Views in July: 90 = 150
- Views in April: 40 + Views in May: 60 = 100
(150 \ 100 - 1) x 100 = 50%
The following two grids show top 10 Elements that:
- Have not been accessed or updated during the last 60 days;
- Are decreasing in usage.
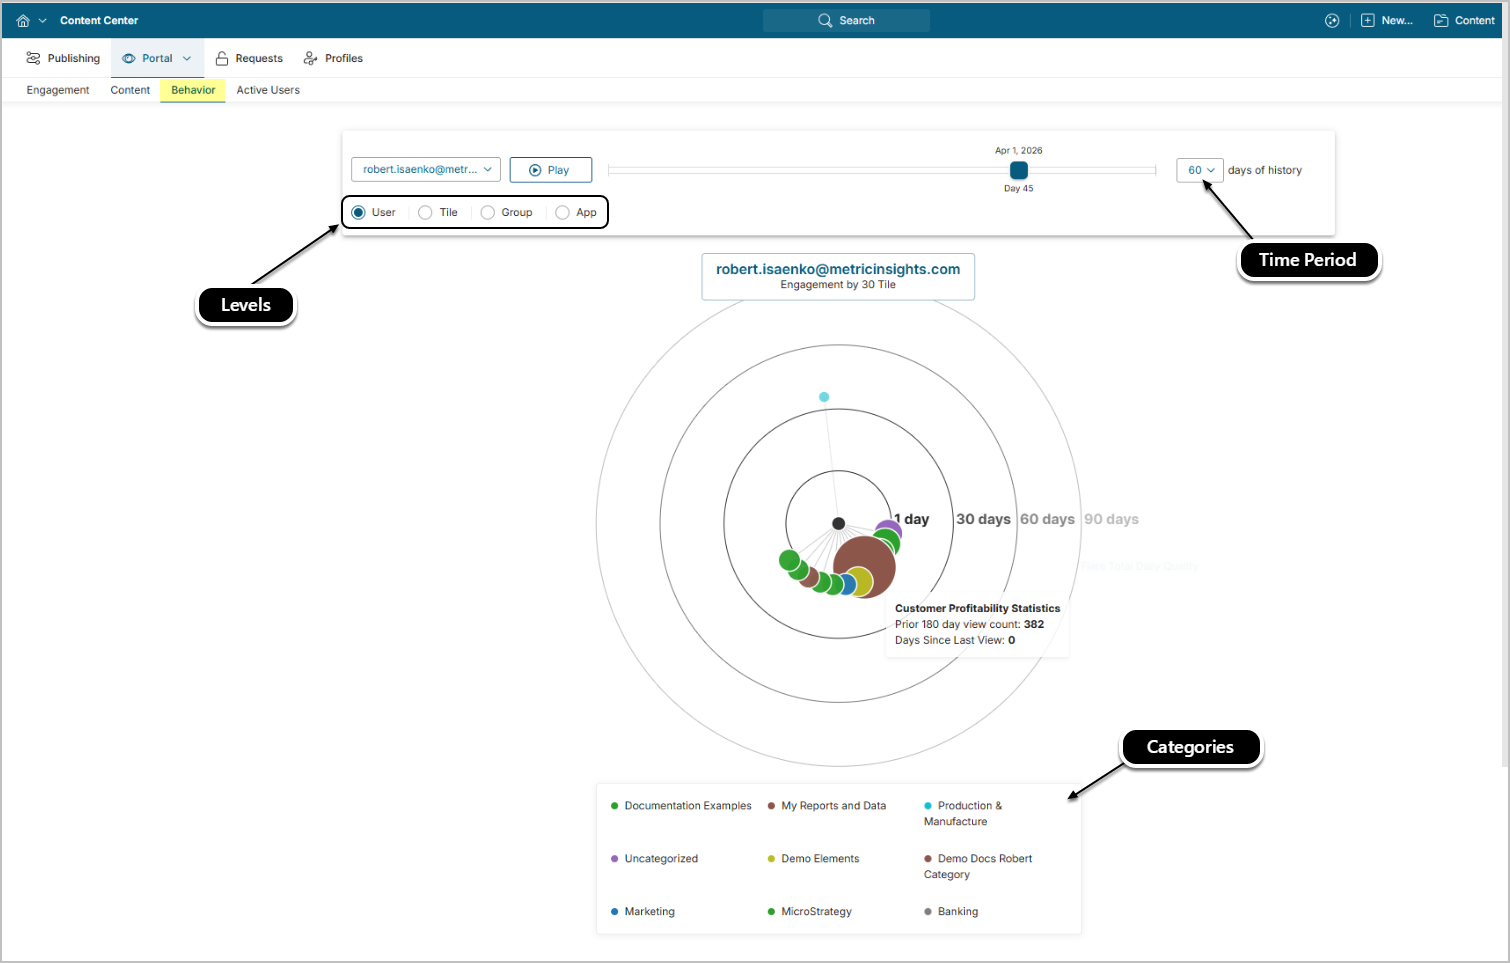
Behavior
Depending on the Level selected, users can view an interactive visualization of how:
- User interacts with content over time;
- Users interact with particular Elements over time;
- Group interacts with content over time;
- Users interact with particular Apps over time.
If the tab includes more than 100 Tiles to display, they will be grouped by a Category.
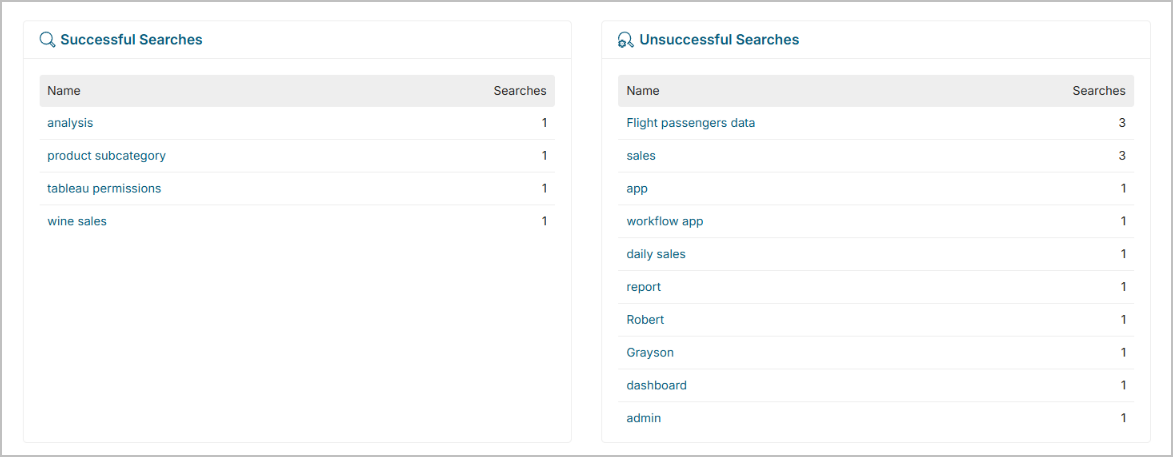
The following two grids display successful and unsuccessful searches conducted via Global Search by all users in the system.
- A search is considered successful if users have clicked on any of the suggested search results.
- A search is considered unsuccessful if users have not clicked on any of the suggested search result.
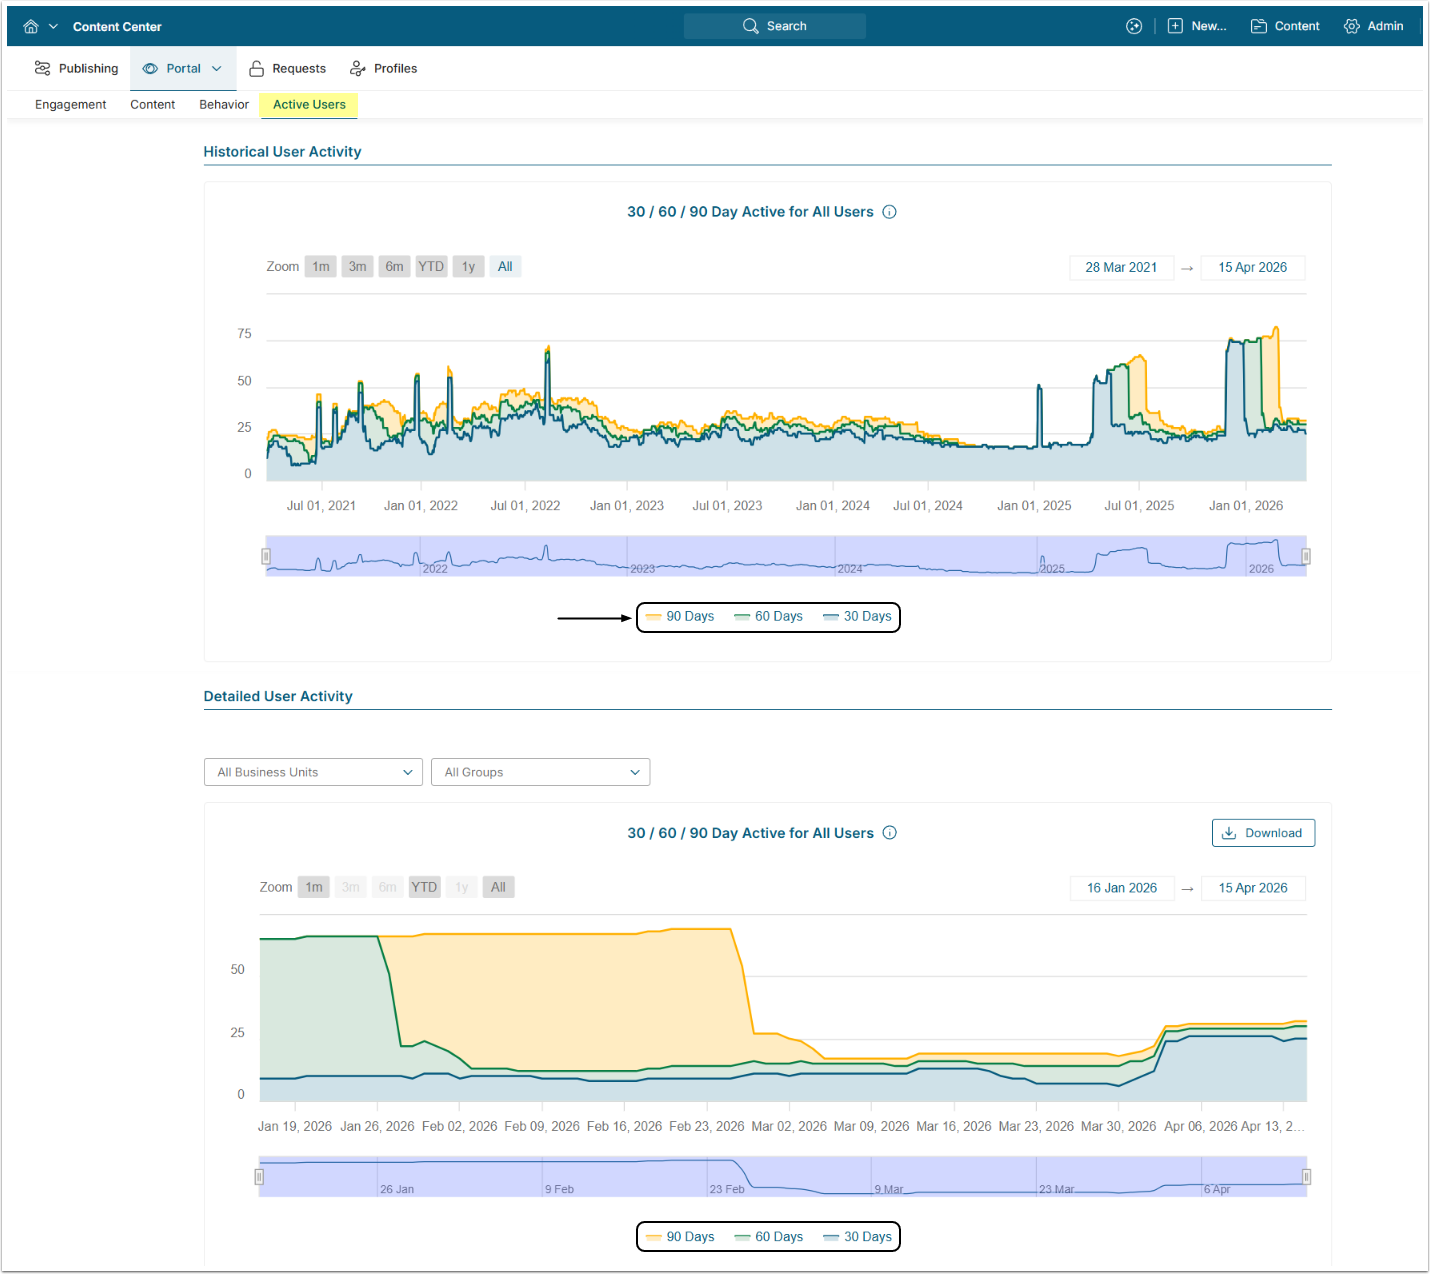
Active Users – for Admins Only
The chart shows active users for specific time periods, offering two complementary views:
- Historical User Activity Displays pre-calculated user activity data spanning the full history of available records. This chart does not support group or business unit filtering but provides long-term trend visibility without additional database load.
- Detailed User Activity Displays user activity calculated on-the-fly for a configurable time period, supporting filtering by Group and Business Unit. The default period is controlled by the USER_ACTIVITY_DEFAULT_PERIOD System Variable. Because data is computed dynamically, the available date range may be limited to manage database performance.
Admins can choose to display three periods at once or add them one by one.
Active Users are users that log in to the system or receive emails from Metric Insights.