In Metric Insights, Users can add Alert Rules directly to a Dataset Report. An Alert Rule is a set of conditions applied to the Report values. When these conditions are met, an Alert Event is triggered and the User receives a notification.
The Report Metric component allows users to view Alert Events directly on the chart, making it easier to quickly evaluate and analyze them visually.
This article describes how to add Alert Rules to the Dataset Report and then show Alert Events via the Report Metric component.
In this article:
- Start Adding Alert Rule
- Configure Alert Rule
- Add Report Metric Component
- Check Alerts
NOTE: For the Alerting feature to work for a Dataset Report, the Report must be created from a Snapshot Dataset.
1. Start Adding Alert Rule
Go to the Dataset Report Editor and open the Content tab.
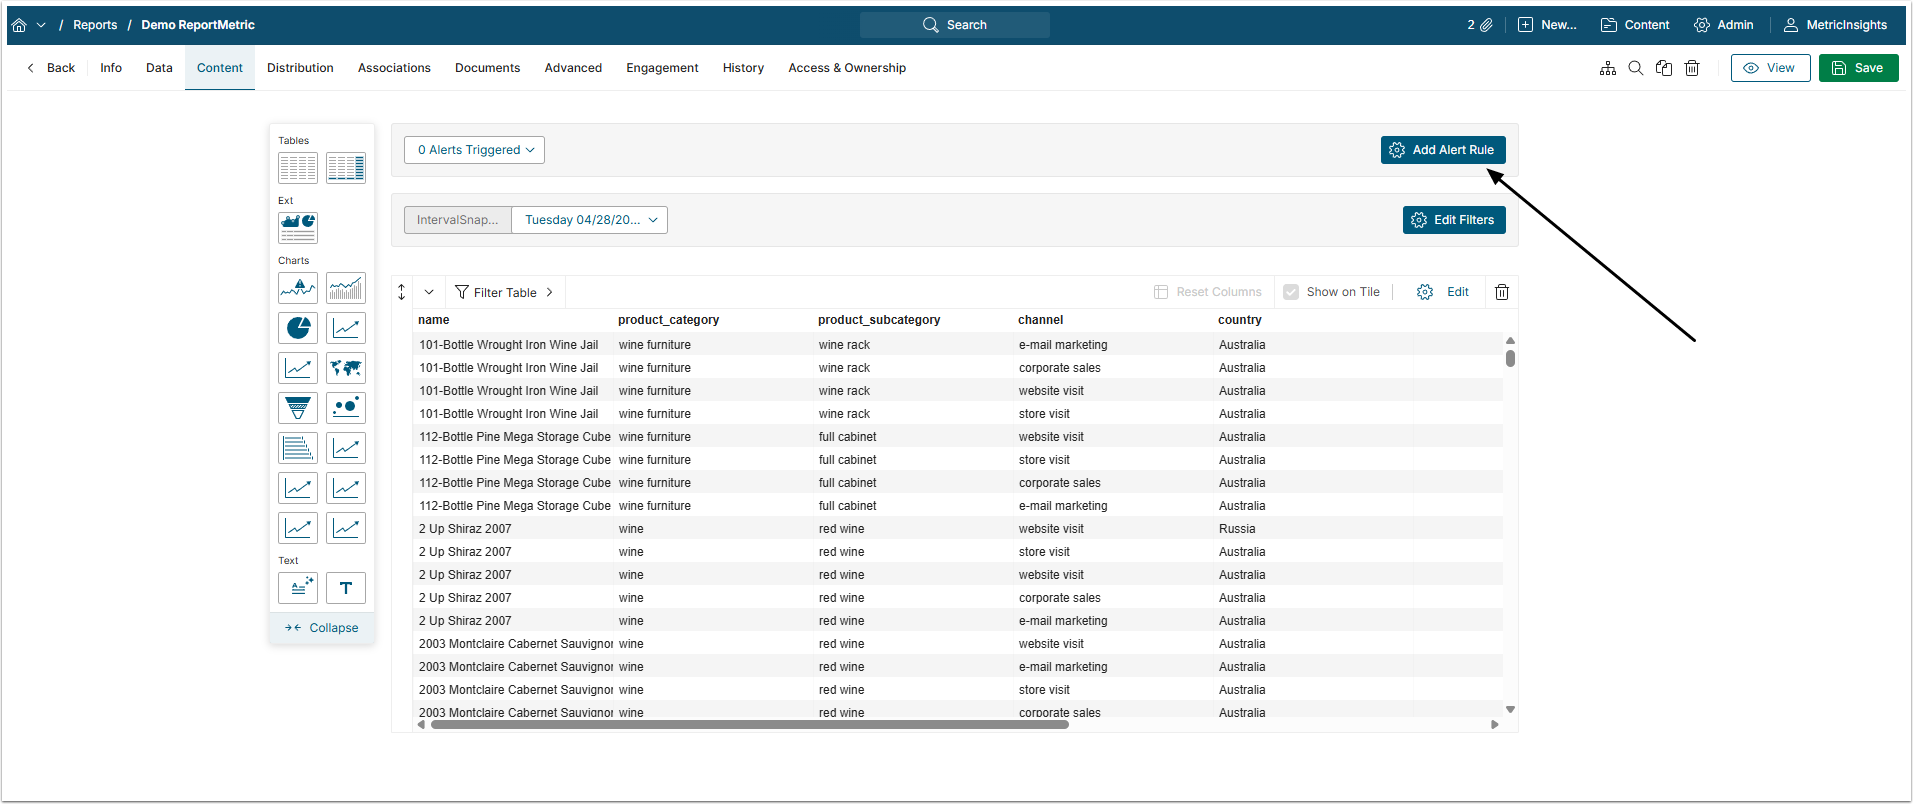
Click [Add Alert Rule].
2. Configure Alert Rule
2.1. Select Type
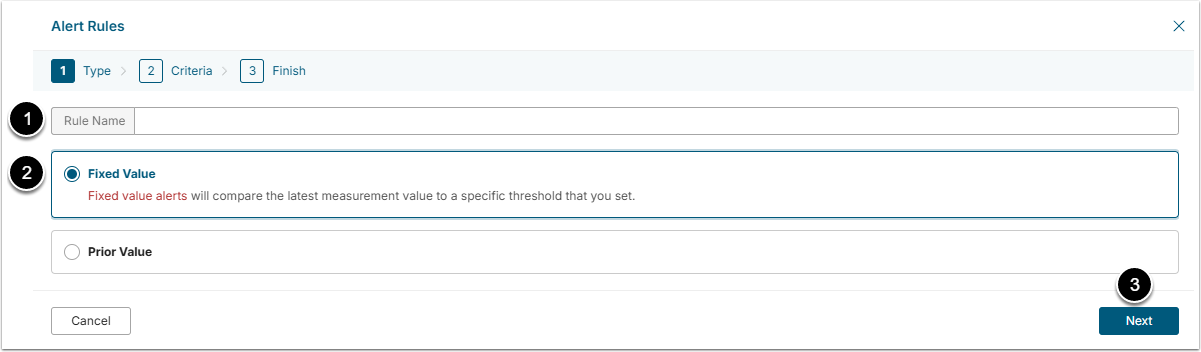
- Name: Give the Alert Rule a descriptive name.
- Select the Type:
- Fixed Value: The latest measurement value will be compared to some chosen threshold.
- Prior Value: The latest measurement value will be compared to one of prior values.
- [Next]
2.2. Select Criteria
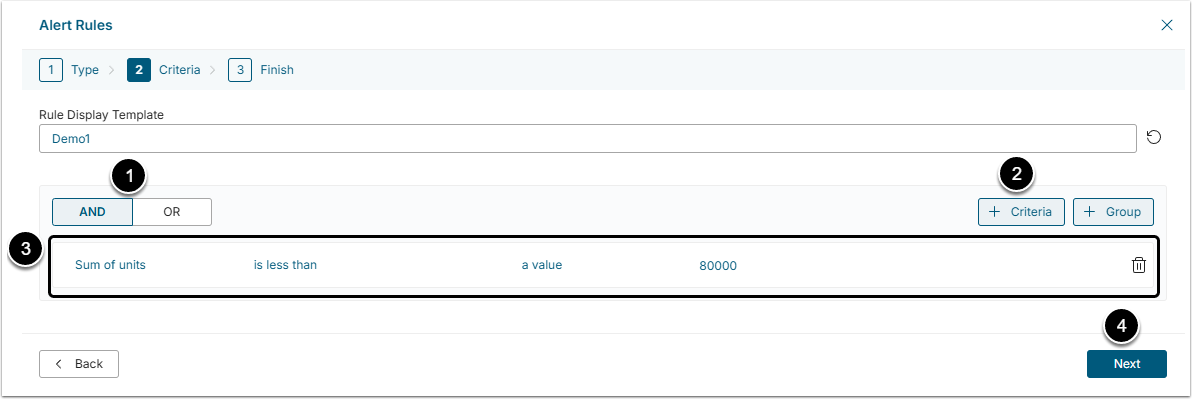
- Define how the Criteria will combine:
- AND: The Alert will be triggered, when all the Criteria are met.
- OR: The Alert will be triggered if any of the Criteria is met.
- [+Criteria] to add one Criteria and [+Group] to add an additional Criteria set.
- Set the Criteria by clicking on the parts of the formula and selecting options from the drop-down menus.
- [Next]
2.3. Finish Configuration
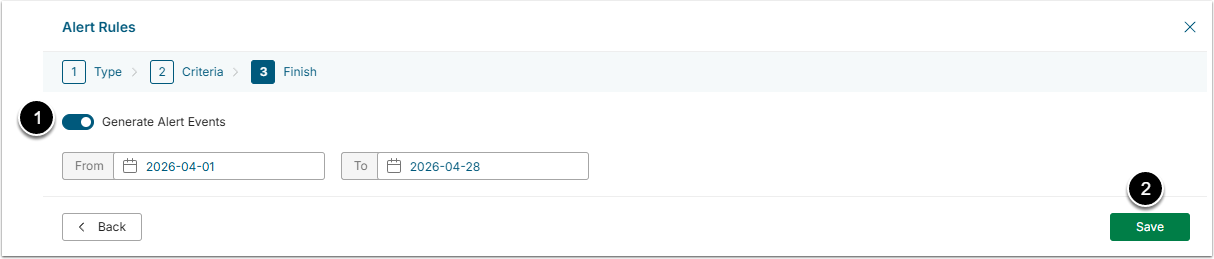
- Enable Generate Alert Events to create Events, visible on chart and choose the time period for them.
- [Save]
3. Add Report Metric Component
Report Metric is an Dataset Report component that displays Alert Events on the Line Chart. Alert Event is a point on the chart where the Alert Rule met the set conditions.
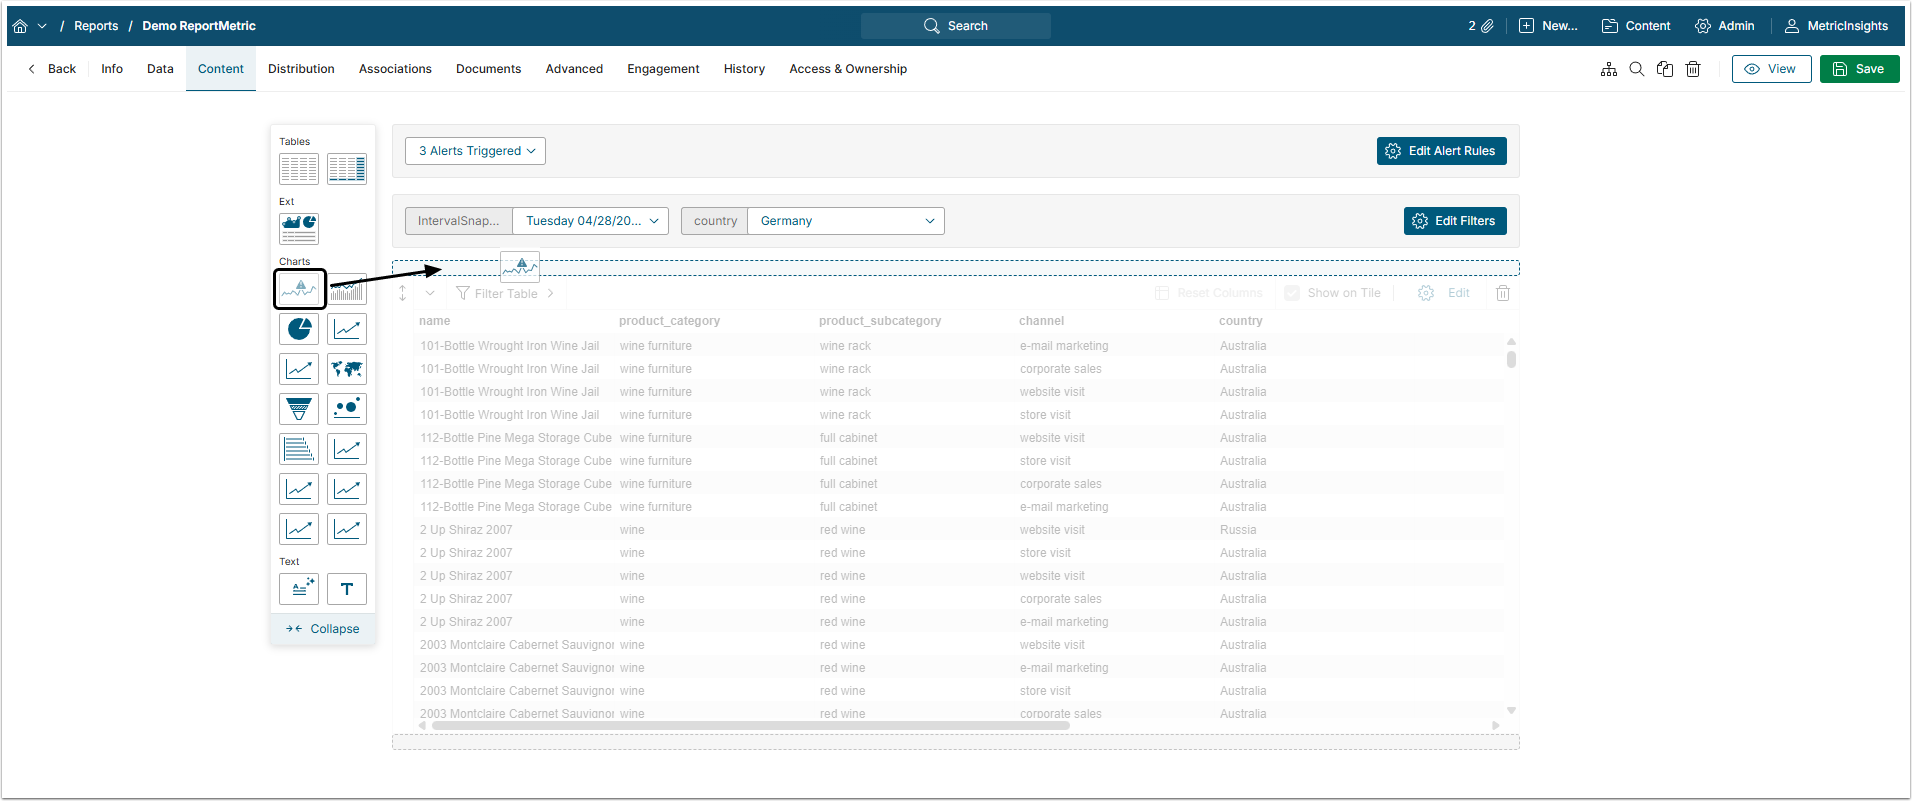
Find the Report Metric component and drag&drop it to the Report main body.
3.1. Configure Report Metric
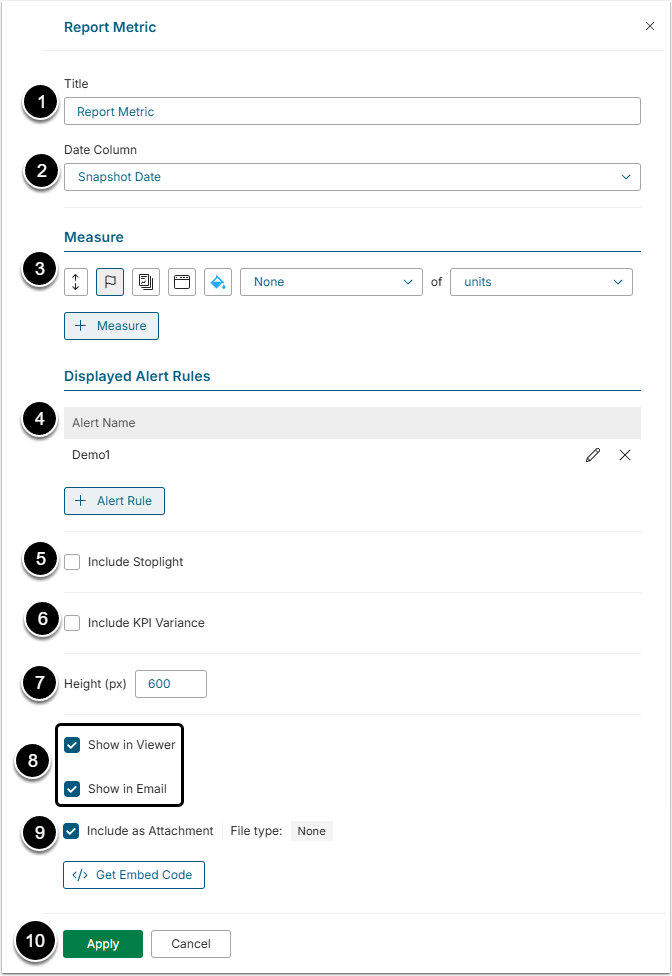
- Title: Give the Report metric a descriptive name.
- Date Column: Select the column that contains date values.
- Measure: Select the type of aggregation and the column whose values will be aggregated from the dropdown menus. Also, choose the color for the measure.
- The order of the measures can be changed by dragging them by the up/down button.
- Displayed Alert Rules: Click [+ Alert Rule] and select the Rule to be displayed on the chart.
- Include Stoplight: Select this checkbox to highlight values that are higher or lower than a set value with background color.
- Include KPI Variance: Select this checkbox to add a Moving Average line to the chart.
- Height: Define the height of the chart in pixels.
- Select where the chart will be shown.
- Include as Attachment: Activate this checkbox to add this chart as an attached file to the report.
- [Apply]
4. Check Alerts
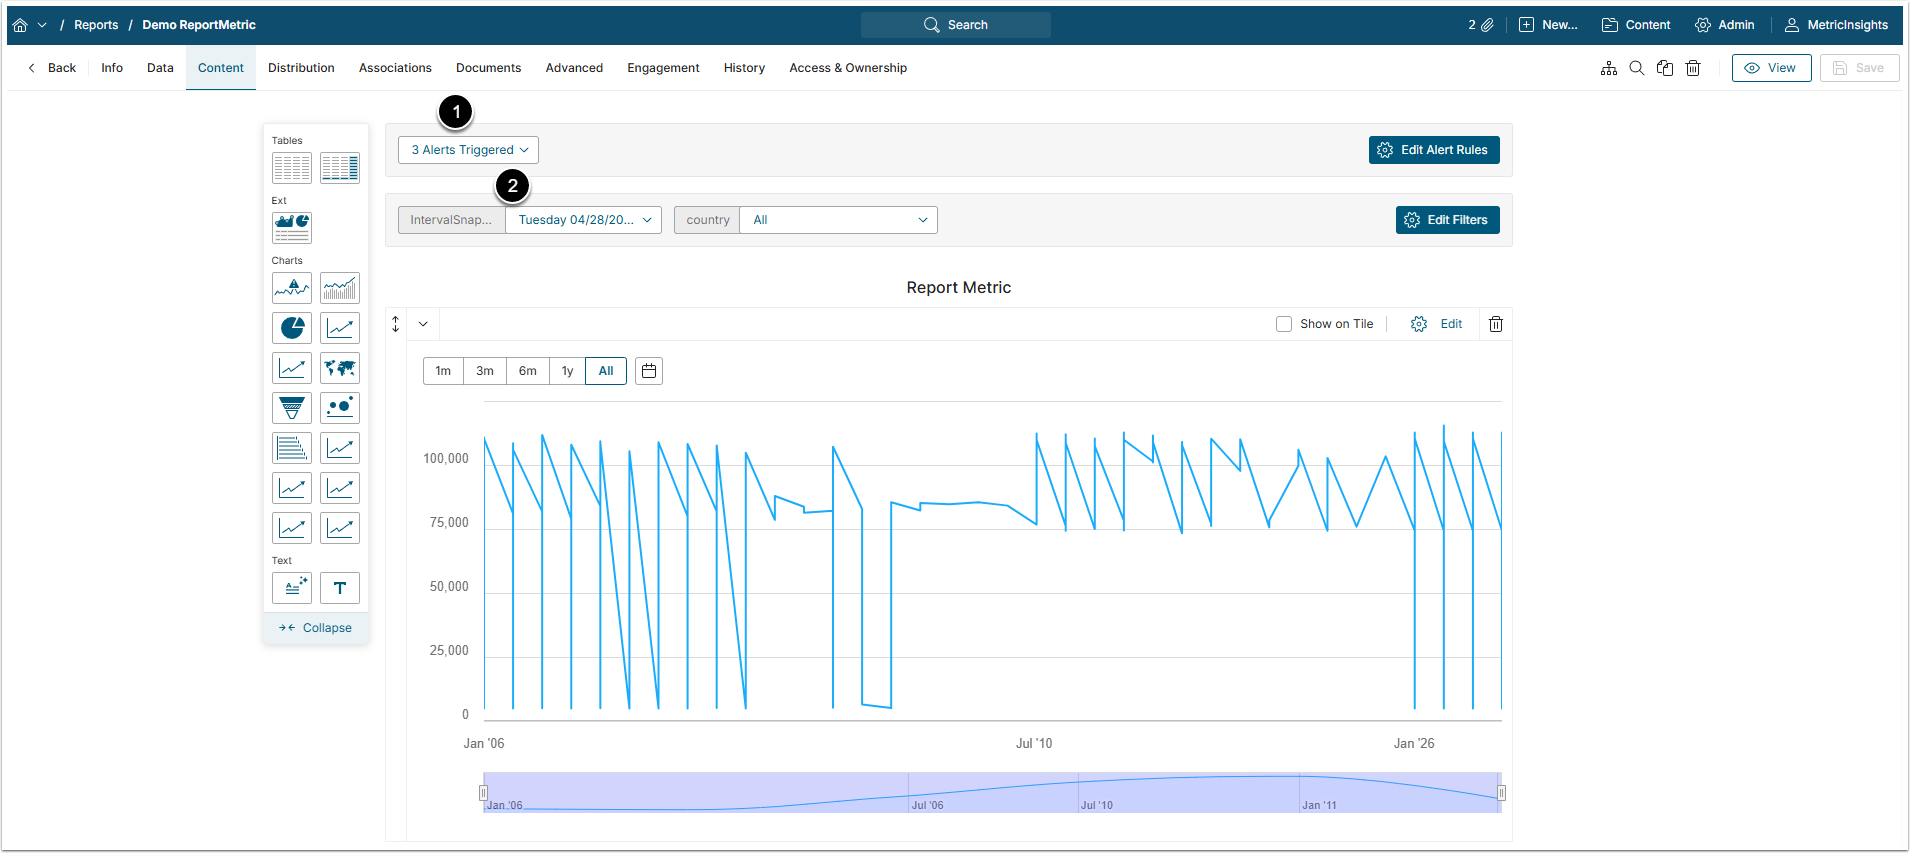
- Alerts Triggered: This drop-down menu contains all triggered Alert Events. Each entry is a set of filters configured to show exactly where the Alert Event occurred. All filter values used to create an entry are listed in its title. The menu is also tied to the selected IntervalSnapshot Date.
- IntervalSnapshot Date: This filter takes priority over the Alerts Triggered filter. The Alerts Triggered filter will display only the entries that match the date selected in this filter.
NOTE: Alert Events are only shown for Snapshot Dataset Reports. If the Report was created from the non-Snapshot Dataset, the Alerts Triggered will be shown, but the Alert icons won't be visible on the chart.
After selecting the entry, the chart will look like that:
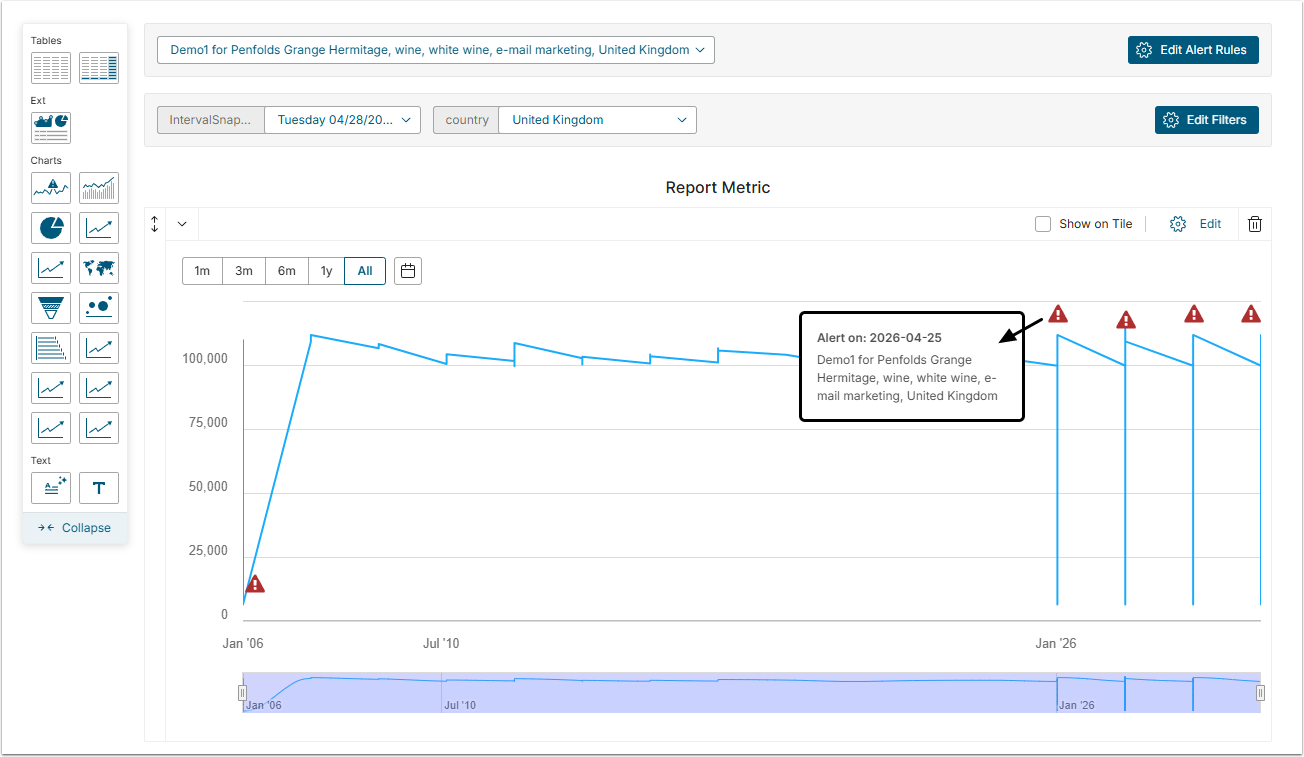
Hovering over the Alert icon will open a tooltip with Alert details.