The Status Monitor screen provides details on how your Metric Insights system is functioning, as explained below.
The section includes the following subsections:
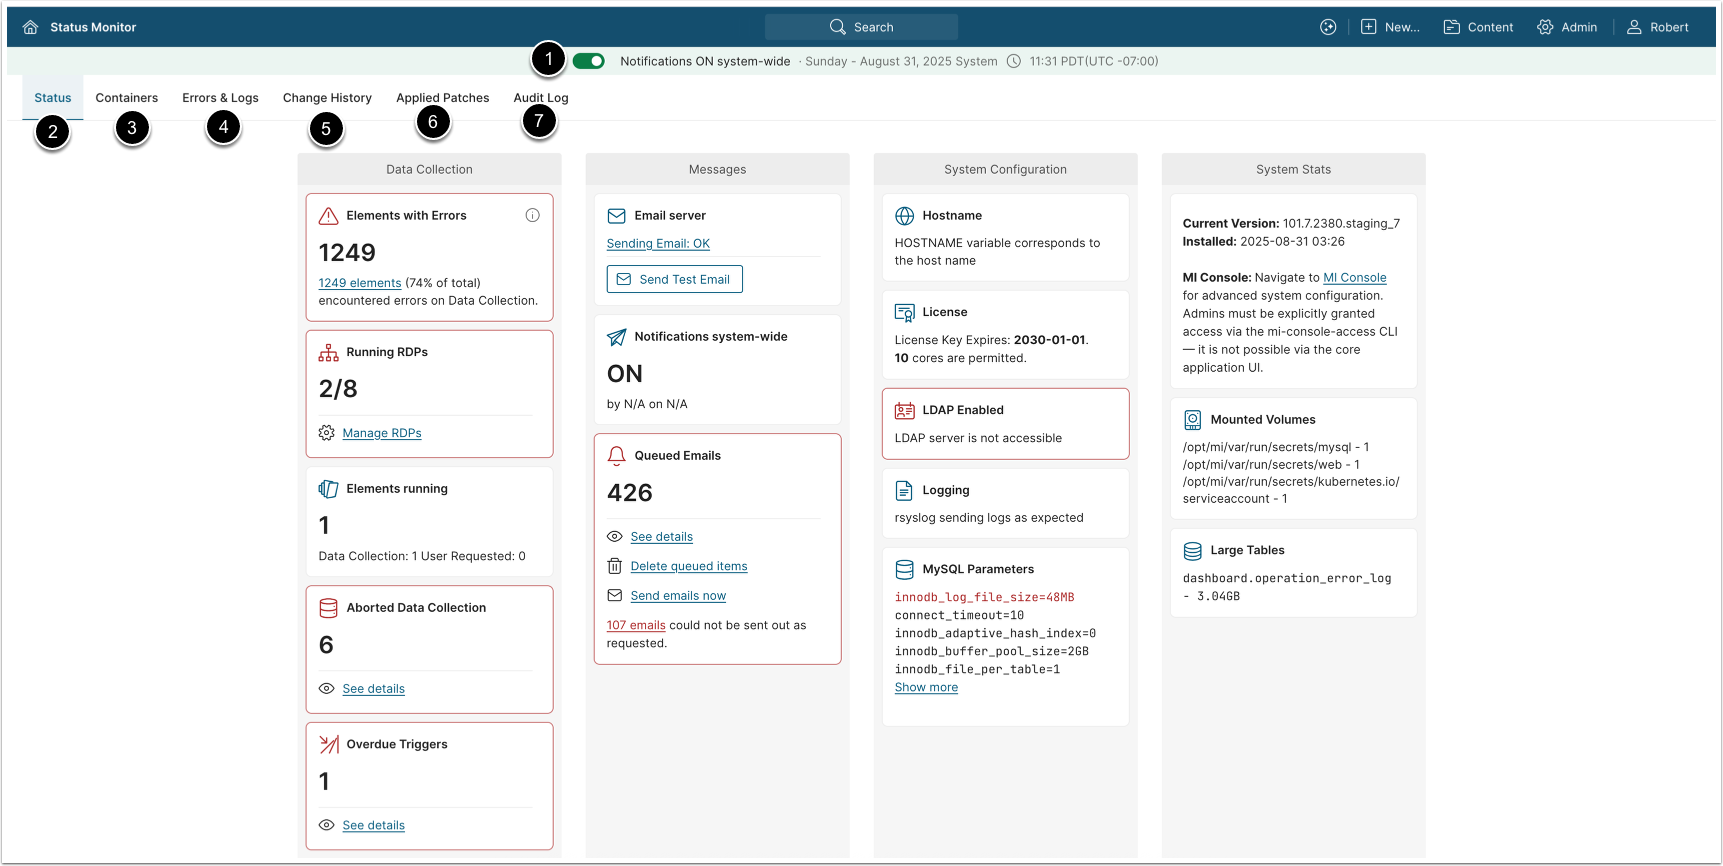
1. Access Status Monitor
Access Admin > Status Monitor
- Notifications OFF/ON system-wide: If this toggle switch is selected, no system notifications (Alerts, Bursts, Favorite Digests; described at My Notifications) are sent.
- Status: Includes four blocks with different data in them: Data Collection, Messages, System Configuration, System Stats.
- Containers: Contains a common data about System Containers and Data Storage Containers.
- Errors & Logs: Includes four tables with the errors and logs reports: Application Errors, Elements With Errors, Datasets with Errors, Mobile Log.
- Bulk Change History: Contains a detailed report on bulk changes, initiated from the Elements list page.
- Applied Patches: Contains a report on applied patches.
- Audit Log: Provides a centralized logging of key changes within Metric Insights.
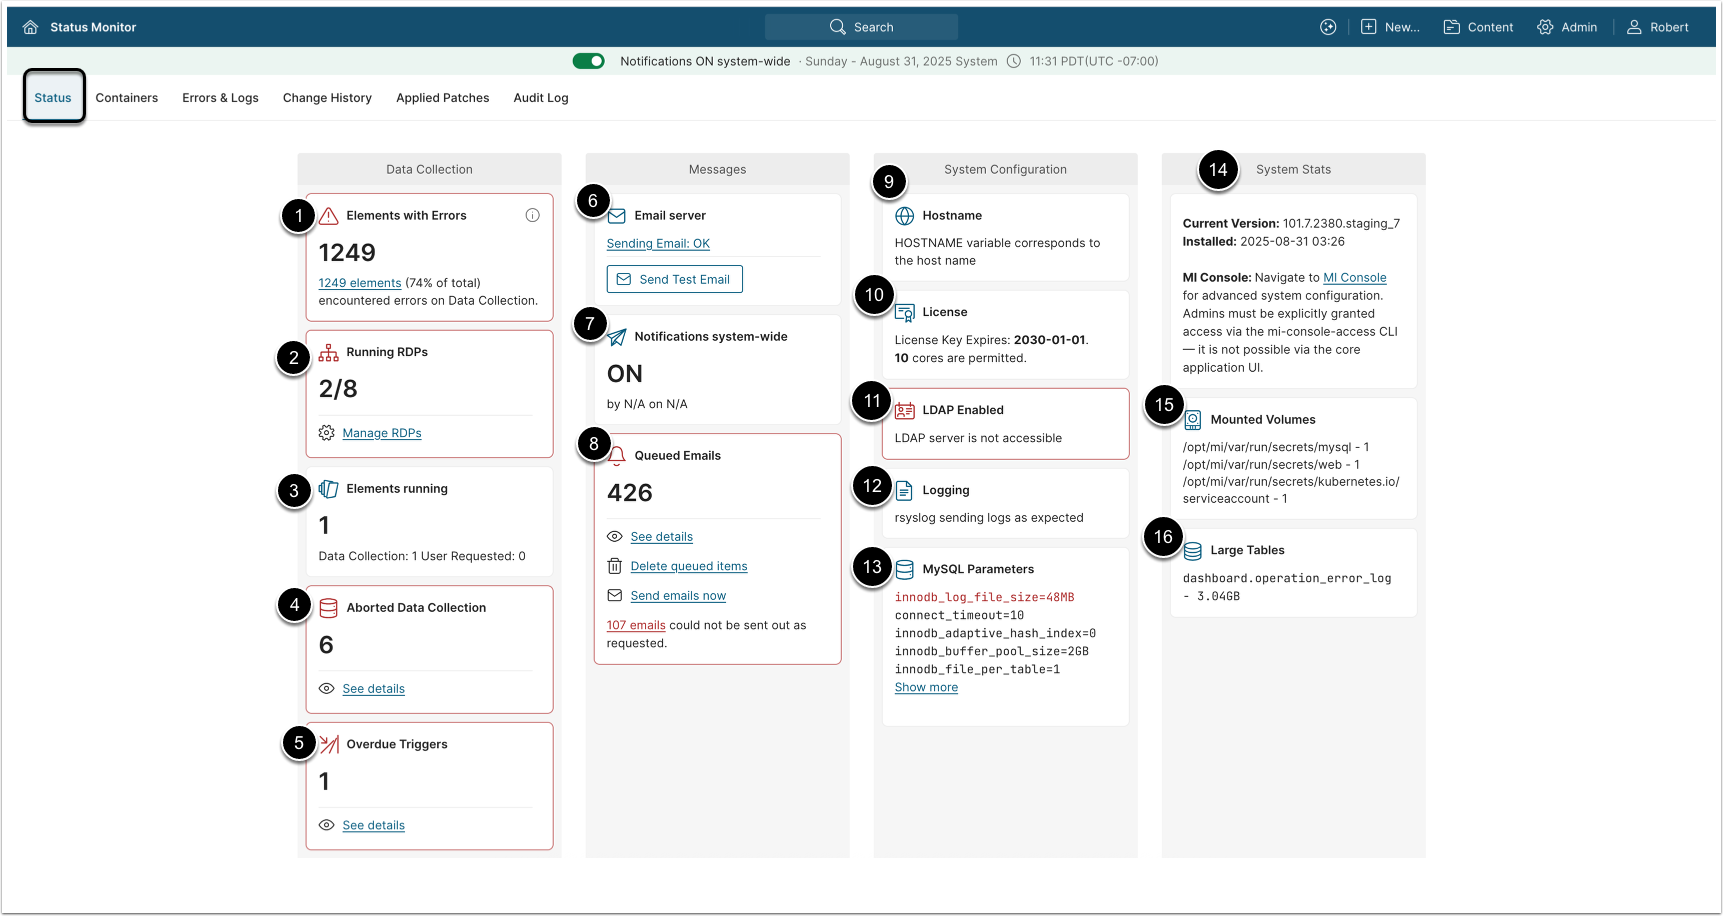
2. Status Tab
NOTE: The sections outlined in red represent certain error conditions that must be fixed.
| Title | Description |
|---|---|
| 1. Elements with Errors | Displays a number of elements with errors detected during data collection. To see Elements with errors, click the link. To fix them, refer to Elements with Error article. |
| 2. Running RDPs | Displays a number of existing and active profiles for Remote Data Processor. To delete an RDP: 1. Click [Manage RDPs]. 2. Click the trash icon next to required RDP. 3. Confirm that you want to delete the RDP, click [Delete] in the modal window. To add a new RDP: 1. Click [Manage RDPs]. 2. Click [New Remote Data Processor]. 3. Fill in Name and RDP Host/IP fields. 4. Click [Save]. |
| 3. Elements running | Displays a number of elements where data is currently collected. |
| 4. Aborted Data Collection | Displays a number of data collection processes that were aborted due to timeout or DB/Server crash. To check which of the Data Collection processes were aborted, click See details. |
| 5. Overdue Triggers | Displays a number of overdue Data Collection Trigger(s). To check which of the Data Collection Triggers are overdue, click See details. |
| 6. Email server | Displays the configuration status for sending out emails. Metric Insights can both send and receive emails. To send a test email, click [Send Test Email]. |
| 7. Notifications system-wide | Displays the information about who and when changed the setting. For more details, refer to My Notifications |
| 8. Queued Emails | Displays a number of queued emails for sending. Email notifications are not sent all at once. They are sent in parts with up to a couple of minutes intervals. |
| 9. Hostname | Displays the notification whether HOSTNAME variable corresponds to the host name. |
| 10. License | Displays when the License Key expires and how many cores are allowed. |
| 11. LDAP Enabled | Displays LDAP Authorization status. To set up LDAP in Metric Insights, refer to: Configuring LDAP Authentication. |
| 12. Logging | Displays the notification whether the logging works correctly. |
| 13. MySQL Parameters | Displays only the key MySQL parameters which indicate the server stability and performance. The parameters are listed in a priority order. The Metric Insights support team may request them. MySQL parameters have their own values rate. If some MySQL value does not correspond to an acceptable rate, it is highlighted in red and located at the section top. To check the acceptable rate for the value, just hold the pointer over required parameter and you will see, e.g.: Minimum value: 2 GB.If some MySQL value does not correspond to a default rate, it is highlighted in yellow and located at the section top if there are no "red" values ( which do not correspond to an acceptable rate) or after them. To check the default rate for the value, hold the pointer over required parameter and you will see; e.g., Default value: 151.To see the whole parameters list, click [Show more]. If MySQL is running on a localhost, you will see the corresponding notification with the link to Checklist for Configuring a Metric Insights Production Environment instruction in the section. |
| 14. Current Version | Displays the version of the Metric Insights application and its installation date. Also displays security build version, if such build is installed. |
| 15. Mounted Volumes | All mounted volumes required for Metric Insights to operate. |
| 16. Large Tables | Displays titles of all large data tables and their size. |
3. Containers Tab
The tab contains information about system and data storage containers.
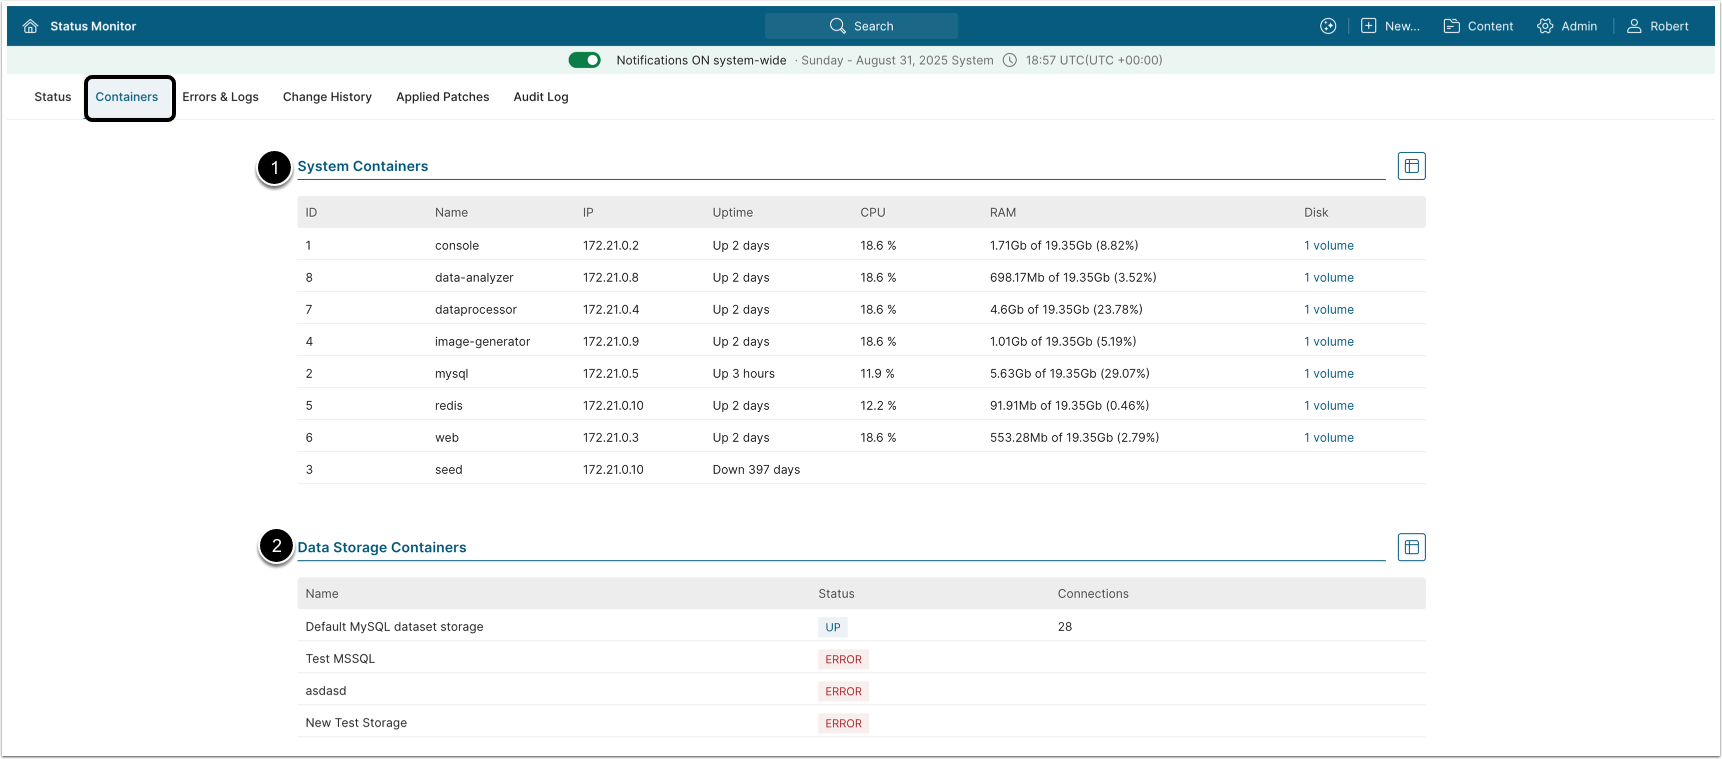
- System Containers table displays the list of MI system data containers and their common data.
- Data Storage Containers table displays the list of Data Storages where Datasets are stored, with information about their titles, status and number of active connections.
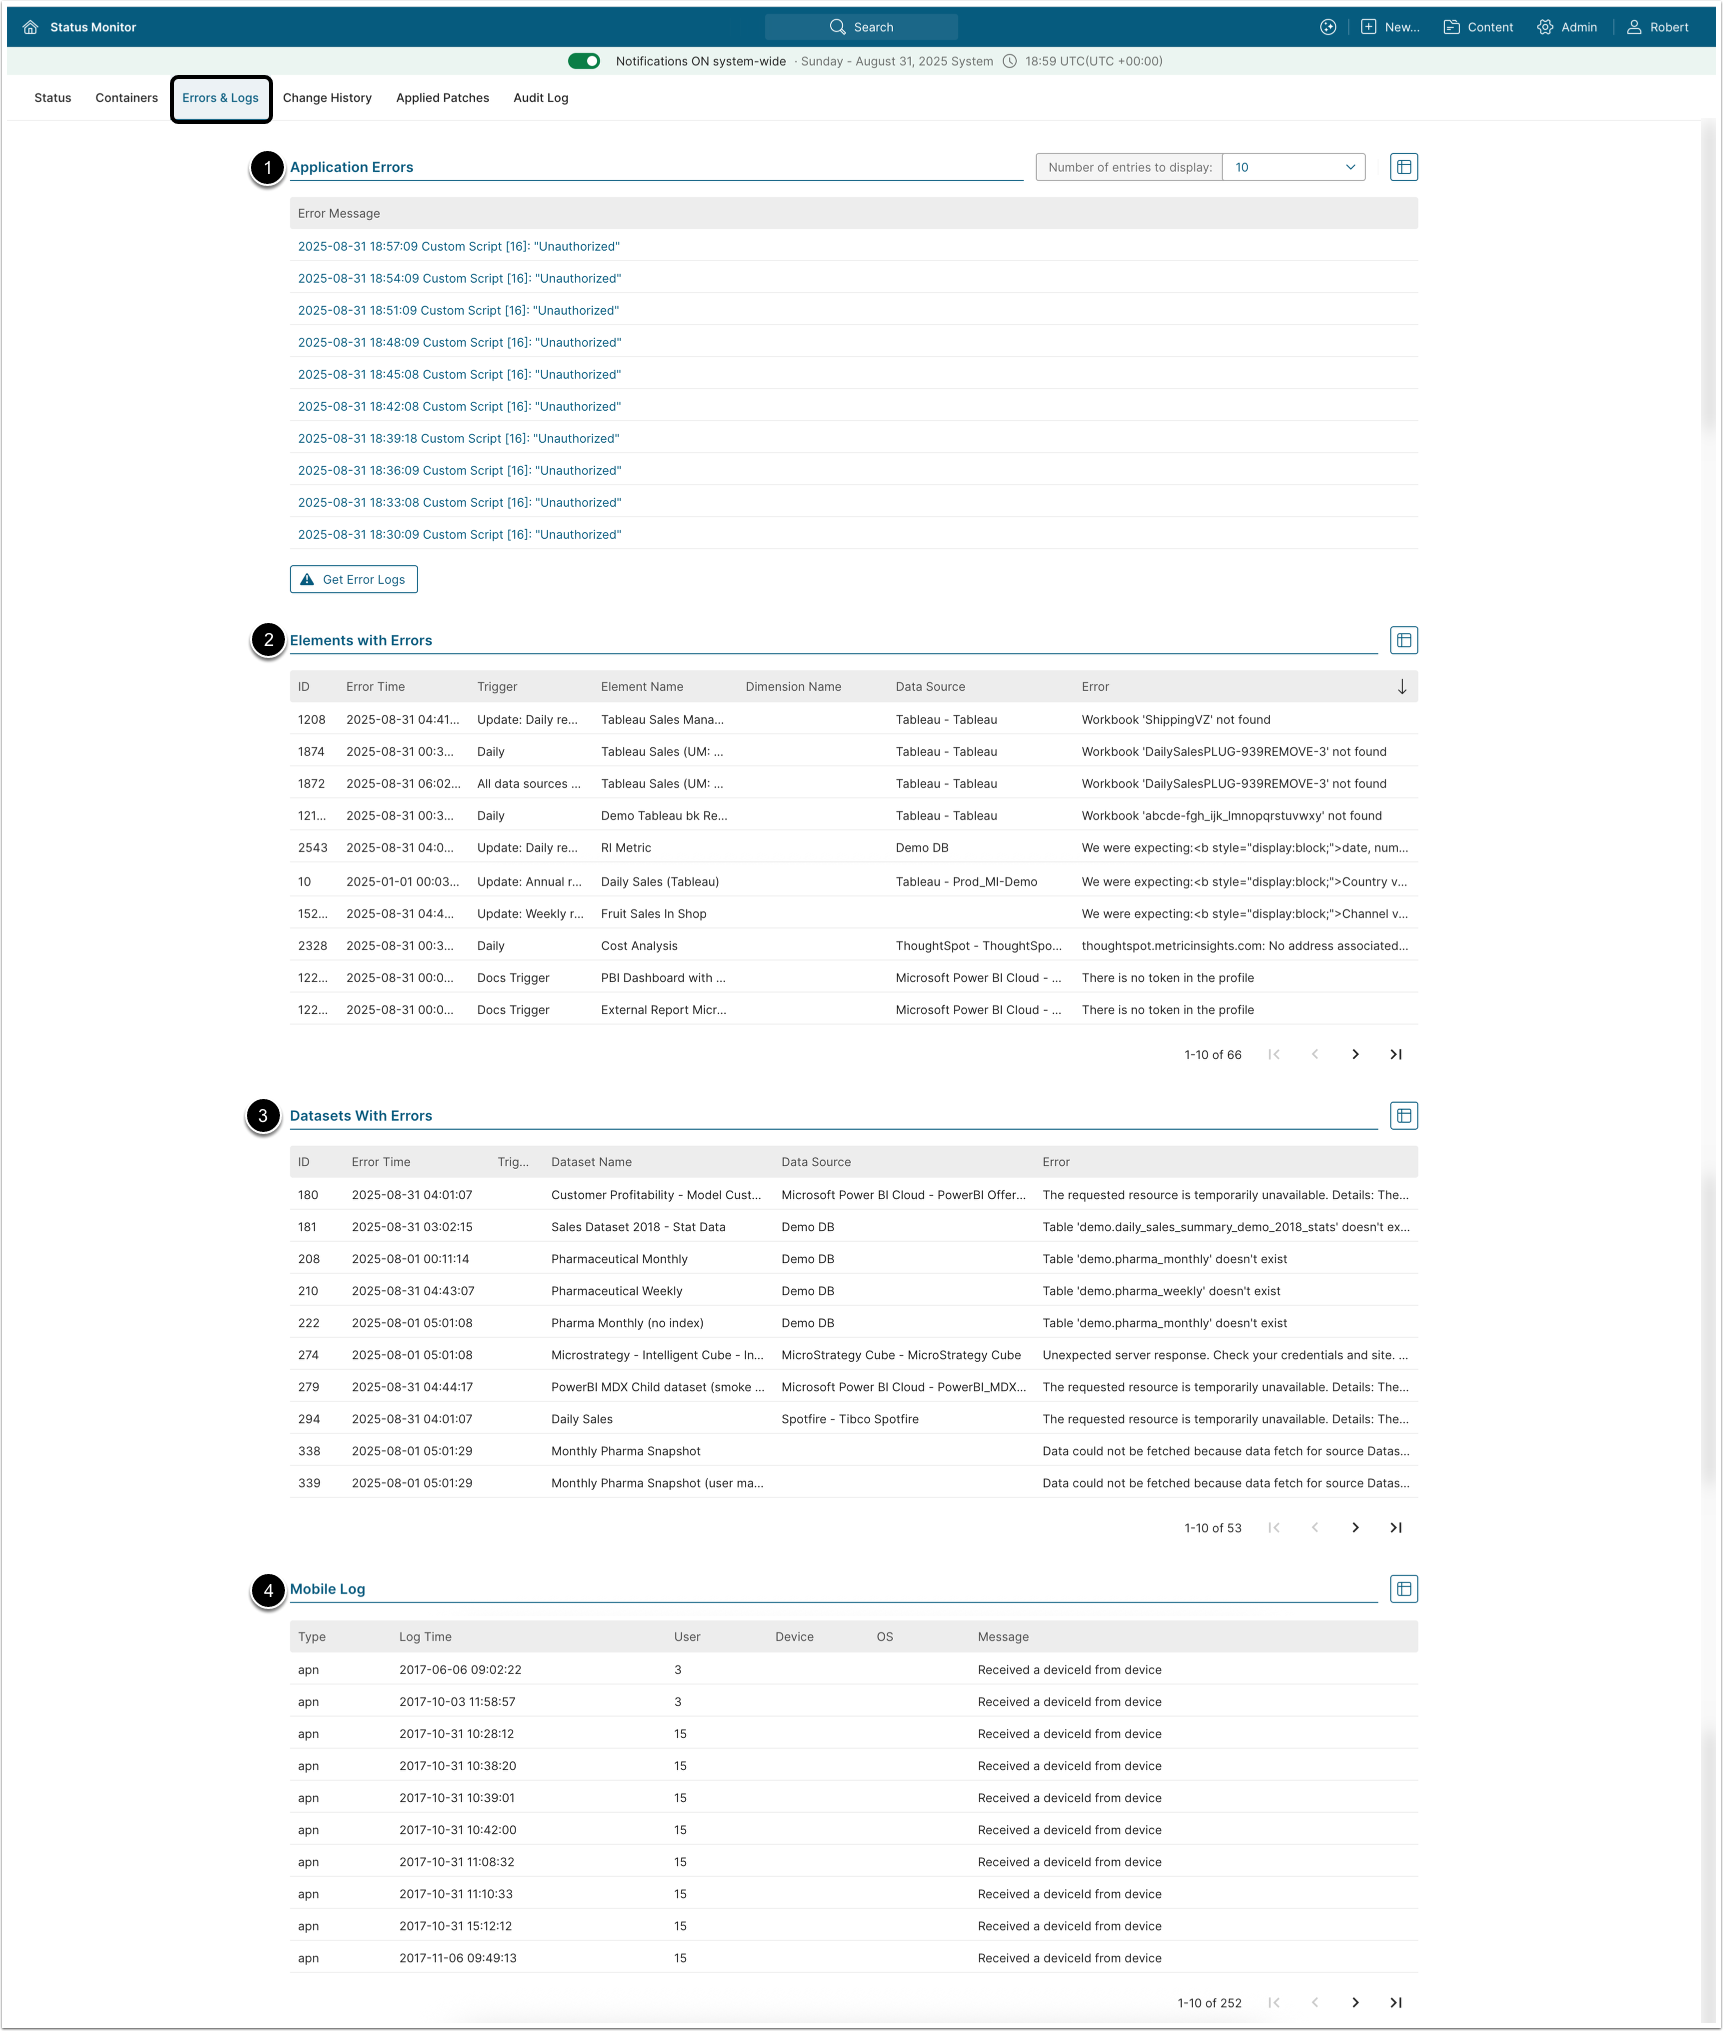
4. Errors & Logs Tab
This tab contains information about Elements with errors. as well as errors log and mobile log.
-
Application Errors table displays informational messages related to the applications. To read the whole notification, click required message.
- [Get Error Logs] to download the logs file or send it to MI support via email.
-
Elements with Errors table lists Elements within which an error occurred. It also shows additional information about the Element and describes an error.
- Check the Elements with Error article for details about fixing the errors.
- Datasets with Errors table lists Datasets within which an error occurred. It also shows additional information about the Dataset and describes an error.
- Mobile log table displays cases of logging into Metric Insights via the mobile device.
5. Change History Tab
The tab contains a detailed report on bulk changes and System Variable change log.
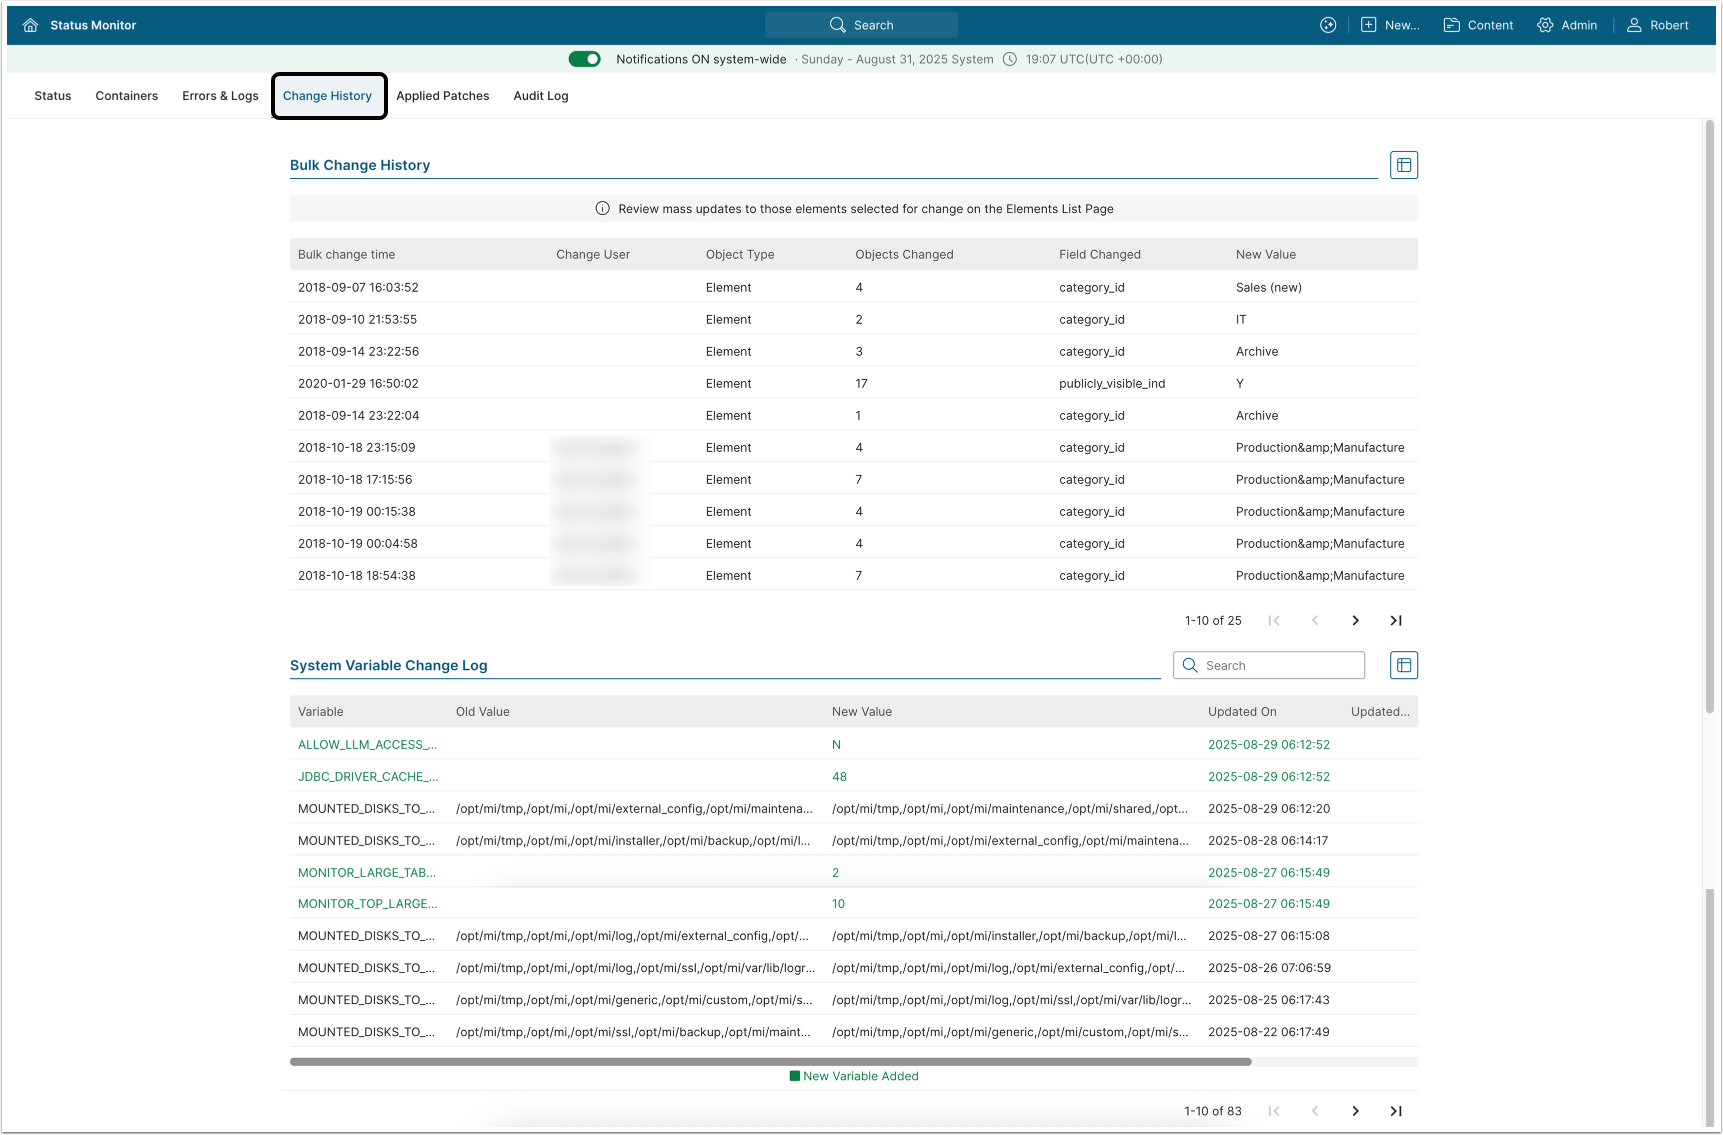
The Bulk Change History table displays when the change was made, by whom, the type of the object and how many of them that were changed, as well as in what field the change was made.
The System Variable Change Log table displays updates to System Variable values and records the addition of new System Variables.
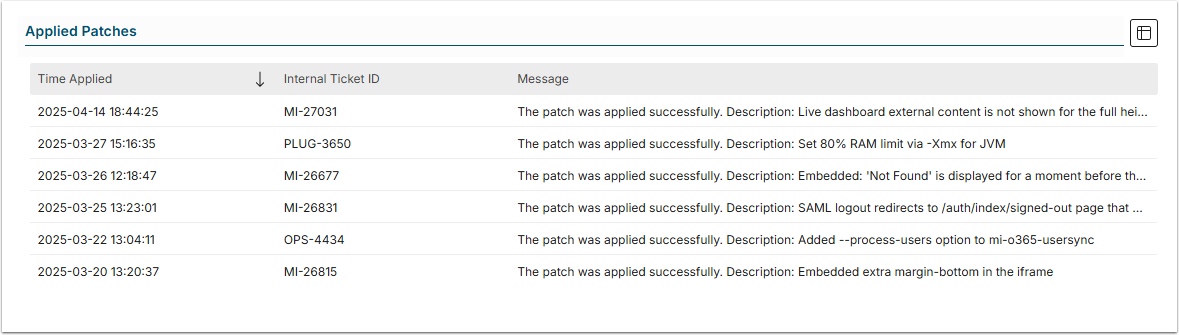
6. Applied Patches Tab
This tab contains information about successful patches application.
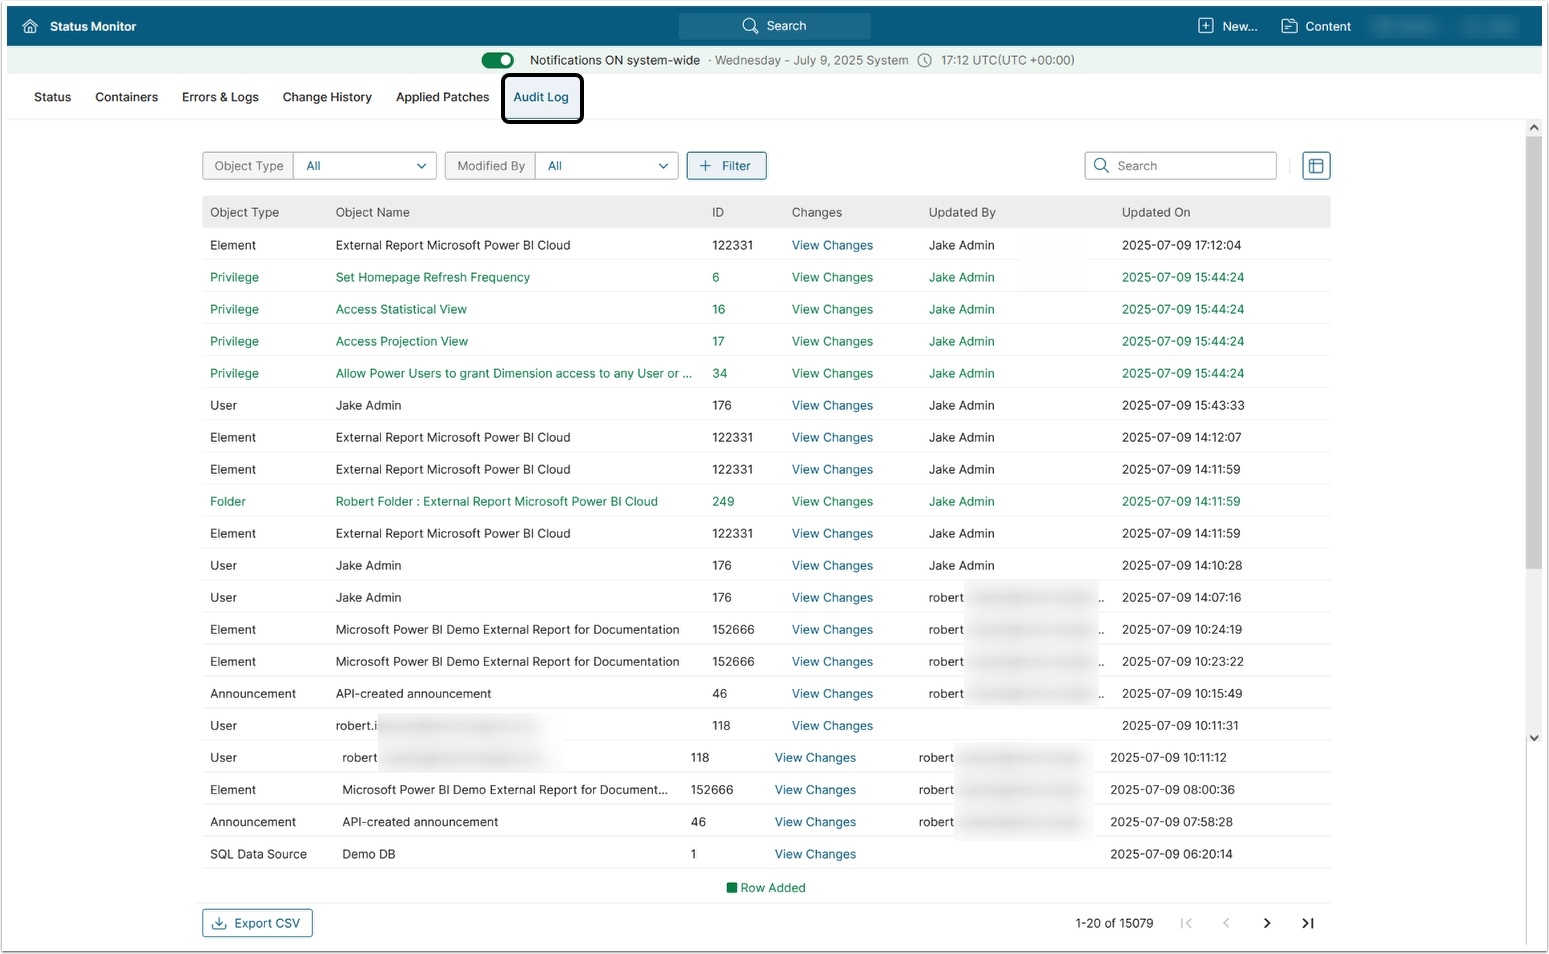
7. Audit Log Tab
This tab provides centralized tracking of key changes across Metric Insights objects, showing who made what changes and when. See Audit Log for details.
The section includes the following subsections:
- Access Status Monitor : describes the Status Monitor UI, version 6
- Status Tab : contains all the elements, located at the tab
- Nodes Tab: explains both tables with data in the tab
- Errors & Logs Tab : includes a description of the sections below
- Import/Export History Tab : describes the content of the tab
- Applied Patches Tab : explains the tables located at the tab
- Customize the Tables Columns : describes how to configure columns in required tables with data
1. Access Status Monitor
Access Admin > Status Monitor
The Status Monitor UI layout is as follows:
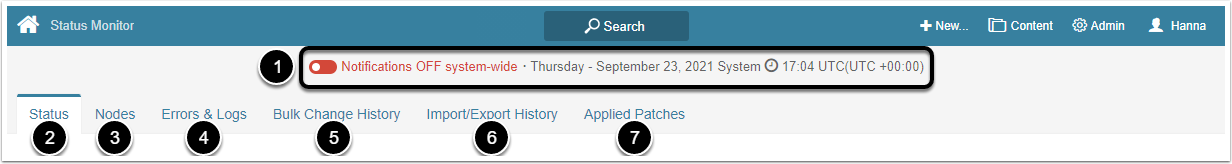
| Number assigned on the screenshot |
Title | Description |
|---|---|---|
| 1 | Notifications OFF/ON system-wide |
If "Notifications OFF system-wide" is selected, no system notifications (Alerts, Bursts, Favorite Digests; described at My Notifications (Overview, Set up, turn on / off) are sent. |
| 2 | Status | Includes four blocks with different data in them: Data Collection, Messages, System Configuration, System Stats. For more detailed information related to the blocks, refer to Status Tab. |
| 3 | Nodes | Contains a common data about System Nodes and Data Storage Nodes. For more detailed information, refer to Nodes Tab. |
| 4 | Errors & Logs | Includes four tables with the errors and logs reports: Application Errors, Elements With Errors, Datasets with Errors, Mobile Log. For more detailed information related to the tables, refer to Errors & Logs Tab. |
| 5 | Bulk Change History |
Contains a detailed report on bulk changes, initiated from the All Elements list. For more detailed information, refer to Bulk Change History Tab. |
| 6 | Import/Export History |
Contains the URL that redirects to Import/Export History screen. For more detailed information, refer to Import/Export History Tab. |
| 7 | Applied Patches | Contains a report on applied patches. For more detailed information, refer to Applied Patches Tab. |
2. Status Tab
The following data is available after clicking Status tab:
The sections outlined in red represent certain error conditions that must be fixed.
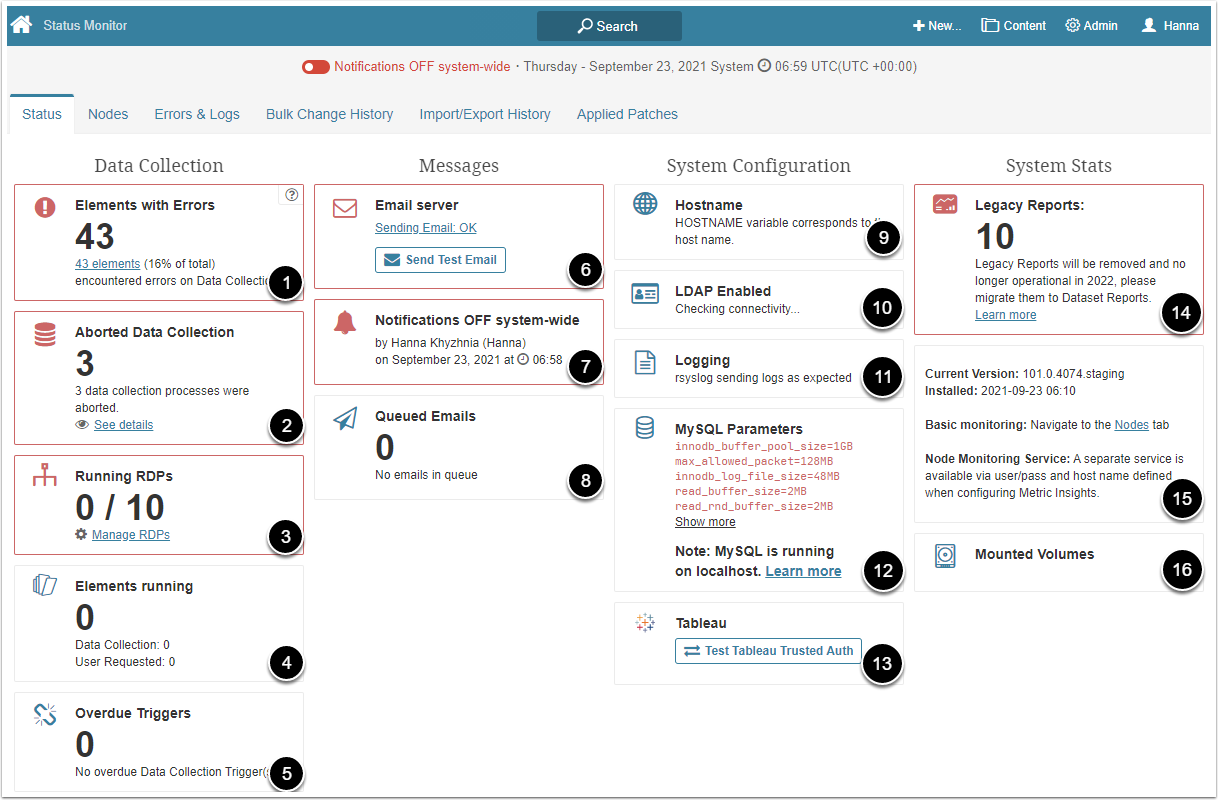
| Number assigned on the screenshot | Title | Description |
|---|---|---|
| 1 | Elements with Errors | Displays a number of elements with errors detected during data collection. To fix them, refer to Elements with Error. |
| 2 | Aborted Data Collection | Displays a number of data collection processes that were aborted due to timeout or DB/Server crash. To check which of the Data Collection processes were aborted, click See details. To increase the data collection timeout: 1. Navigate to Admin > Collection & Storage > Data Collection Triggers. 2. Click required Data Collection Trigger. 3. Click Configuration tab. 4. Customize the fields and options. |
| 3 | Running RDPs | Displays a number of existing and active profiles for Remote Data Processor. To delete an RDP: 1. Click [Manage RDPs]. 2. Click the trash icon next to required RDP. 3. Confirm that you want to delete the RDP, click [OK] in the modal window. To add a new RDP: 1. Click [Manage RDPs]. 2. Click [New Remote Data Processor]. 3. Fill in Name and RDP Host/IP fields. 4. Click [Save]. |
| 4 | Elements running | Displays a number of elements where data is currently collected. |
| 5 | Overdue Triggers | Displays a number of overdue Data Collection Trigger(s). Check out the Data Collection Triggers to see Fix recommendations: Overdue Trigger |
| 6 | Email server | Displays the configuration status for sending out emails. Metric Insights can both send and receive emails. To send a test email, click [Send Test Email]. |
| 7 | Notifications ON/OFF system-wide | Displays the information about who and when changed the setting. For more details, refer to My Notifications (Overview, Set up, Turn on / off). |
| 8 | Queued Emails | Displays a number of queued emails for sending. Email notifications are not sent all at once. They are sent in parts with up to a couple of minutes intervals. |
| 9 | Hostname | Displays the notification whether HOSTNAME variable corresponds to the host name. |
| 10 | LDAP Enabled | Displays LDAP Authorization status. To set up LDAP in Metric Insights, refer to: Configuring LDAP Authentication. |
| 11 | Logging | Displays the notification whether the logging works correctly. |
| 12 | MySQL Parameters | Displays only the key MySQL parameters which indicate the server stability and performance. The parameters are listed in a priority order. The Metric Insights support team may request them. MySQL parameters have their own values rate. If some MySQL value does not correspond to an acceptable rate, it is highlighted in red and located at the section top. To check the acceptable rate for the value, just hold the pointer over required parameter and you will see, e.g.: Minimum value: 2 GB.If some MySQL value does not correspond to a default rate, it is highlighted in yellow and located at the section top if there are no "red" values ( which do not correspond to an acceptable rate) or after them. To check the default rate for the value, hold the pointer over required parameter and you will see; e.g., Default value: 151.To see the whole parameters list, click [Show more]. If MySQL is running on a localhost, you will see the corresponding notification with the link to Checklist for Configuring a Metric Insights Production Environment instruction in the section. |
| 13 | Tableau | Contains the option for checking a Tableau instance setup for Trusted Authentication. To check the configuration: 1. Click [Test Tableau Trusted Auth]. 2. Click [Send]. |
| 14 | Legacy Reports | Displays a number of Legacy Reports. They will be removed in 2022. For more information, click Learn more. |
| 15 |
Current Version: displays the version of the Metric Insights application. Installed: displays a date and time when the current version was installed. Basic monitoring: to access Nodes tab, click Nodes. Node Monitoring Service: an external service for monitoring all nodes that comprise a full Metric Insights environment. This tool is most useful when dealing with an orchestrated deployment that has a multiple of the web node. |
|
| 16 | Mounted Volumes | All mounted volumes required for Metric Insights to operate. |
3. Nodes Tab
The tab contains the data described below:
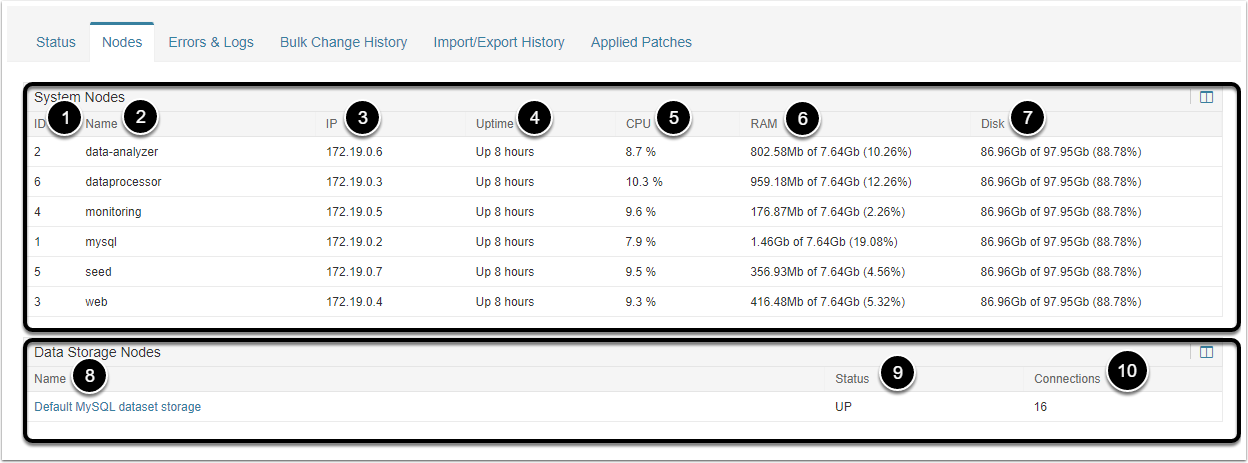
System Nodes table displays the nodes list and their common data:
| Number assigned on the screenshot | Title | Description |
|---|---|---|
| 1 |
ID | Displays a node ID. |
| 2 | Name | Displays a node name. |
| 3 | IP | Displays a node IP address. |
| 4 | Uptime | Displays a node uptime. |
| 5 | CPU | Displays a node CPU. |
| 6 | RAM | Displays a node RAM. |
| 7 | Disk | Displays a node Disk. |
Data Storage Nodes table displays the databases list where Datasets are stored:
| Number assigned on the screenshot | Title | Description |
|---|---|---|
| 8 | Name | Displays a database name. |
| 9 | Status | Displays a database status. There are 2 statuses types: UP and ERROR. |
| 10 | Connections | Displays the number of active connections to a database. |
4. Errors & Logs Tab
The tab contains the following sections:
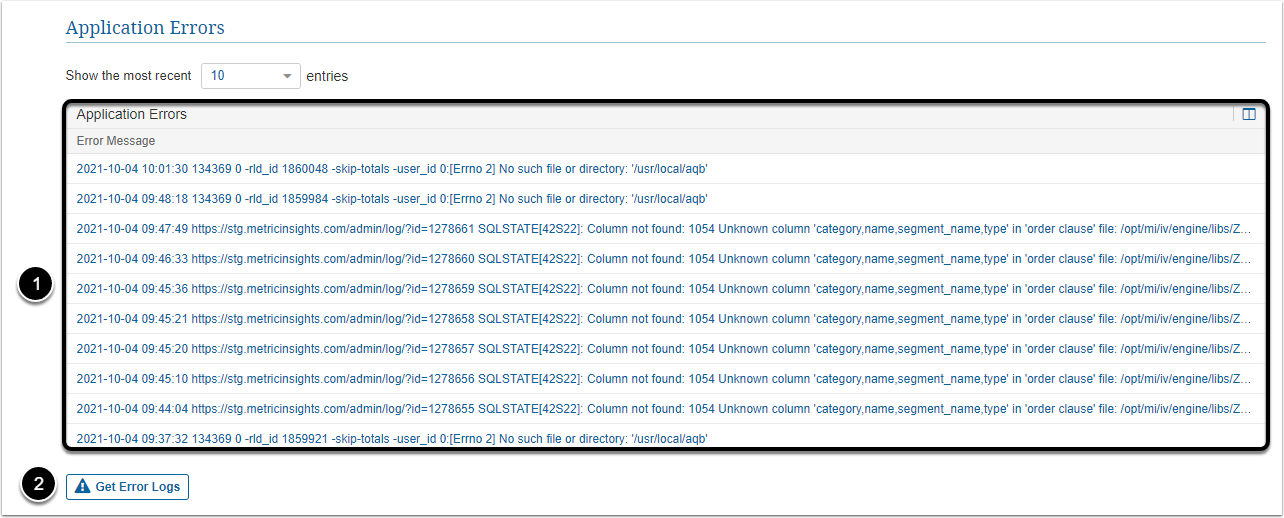
| Number assigned on the screenshot | Title | Description |
|---|---|---|
| 1 | Application Errors | The column contains informational messages related to the application. To read the whole notification, click required message. |
| 2 | Get Error Logs | The button allows to enable/disable 2 options:
|
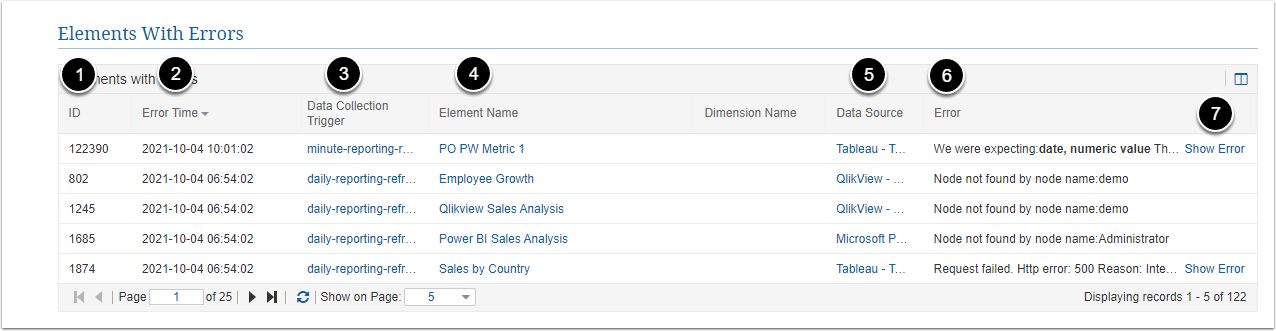
| Number assigned on the screenshot | Title | Description |
|---|---|---|
| 1 |
ID | Displays an Element ID. |
| 2 | Error Time | Displays a date and time when an error occured. |
| 3 | Data Collection Trigger | Displays a Data Collection Trigger name. For more detailed information related to Data Collection Triggers, refer to What are Data Collection Triggers?. |
| 4 | Element Name | Displays an Element name with an error. |
| 5 | Dimension Name | Displays a Dimension Name. For more detailed information related to Dimensions, refer to Understanding Dimensions. |
| 6 | Data Source | Displays a Data Source name. For more detailed information related to Data Sources, refer to Understanding Data Sources. |
| 7 | Error | Displays an error text. |
| 8 | Show Error | To check a whole text of an error, click Show Error. |
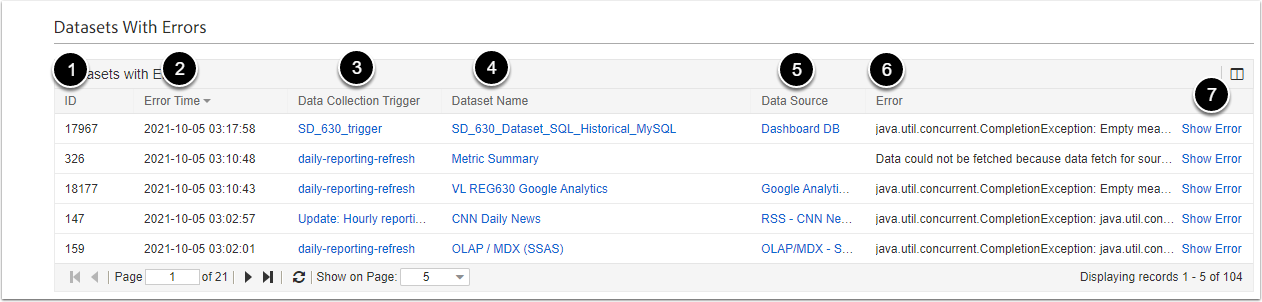
| Number assigned on the screenshot | Title | Description |
|---|---|---|
| 1 |
ID | Displays a Dataset ID. |
| 2 | Error Time | Displays a date and time when an error occurred. |
| 3 | Data Collection Trigger | Displays a Data Collection Trigger name. For more detailed information related to Data Collection Triggers, refer to What are Data Collection Triggers?. |
| 4 | Dataset Name | Displays an Dataset name with an error. |
| 5 | Data Source | Displays a Data Source name. For more detailed information related to Data Sources, refer to Understanding Data Sources. |
| 6 | Error | Displays an error text. |
| 7 | Show Error | To check a whole text of an error, click Show Error. |
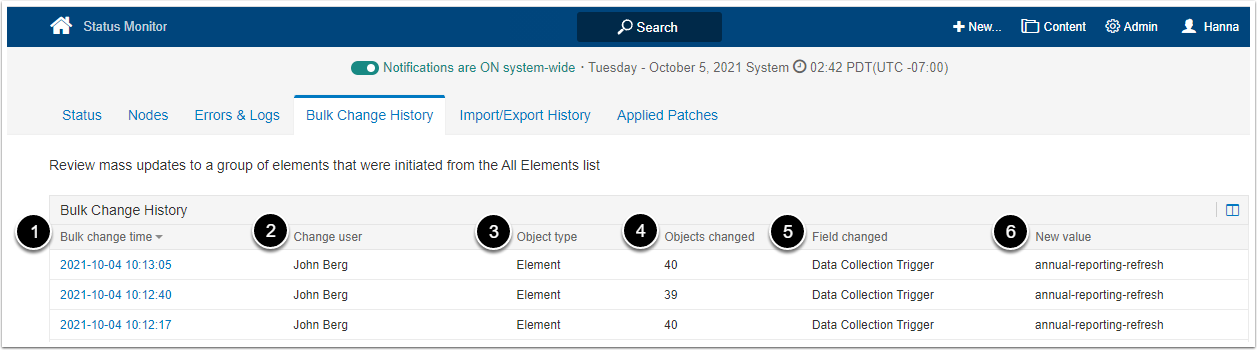
5. Bulk Change History Tab
The tab contains a detailed report on bulk changes, initiated from the All Elements list page:
| Number assigned on the screenshot | Title | Description |
|---|---|---|
| 1 |
Bulk change time | Displays a date and time when a bulk change was applied. |
| 2 | Change user | Displays a user who made a bulk change. |
| 3 | Object type | Displays an object type with applied bulk change. |
| 4 | Objects changed | Displays the number of objects with applied bulk change. |
| 5 | Field changed | Displays a field name that was changed. |
| 6 | New value | Displays a new value that was applied. |
6. Import/Export History Tab
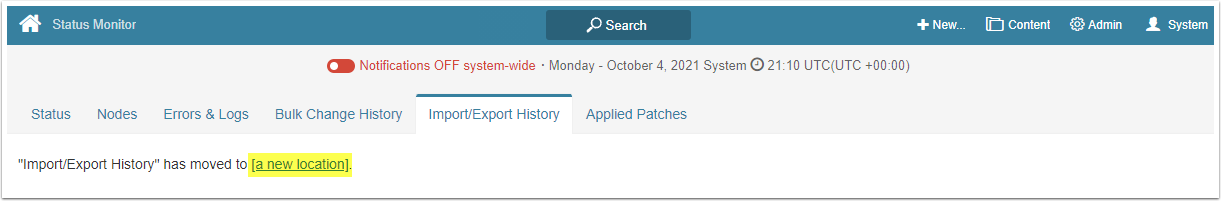
The tab contains a new location URL that redirects to Import/Export History screen.
7. Applied Patches Tab
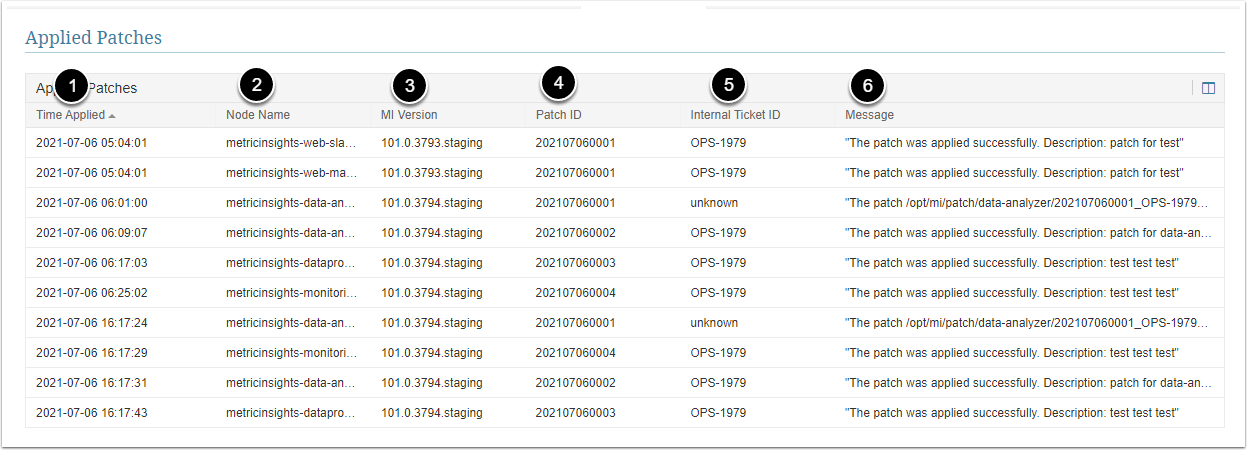
| Number assigned on the screenshot | Title | Description |
|---|---|---|
| 1 |
Time Applied | Displays a date and time when a patch was applied. |
| 2 | Node Name | Displays a node name a patch was applied for. |
| 3 | MI Version | Displays a version of the Metric Insights application. |
| 4 | Patch ID | Displays a patch ID. |
| 5 | Internal Ticket ID | Displays a ticket ID by which a patch was created. |
| 6 | Message | Displays the information about a patch status. |
8. Customize the Tables Columns
It is possible to select only those columns that you want to see in the tables.
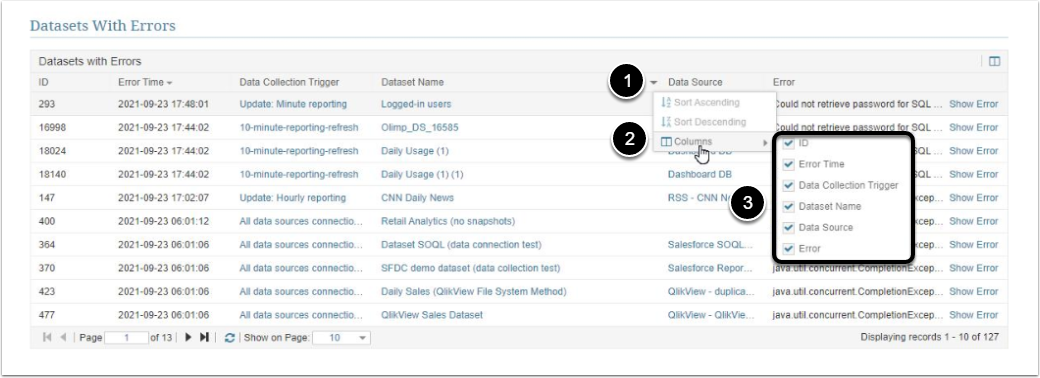
- Hover over any column name and click the down arrow icon
- Hover over Column
- Select required columns