Beginning in v7.2.0, OpenTelemetry can be enabled for the following Metric Insights application services:
- Web;
- Console;
- Data Analyzer;
- Data Processor.
OpenTelemetry data can be forwarded to a wide range of observability platforms, including Azure Monitor, AWS observability services, Grafana, and Splunk, as well as other OpenTelemetry-compatible back-ends.
OpenTelemetry is enabled through dedicated container images. To begin collecting telemetry, request OpenTelemetry-enabled images for the core services you want to instrument from the Metric Insights Support, and configure the required OpenTelemetry environment variables.
NOTE: Beginning in v7.2.1, OpenTelemetry is enabled by default for Web, Console, Data Analyzer, and Data Processor services.
This article provides an example OpenTelemetry configuration for Azure Monitor.
TABLE OF CONTENTS:
NOTE: For an example of configuring the Metric Insights web service to export OpenTelemetry data, see Configure OpenTelemetry Export to Splunk Observability Cloud (v7.1.1+).
1. Request OpenTelemetry-Enabled Images from Metric Insights Support
This functionality is provided by request and includes modified Metric Insights service images of choice. Contact support@metricinsights.com to request the selected modified service images.
2. Configure Component .env Files
Configure .env files of the components for which you want to enable OpenTelemetry. Below are examples for each Metric Insights application service that supports OpenTelemetry:
Web:
OTEL_PHP_AUTOLOAD_ENABLED=true
OTEL_SERVICE_NAME=mi
OTEL_EXPORTER_OTLP_TRACES_ENDPOINT=http://172.17.0.1:4318/v1/traces OTEL_RESOURCE_ATTRIBUTES="deployment.environment=dev,service.name=mi-web"
OTEL_LOGS_EXPORTER=noneConsole:
OTEL_PYTHON_ENABLED=true
OTEL_SERVICE_NAME=mi-console OTEL_RESOURCE_ATTRIBUTES="deployment.environment=dev,service.name=mi-console"  OTEL_EXPORTER_OTLP_TRACES_ENDPOINT=http://172.17.0.1:4317/v1/traces OTEL_LOGS_EXPORTER=none OTEL_METRICS_EXPORTER=none
Data Analyzer:
OTEL_PYTHON_ENABLED=true
OTEL_SERVICE_NAME=mi-da
OTEL_RESOURCE_ATTRIBUTES="deployment.environment=dev,service.name=mi-da"  OTEL_EXPORTER_OTLP_TRACES_ENDPOINT=http://172.17.0.1:4317/v1/traces
OTEL_METRICS_EXPORTER=none
OTEL_LOGS_EXPORTER=none
Data Processor:
OTEL_JAVAAGENT_ENABLED=true
OTEL_SERVICE_NAME=mi-dp
OTEL_EXPORTER_OTLP_TRACES_ENDPOINT=http://172.17.0.1:4318/v1/traces
OTEL_LOGS_EXPORTER=none
OTEL_METRICS_EXPORTER=none OTEL_RESOURCE_ATTRIBUTES="deployment.environment=dev,service.name=mi-dp"  OTEL_JAVAAGENT_DEBUG=false
3. Obtain Application Insights Connection String Value in Azure
Access Azure Portal > Application Insights
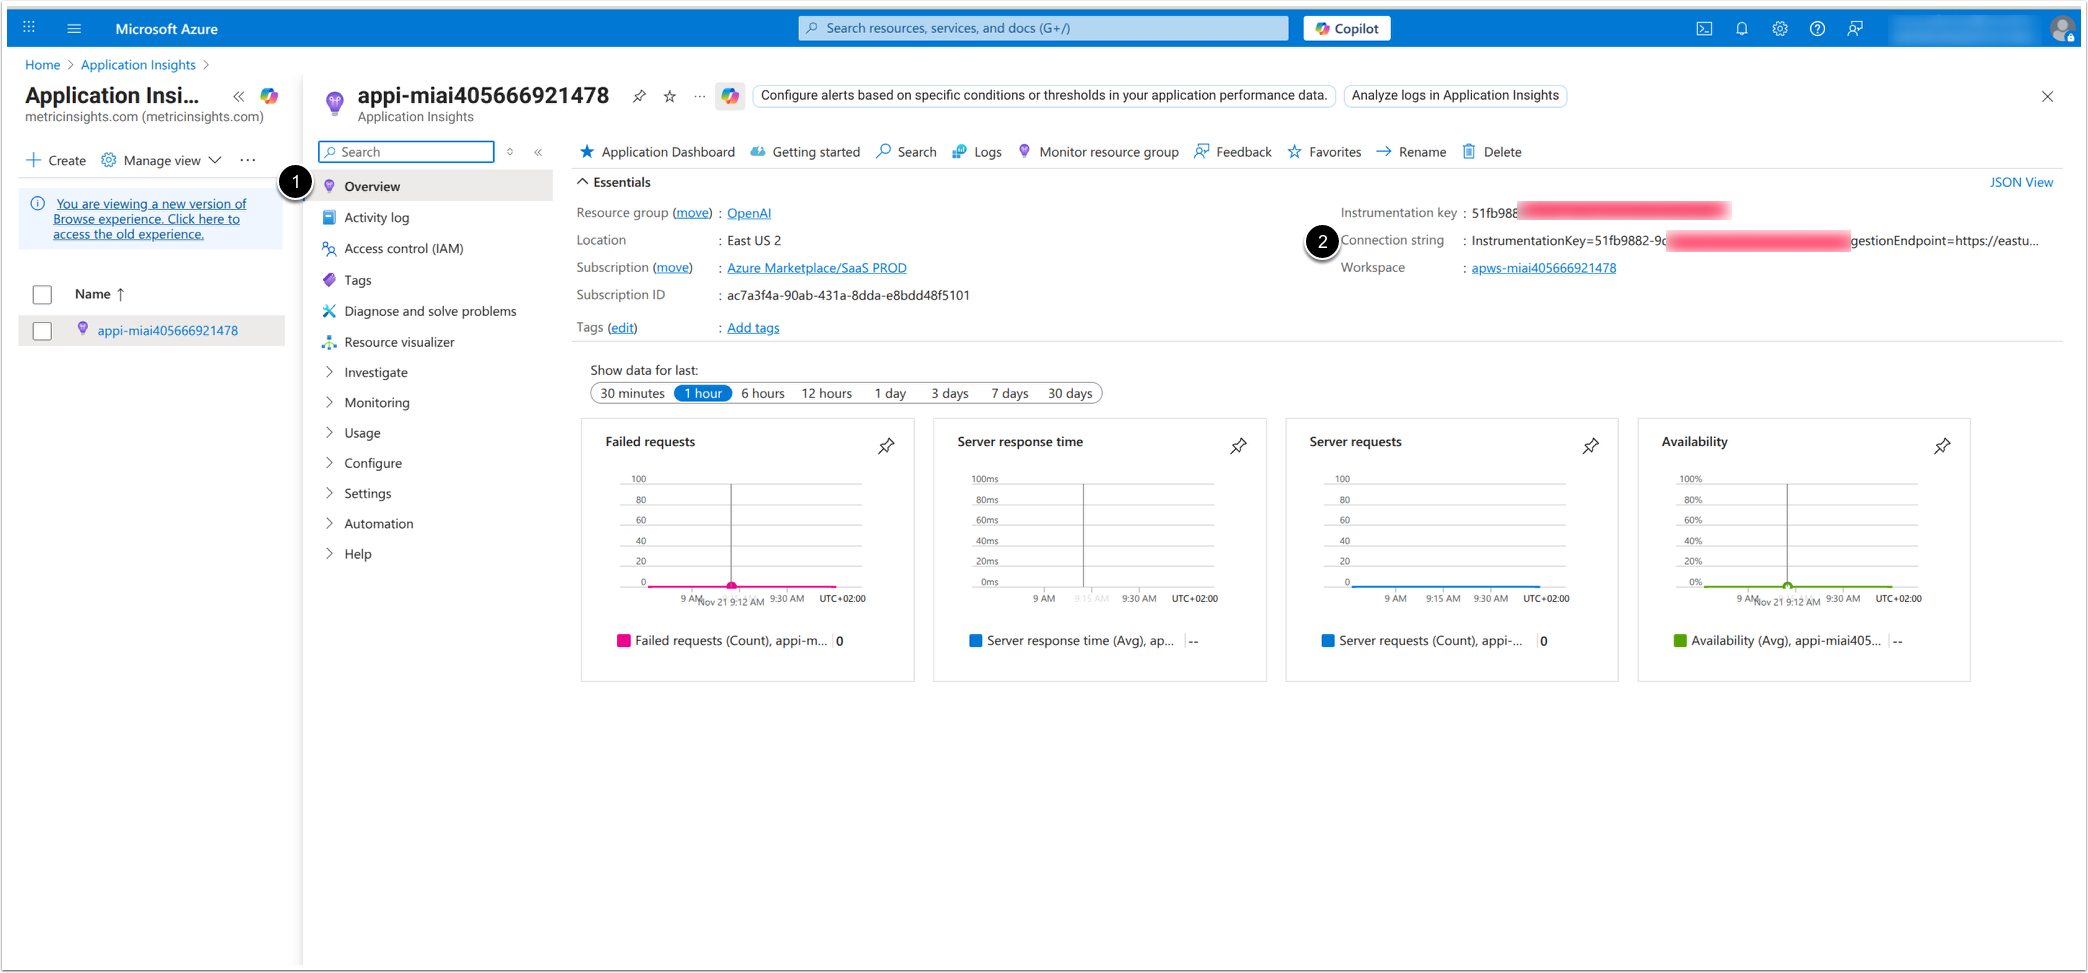
- Access Overview.
- Copy and save the Connection string value.
4. Create Collector Config File otel.yaml
receivers:
  otlp:
    protocols:
      grpc:
        endpoint: "0.0.0.0:4317"
      http:
        endpoint: "0.0.0.0:4318"
exporters:
  azuremonitor:
    connection_string: "InstrumentationKey=51fb9882-****;IngestionEndpoint=https://eastus2-3.in.applicationinsights.azure.com/;LiveEndpoint=https://eastus2.livediagnostics.monitor.azure.com/;ApplicationId=294a84ff-****"
service:
  pipelines:
    traces:
      receivers: [otlp]
      exporters: [azuremonitor]
Assign connection_string the value of Application Insights Connection String.
5. Create Composer File for Collector
version: "3.8"
services:
  otel-collector:
    container_name: otel-collector
    image: otel/opentelemetry-collector-contrib:latest
    restart: always
    ports:
      - "4317:4317"
      - "4318:4318"
    volumes:
      - ./otel.yaml:/etc/otel/config.yaml
    command: ["--config=/etc/otel/config.yaml"]
The composer file must reference the previously created otel.yaml file.
6. Run and Verify the Collector
- Run the collector:
docker-composer up -d- Verify the collector is running:
docker ps7. Verify Traces in Azure Monitor
Access Application map tab

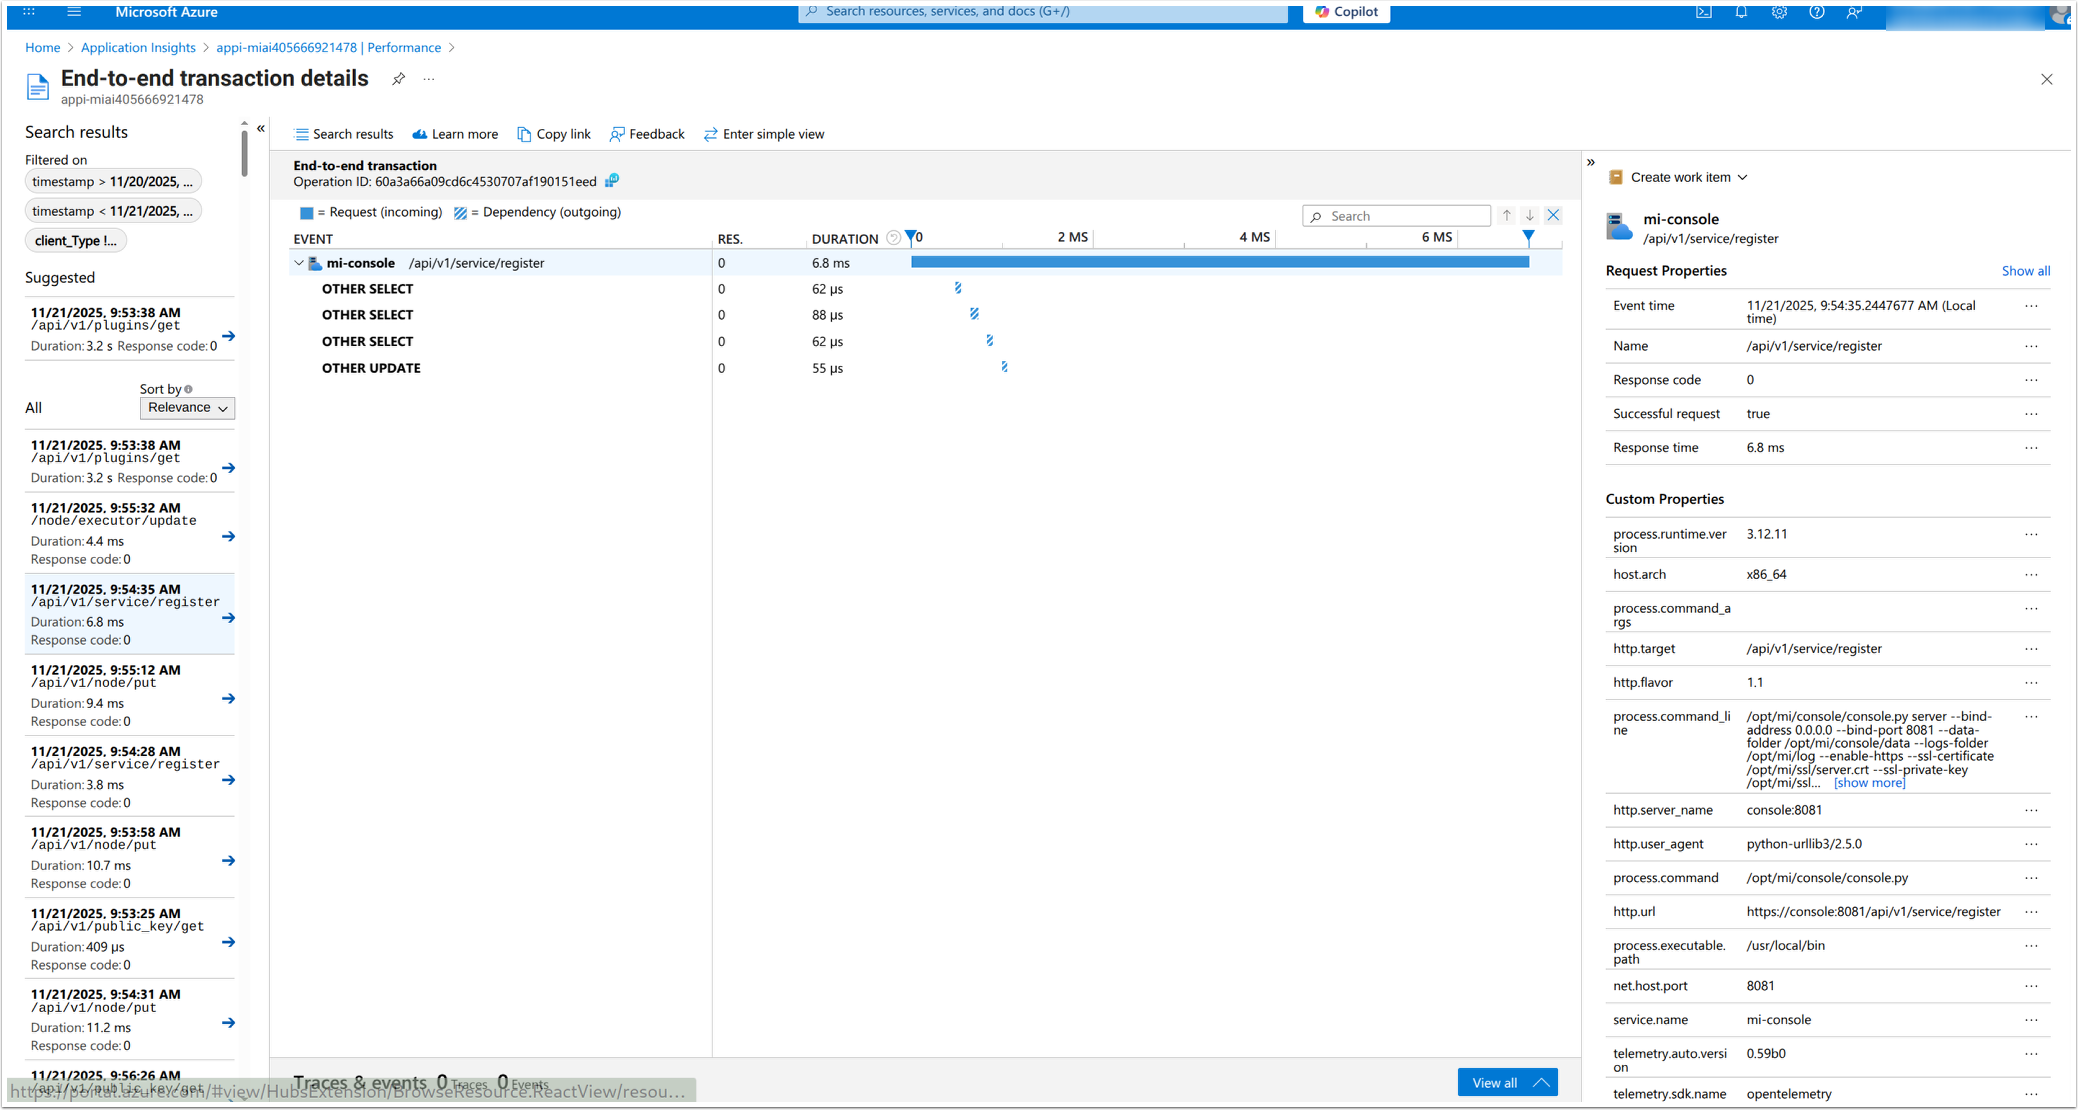
Access Performance tab
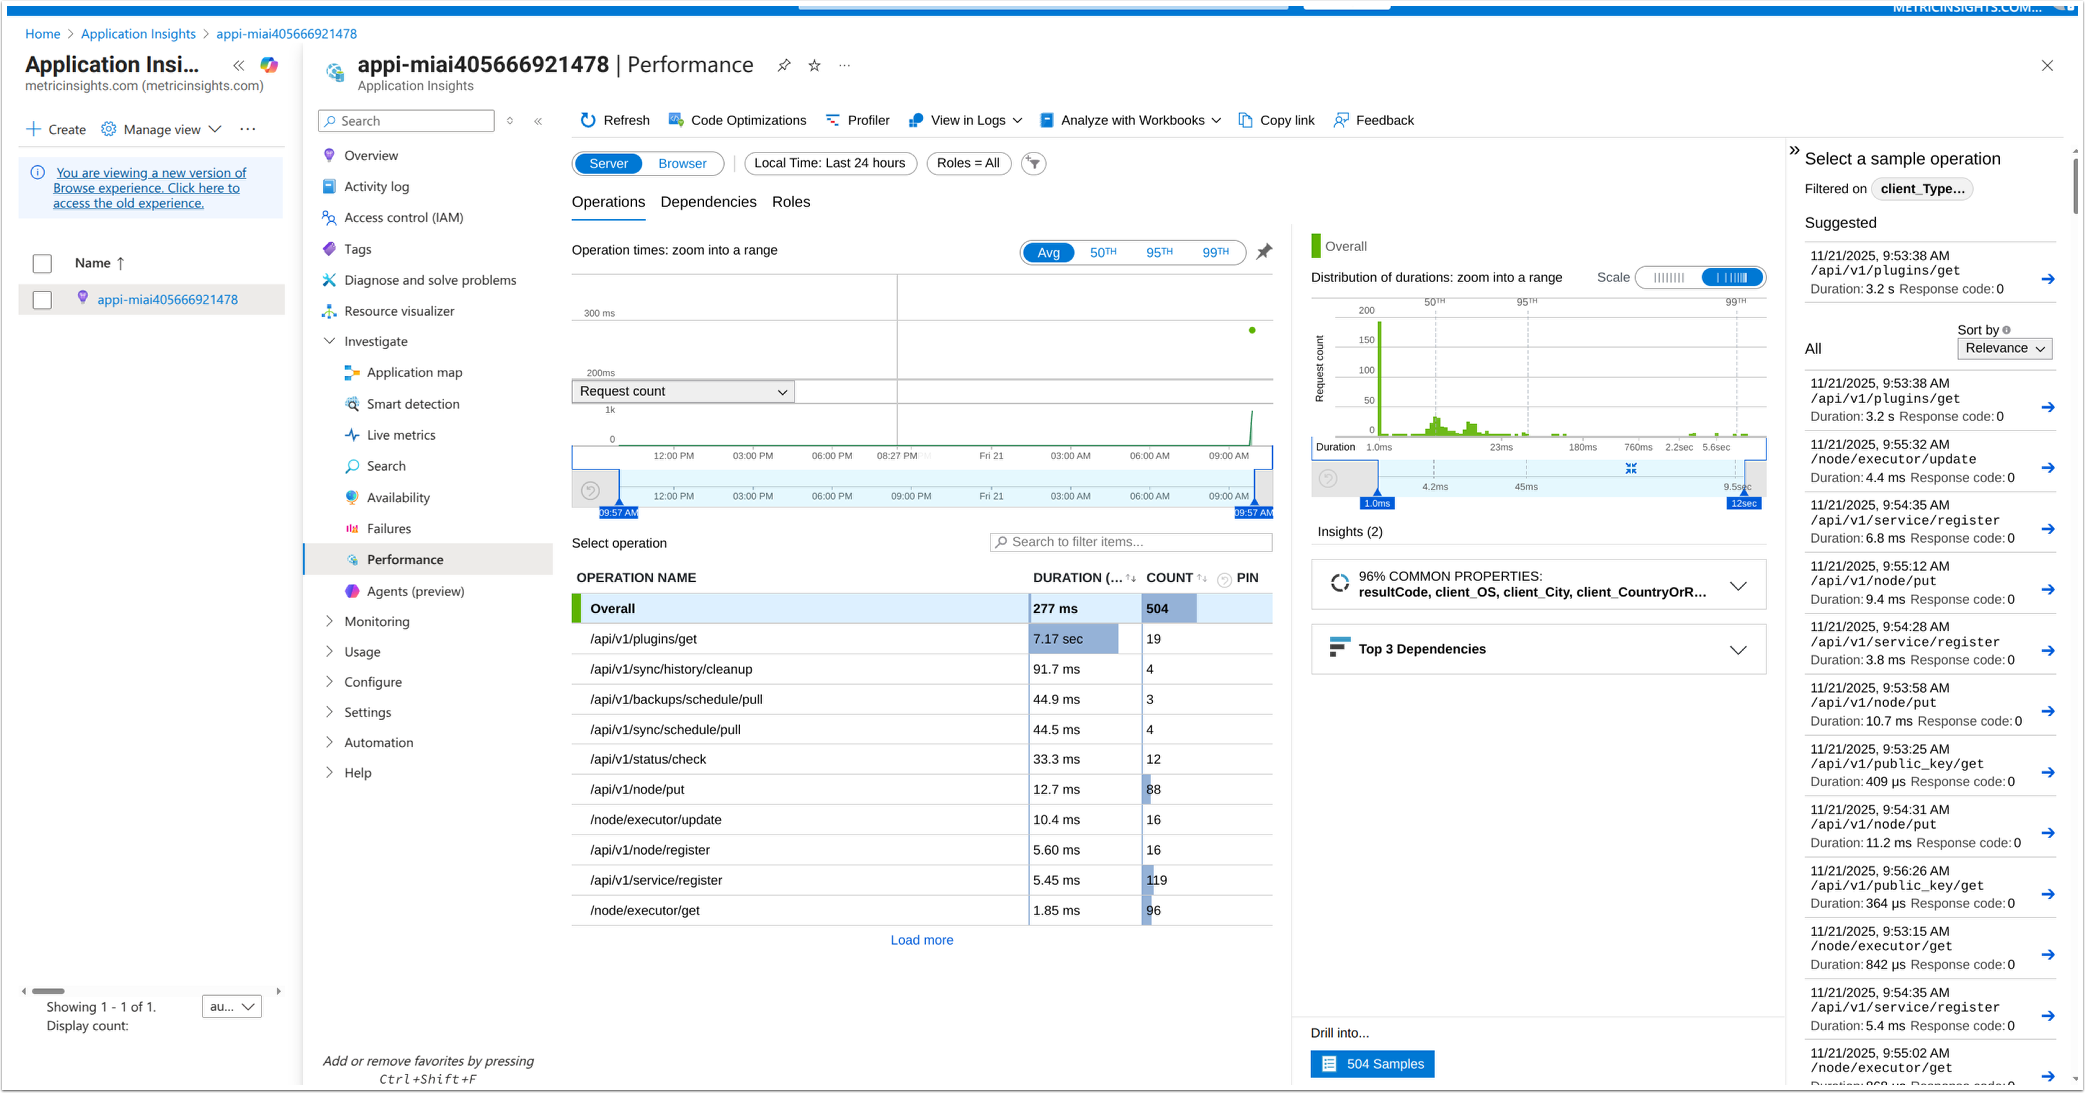
Select an operation to see its end-to-end transaction details.