MI Console is a web-based administration interface for the Metric Insights application, introduced in version 7.0.1. It centralizes the most common system administration tasks into a single UI, reducing the need for command-line access.
Through MI Console, administrators can monitor the health and performance of all MI application services (including CPU, RAM, and disk usage) and view live and historical logs. Configuration tasks such as managing SSL certificates, setting up SAML authentication, configuring user synchronization (LDAP or O365), scheduling cron jobs, adjusting timezones, and managing the embed whitelist are all handled directly from the interface. Additional capabilities include applying patches, managing backups, configuring proxy settings, enabling high-load mode, and setting up service downtime notifications via email or Slack.
Access to MI Console is restricted to Admin users and protected by mandatory two-factor authentication for any action that modifies system state or configuration. All such actions are recorded in a permanent Audit Log.
Table of contents:
Access MI Console
1. Grant Access to MI Console
NOTE:
- Beginning in v7.1.2, access to MI Console can be granted via MI Console's Admin Menu > Users tab.
- For Metric Insights versions prior to v7.1.2, access to MI Console can only be granted via the
mi-console-accesstool. - Only Admin users can be granted access to MI Console.
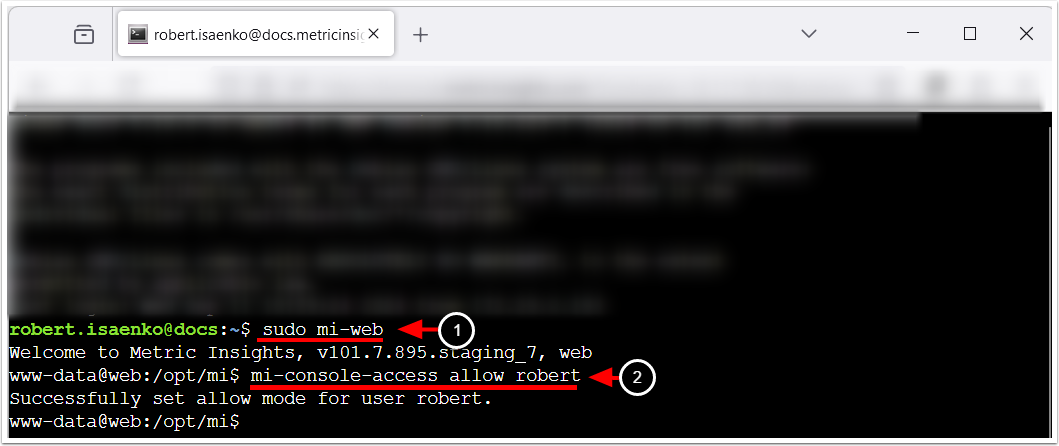
- Access the web container:
mi-web - Execute
mi-console-access allow <username>, providing a valid username.
You can also revoke a user's access to MI Console by executing the command: mi-console-access deny <username>.
2. Verify the Result
Access Admin > Users & Groups > User
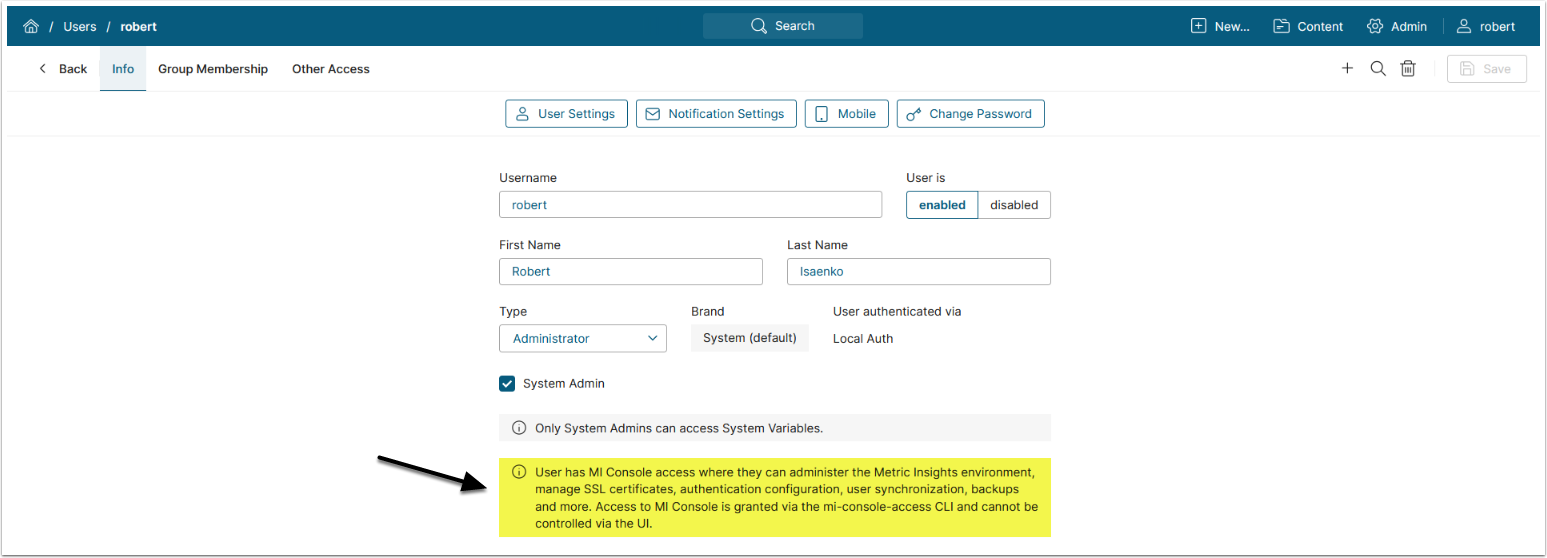
If access has been granted, a note will be displayed indicating that the user has MI Console access.
3. Log In to MI Console
Access https://<MI hostname>/console/ or via Admin > Status Monitor > System Stats > MI Console link.
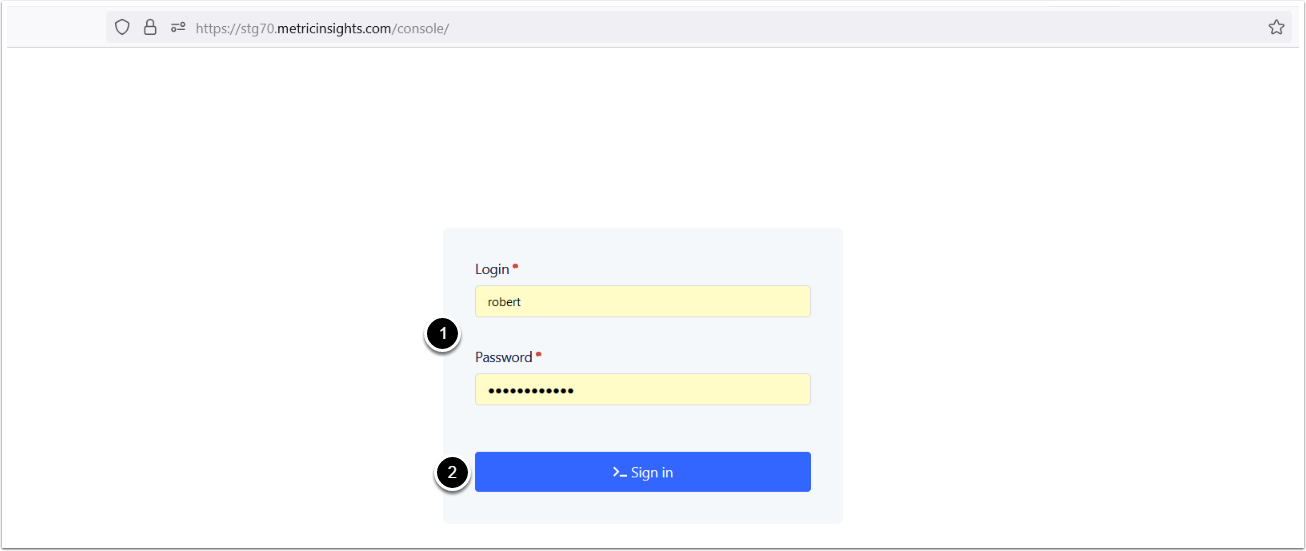
- Enter the credentials of the Admin user who has been granted access to the MI Console.
- [Sign In]
4. Authorize via 2FA
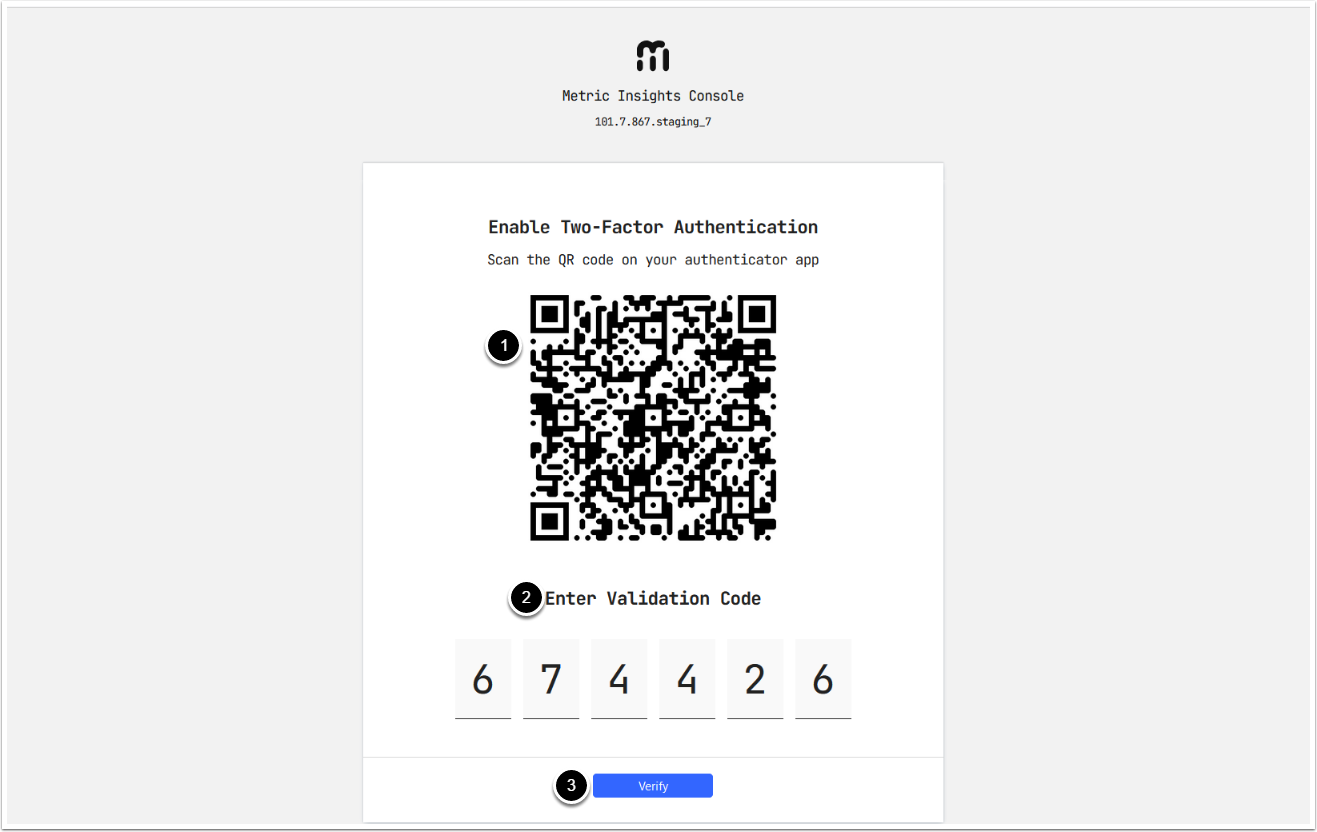
During your first login, you will be prompted to enable two-factor authentication (2FA):
- Scan the QR code using your authentication app (e.g., Google Authenticator).
- NOTE: 2FA is required for every action that changes the system's state or MI configuration. Information about these actions is stored in the Audit Log.
- Enter the validation code from your 2FA app.
- [Verify]
Overview
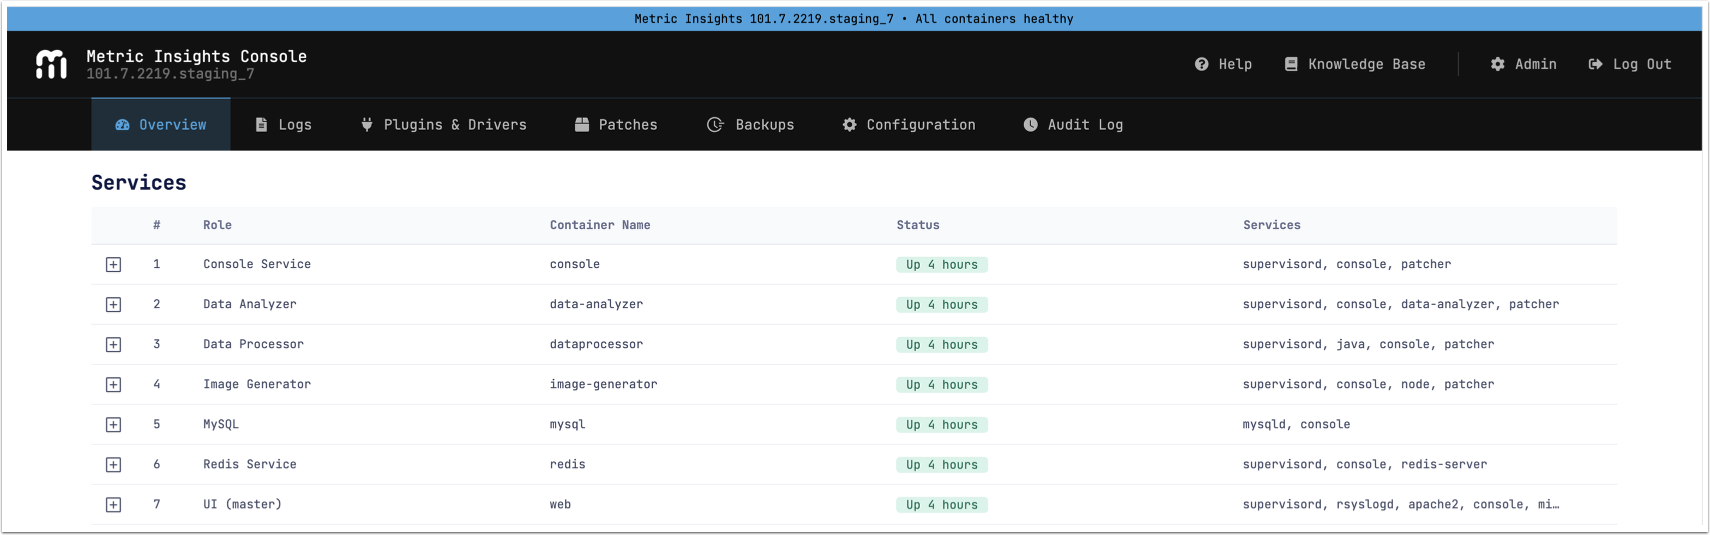
The Overview tab displays information about all MI application services, including:
- their status;
- RAM, CPU, and disk space usage;
- general information, as well as events related to those services.
Services
NOTE: A Seed node may still appear in the Services list, even after it no longer exists, if the system was upgraded from v6. This occurs because the system retains data on previously configured services, including obsolete entries.
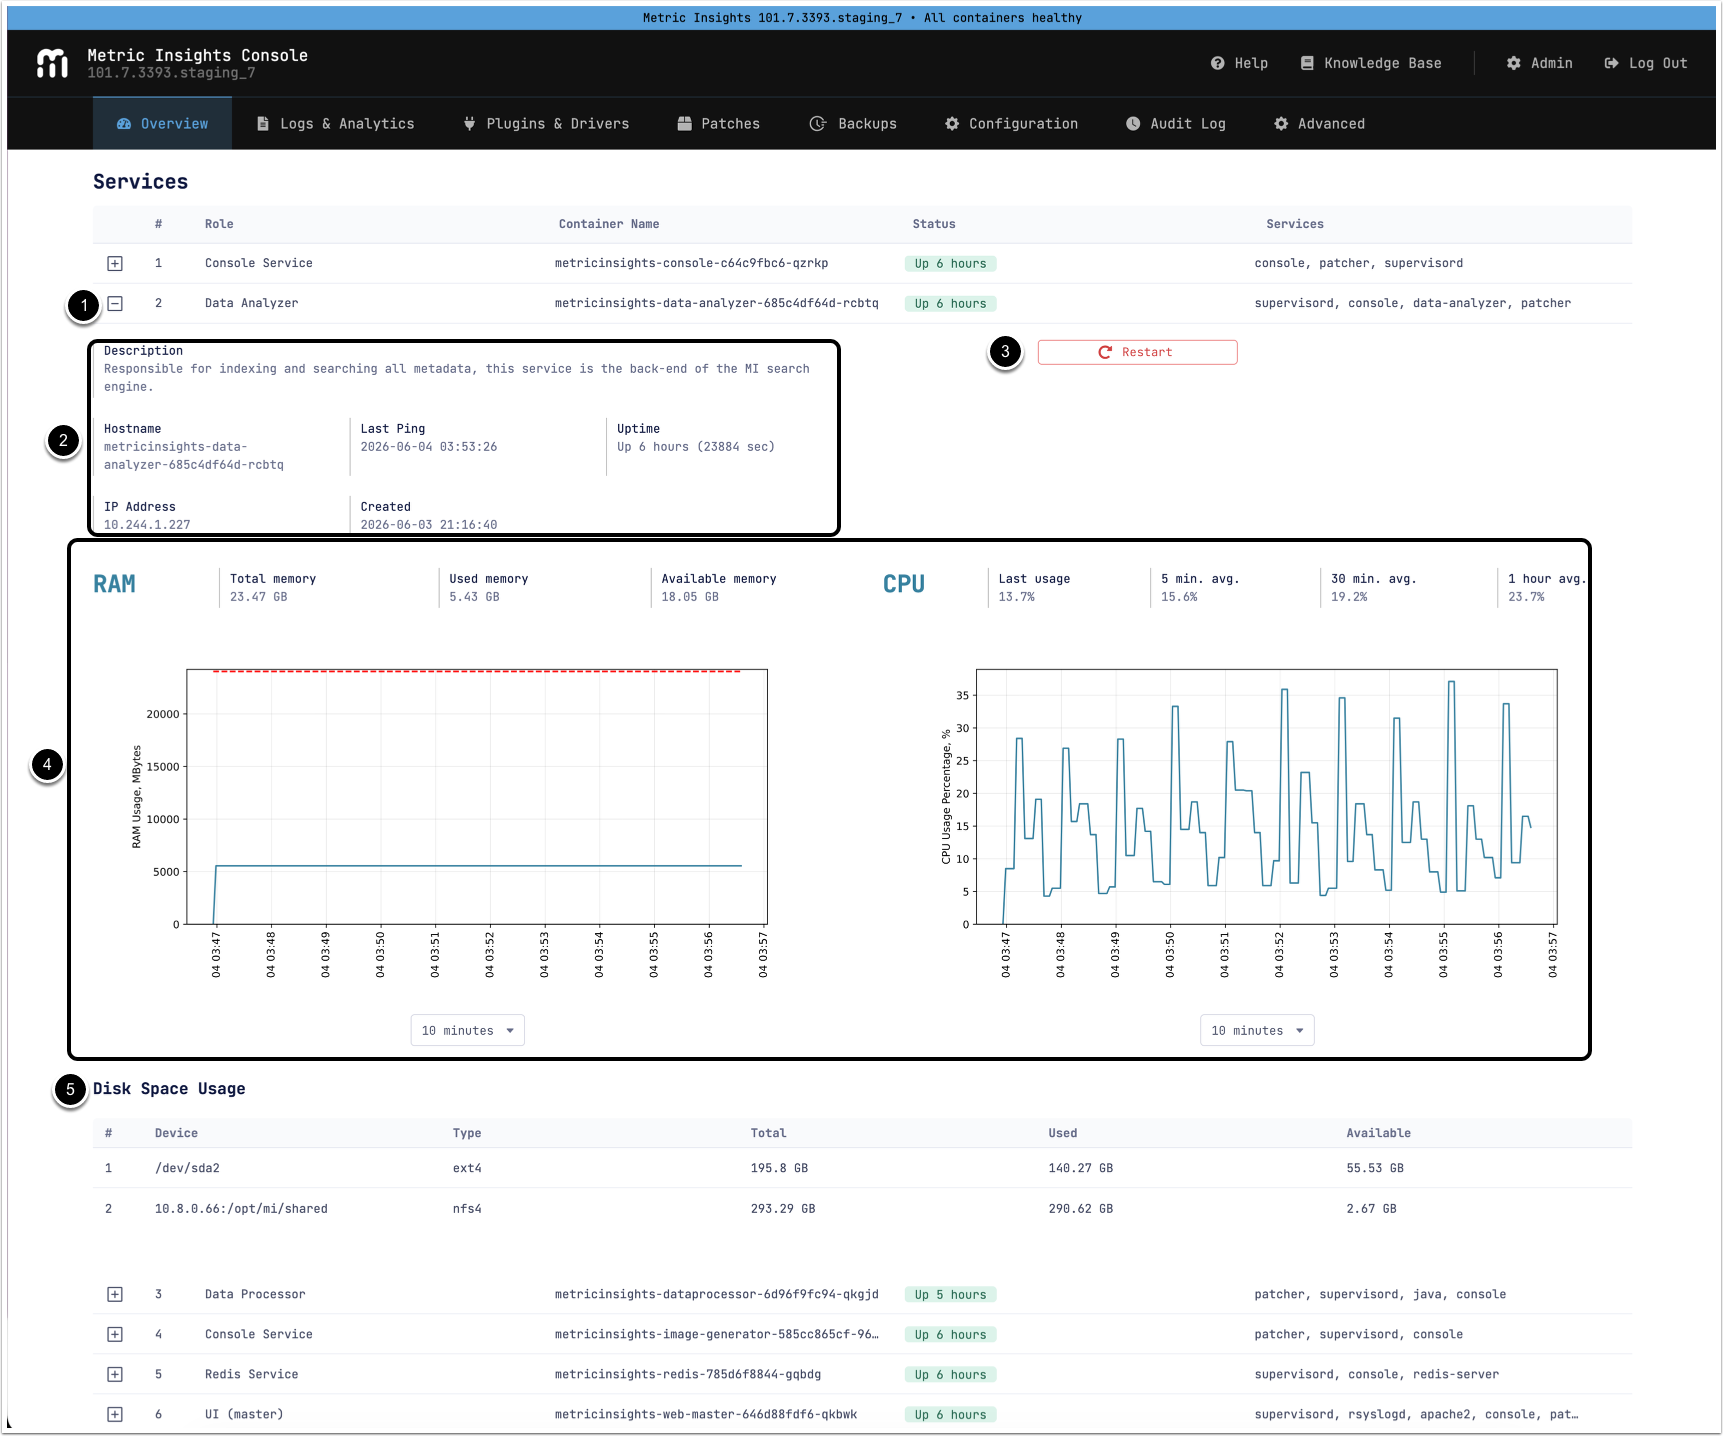
- Click [+] to expand and view complete information about a service.
- The top pane displays general information about the service.
NOTE: The time displayed is based on the MI application's time zone.
- You can [Restart] the service from the UI.
- You can set the interval for the RAM and CPU graphs; the default value is 10 minutes.
- Disk Space Usage displays information about a volume's path, the volume's filesystem type, and details about disk usage.
Recent Events
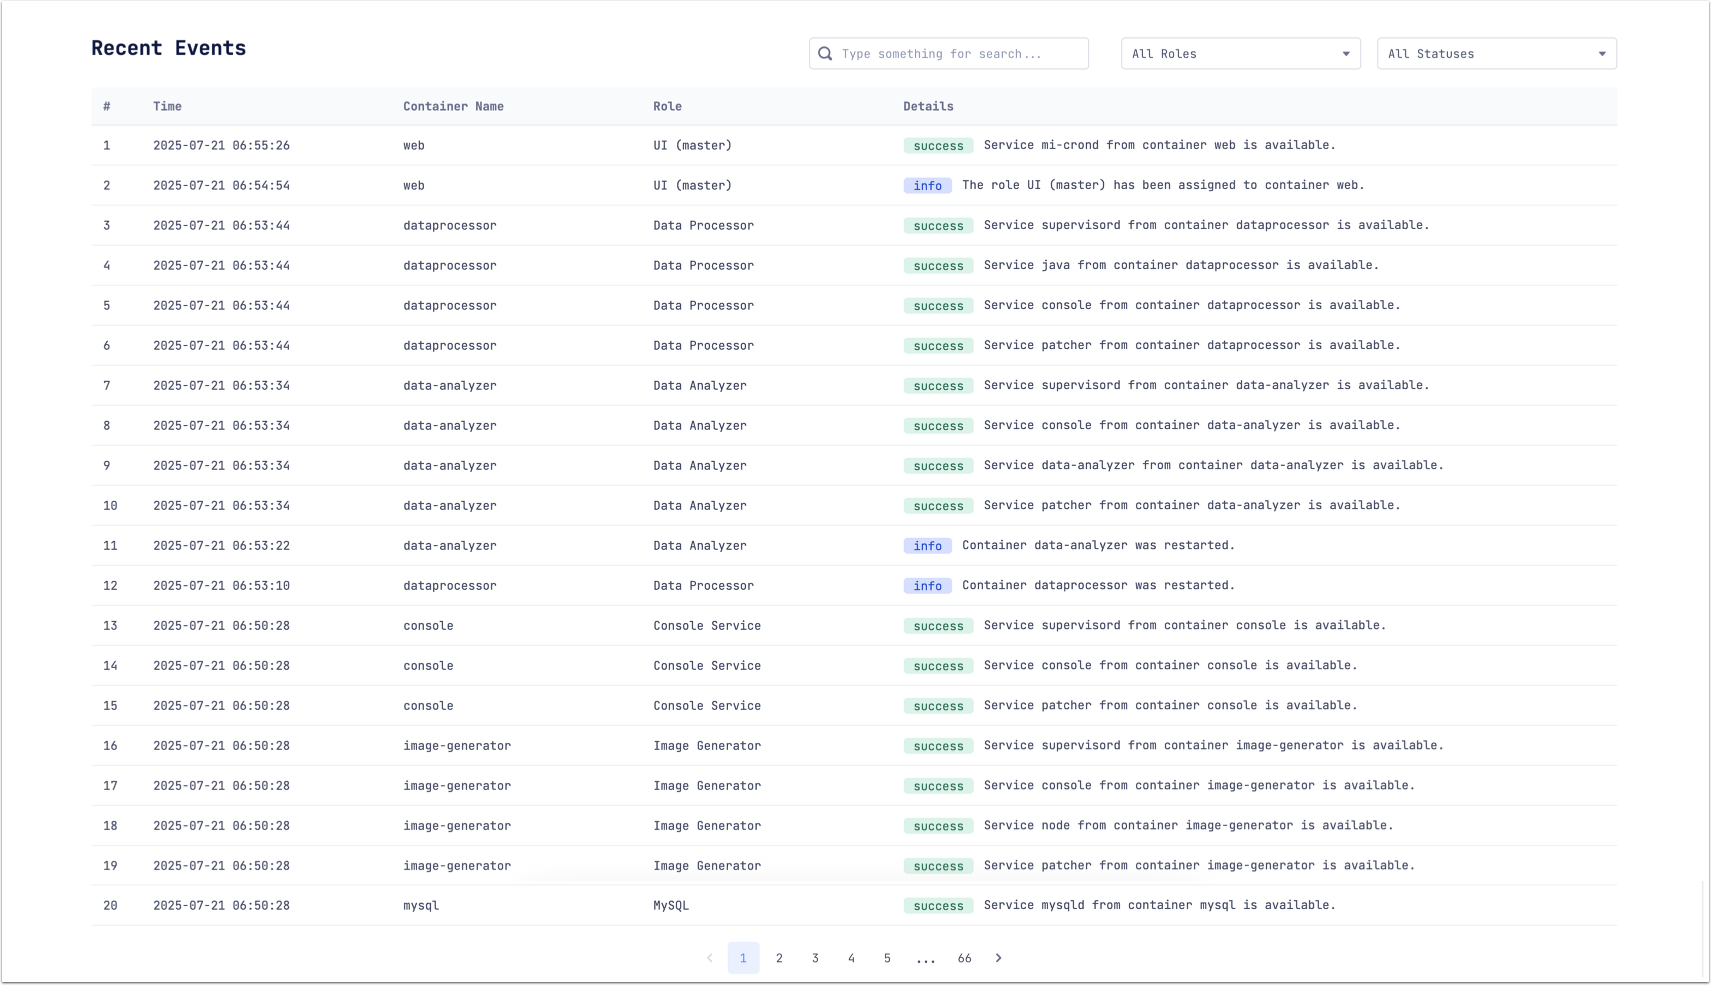
This table displays information about events related to services. Node Name represents the name of the service, and Service represents the role that the service executes.
Logs & Analytics
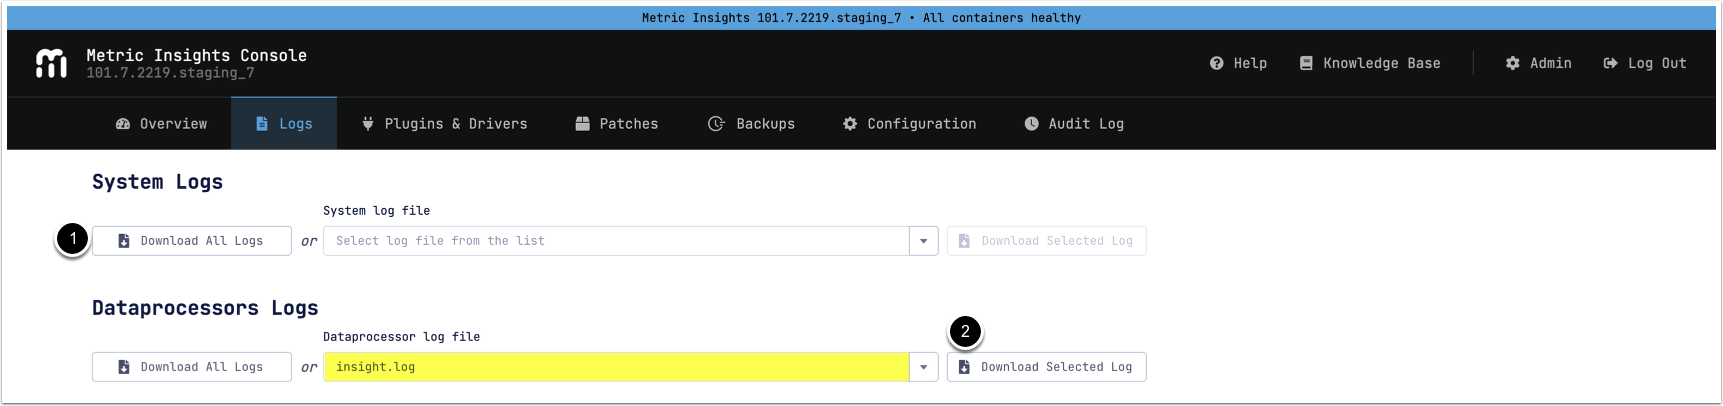
NOTE: System Logs contain logs from opt/mi/log; Dataprocessor Logs contain logs from opt/mi/log/dataprocessor.
- Available download options are:
- [Download All Logs],
- Select a log file from the list and [Download Selected Log].
- v7.2.1+: Select a log and [Show Runtime Log] to see logs streaming in live time.
- Click [Open Analytics] to open GoAccess Web Analytics Dashboard.
- For MI v7.1.1, access the GoAccess dashboard at:
https://<MI hostname>/console/goaccess
- For MI v7.1.1, access the GoAccess dashboard at:
Plugins & Drivers
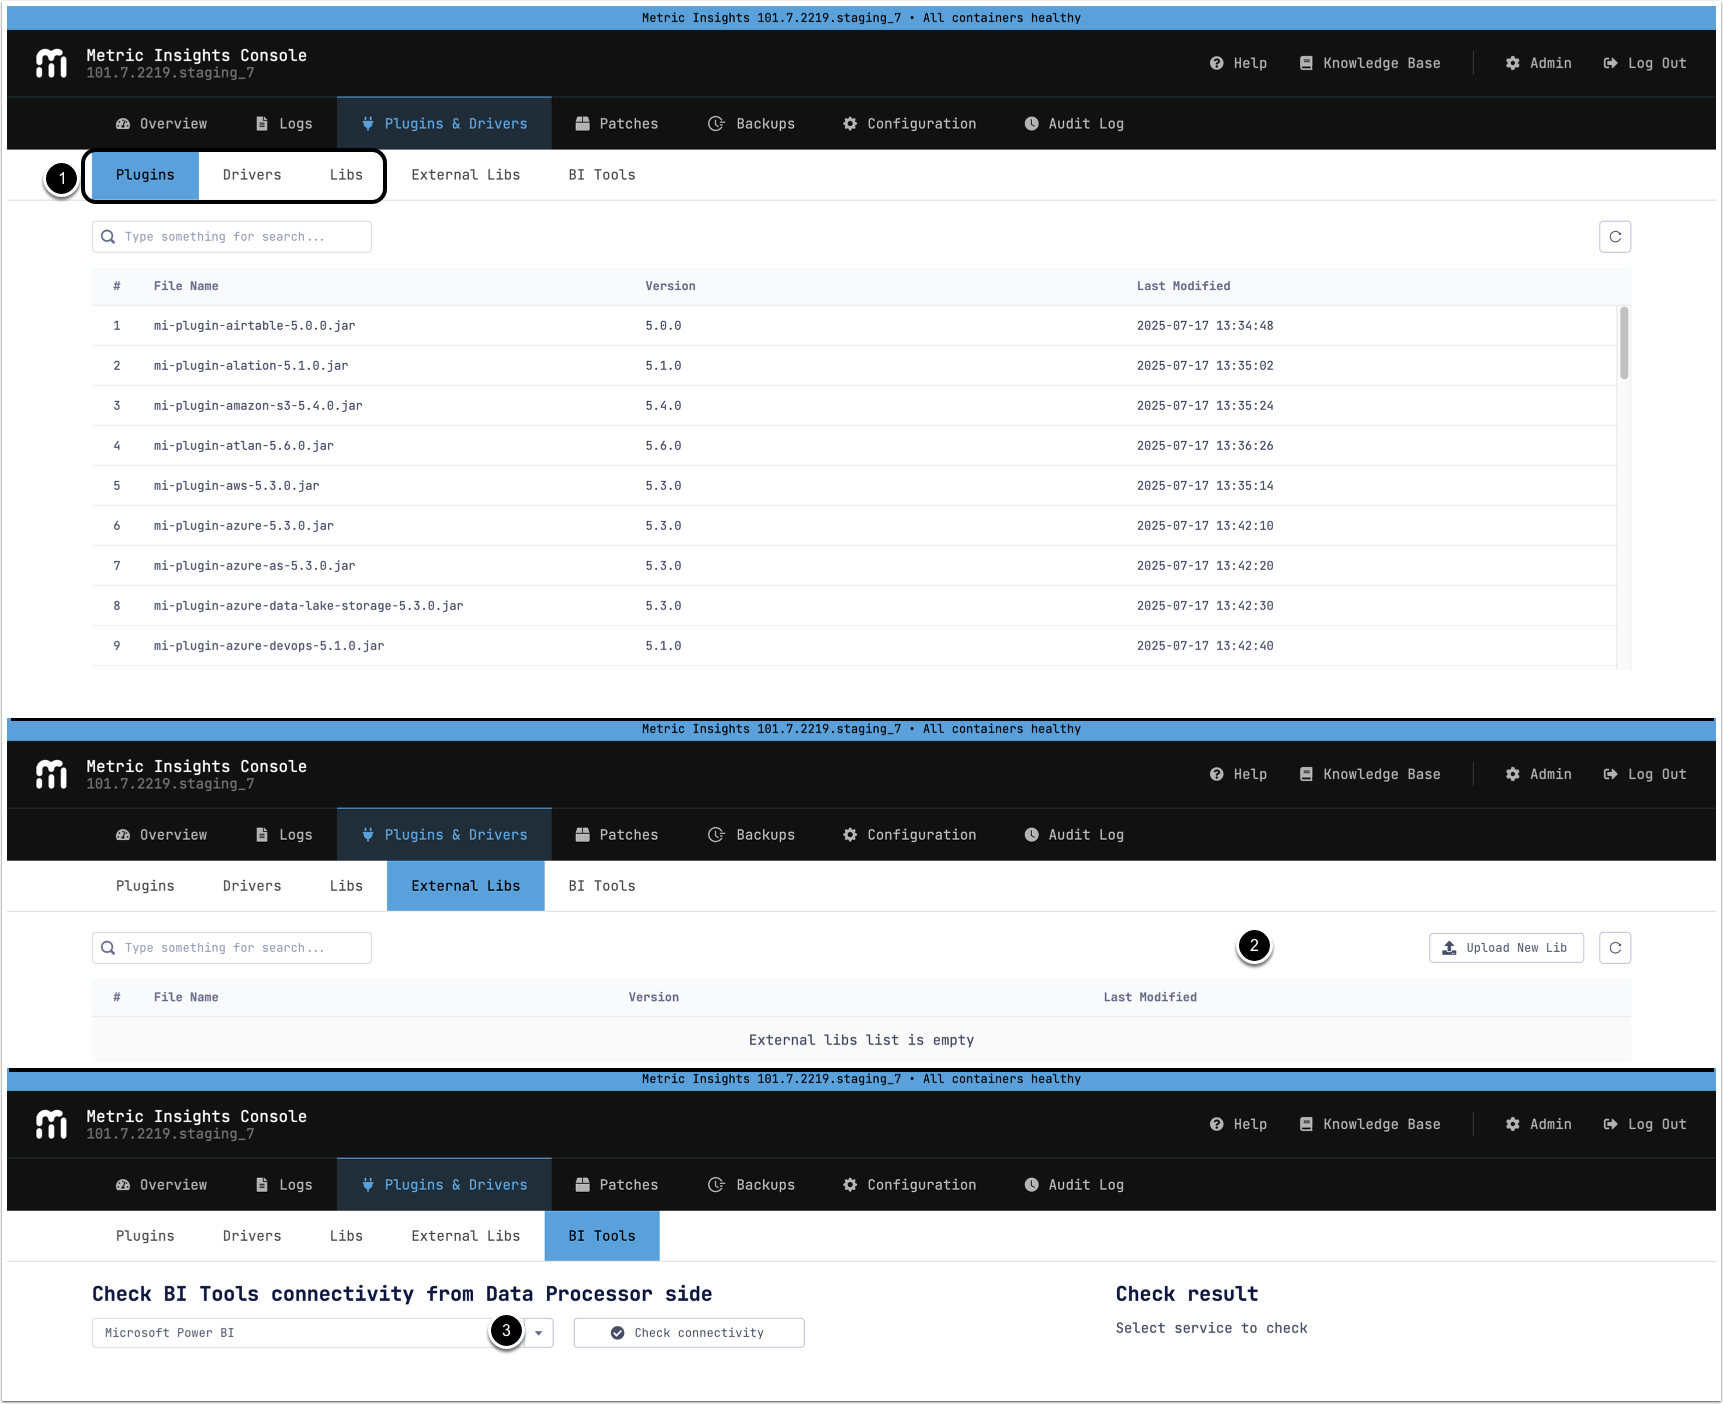
- The first three tabs display information about the Plugins, Drivers, and Libs used by the MI application.
- You can upload External Libs on the corresponding tab.
- The last tab, BI Tools, can be used to ping BI tools' servers and ports to check connectivity.
Patches
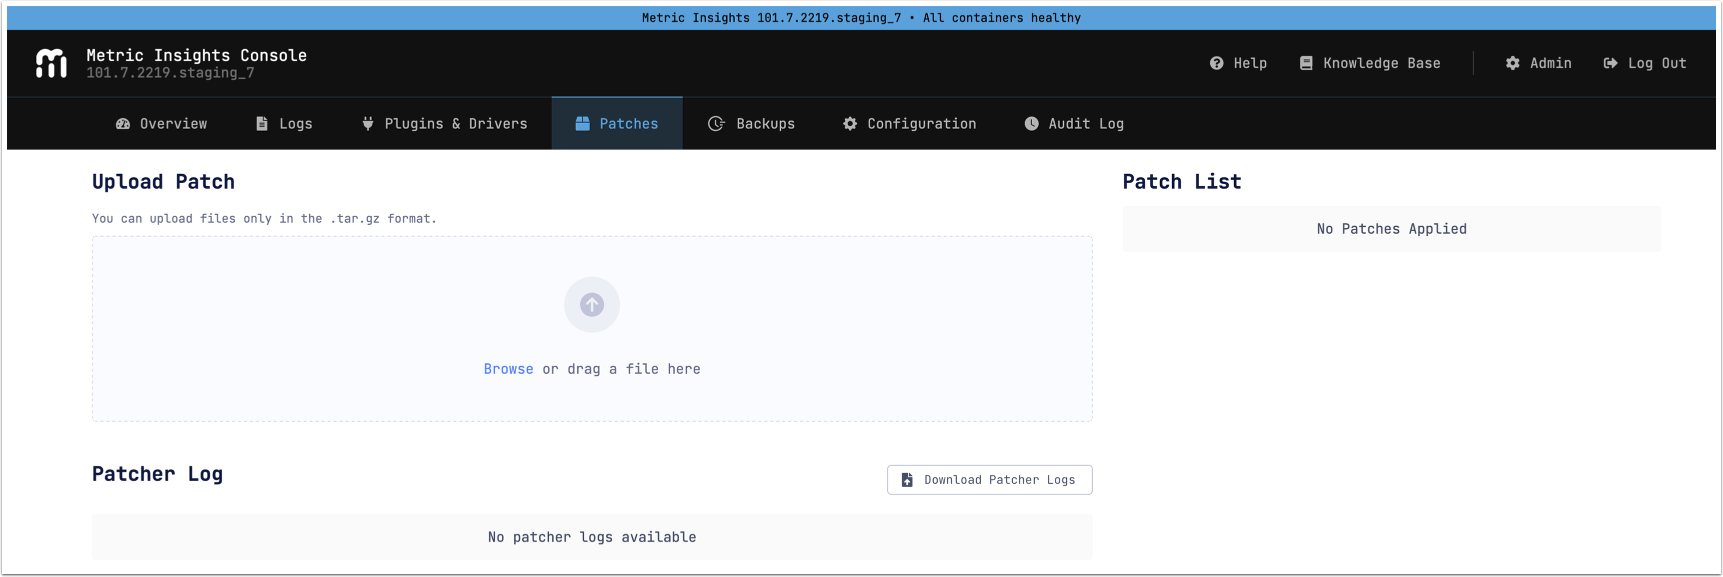
On this tab, you can upload patches, view a list of the applied patches, and download Patcher logs.
Configuration
General
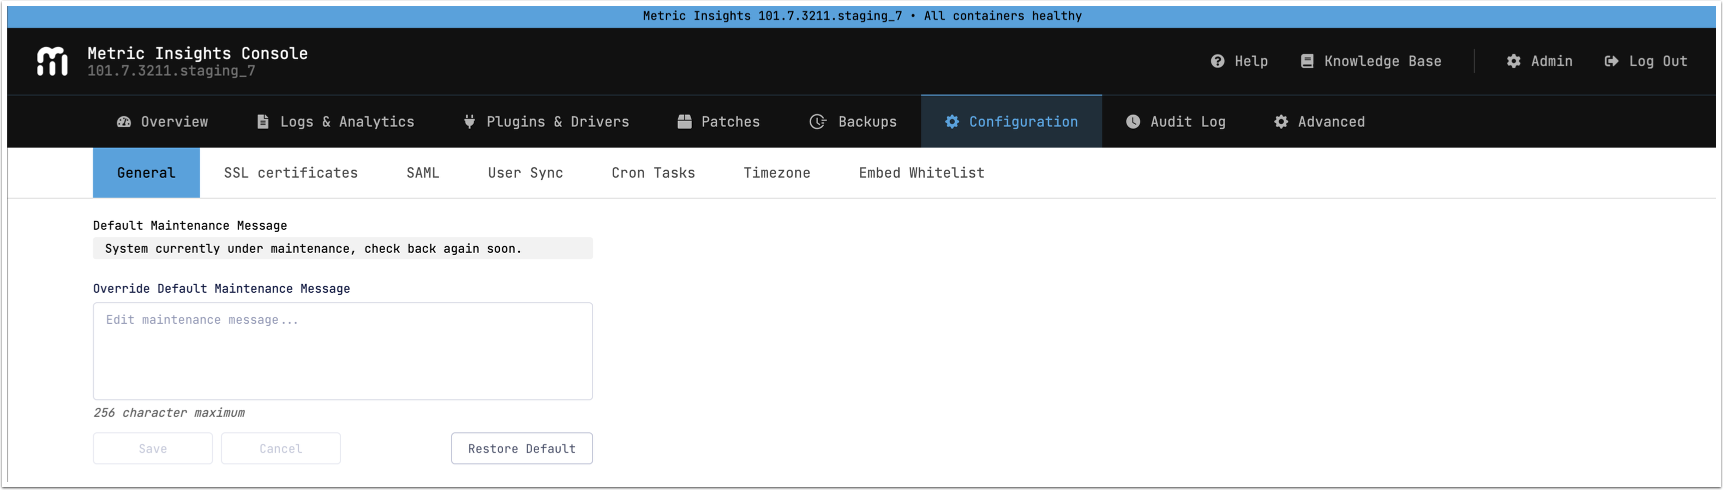
Use this tab to override the default maintenance message.
SSL Certificates
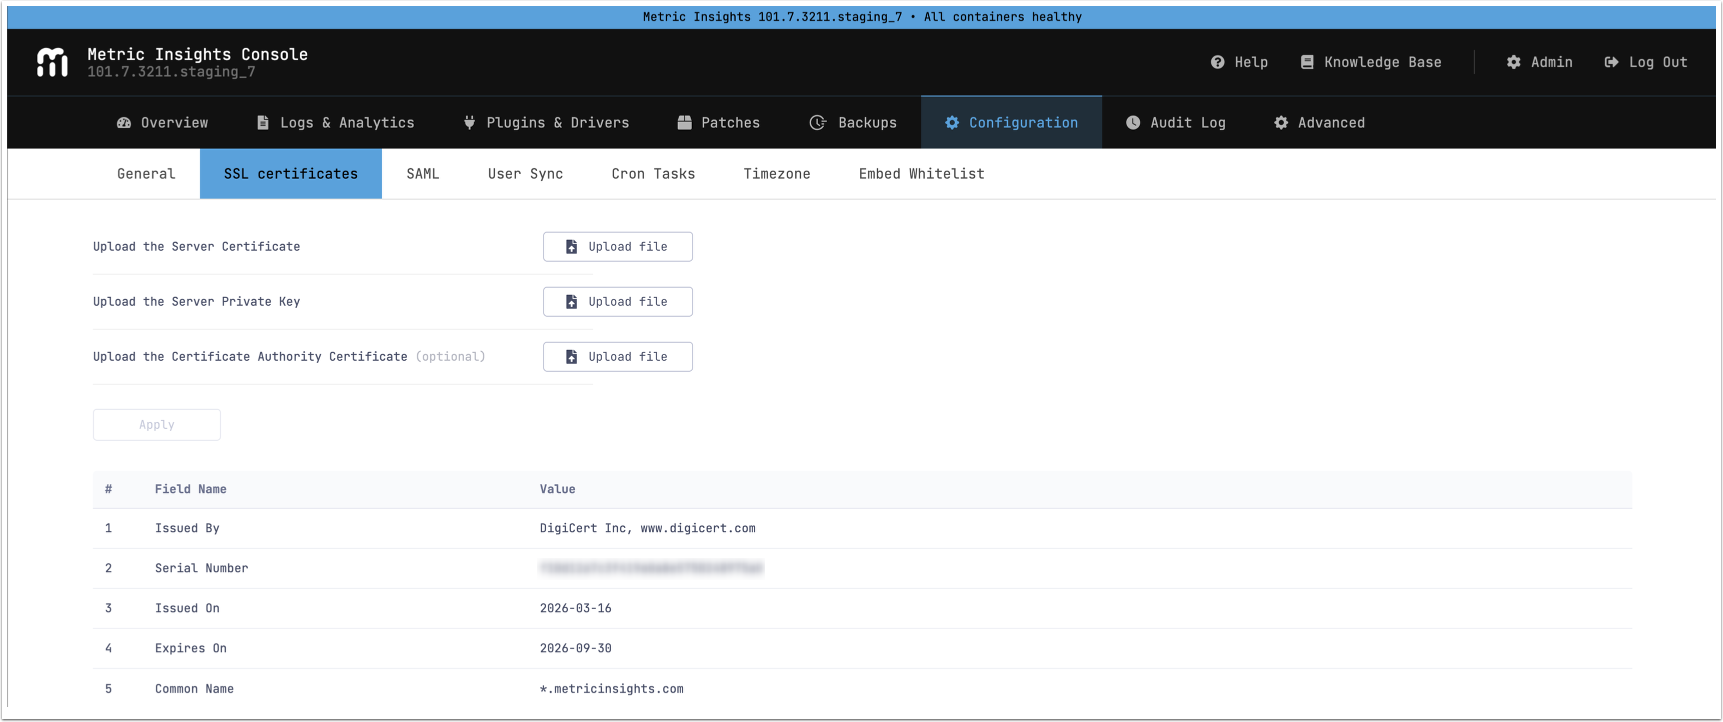
NOTE: The uploaded Certificate and Key files must match.
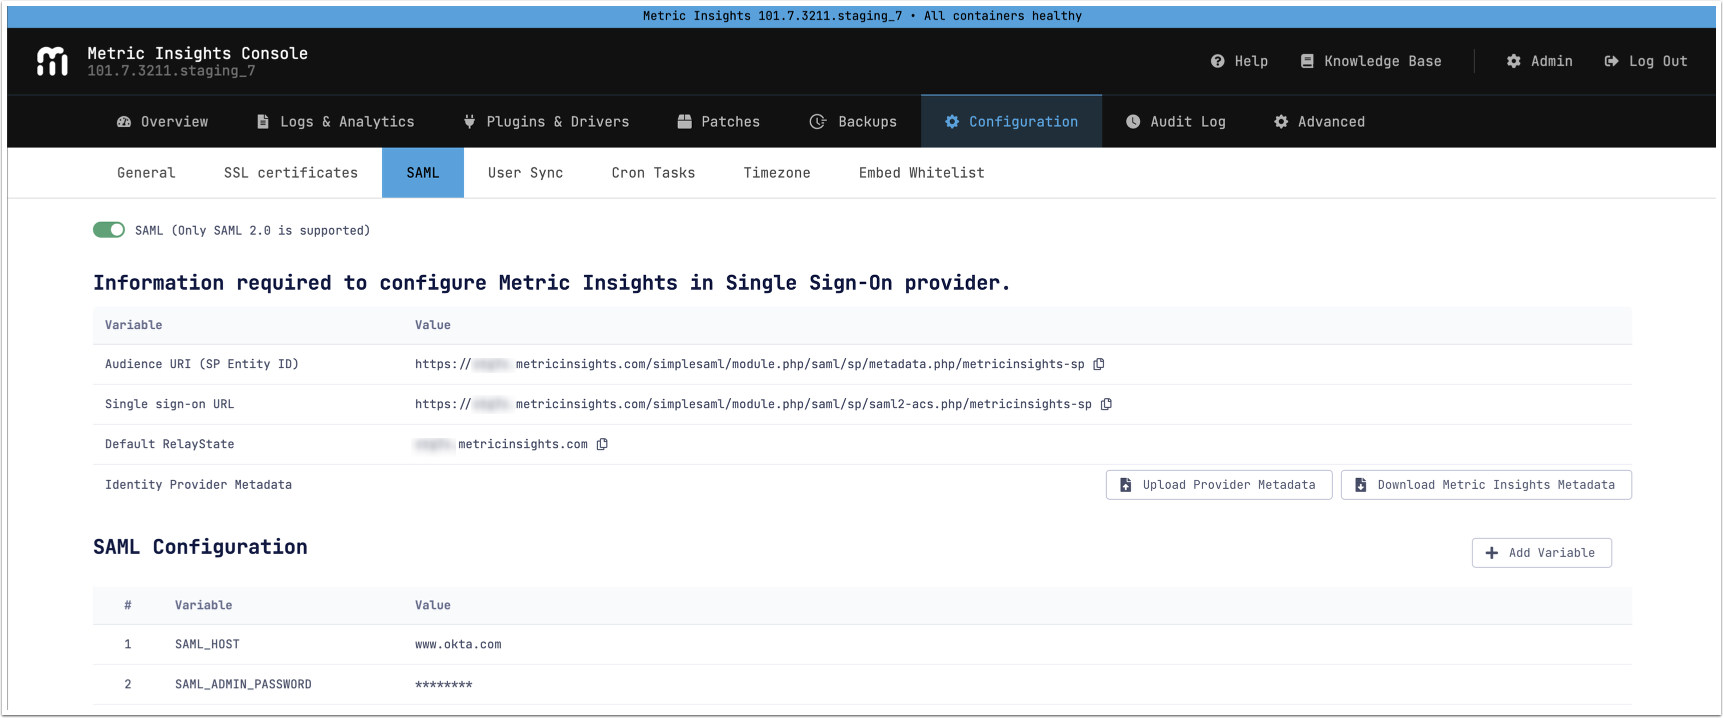
User Sync
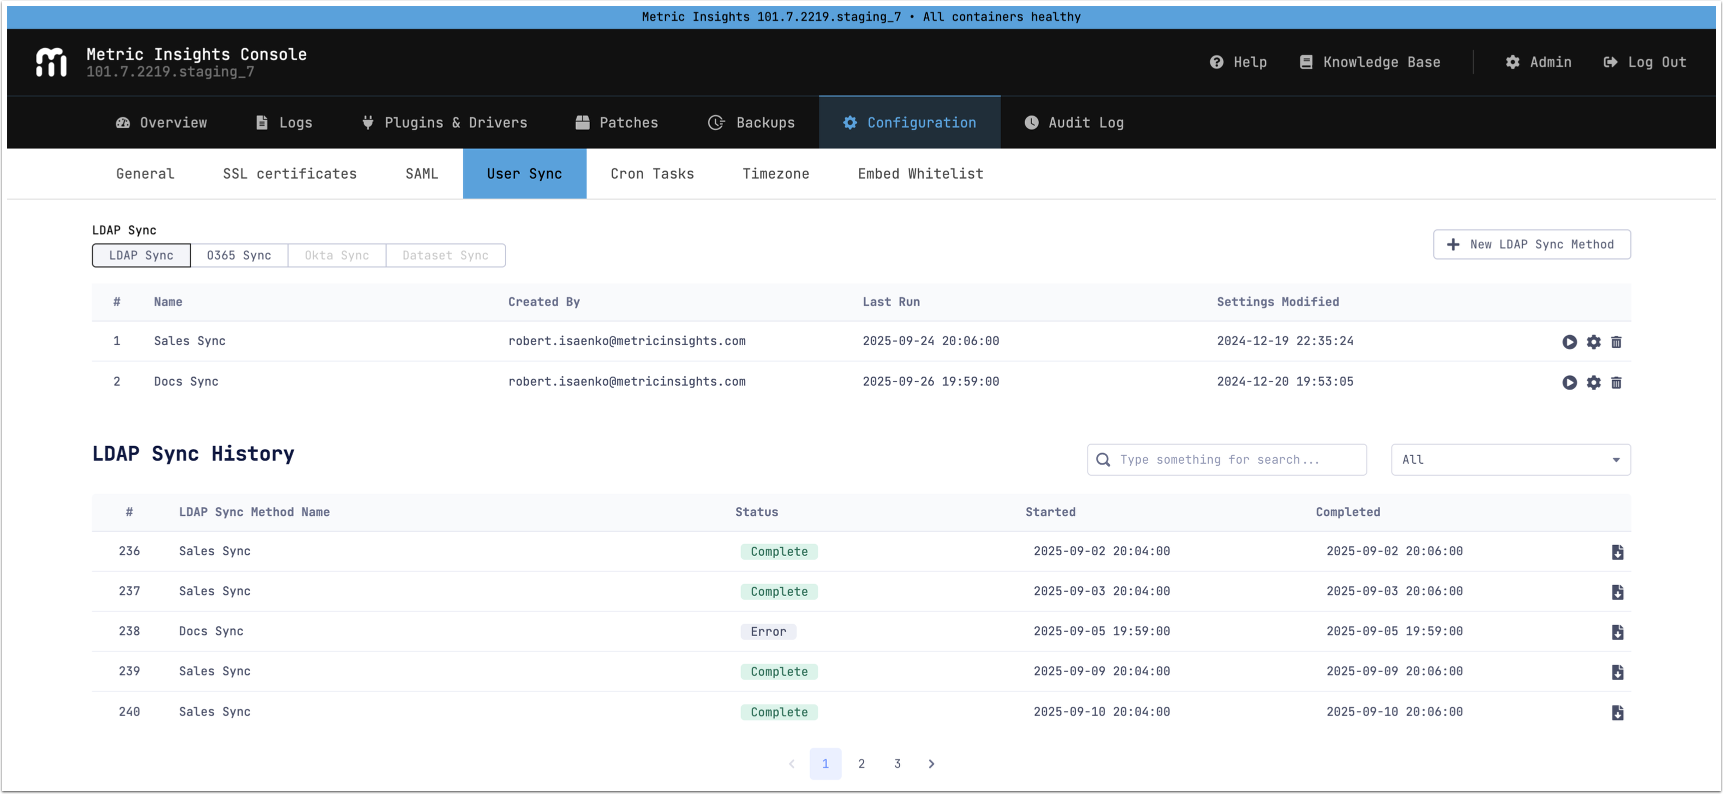
NOTE: See the following articles for more details:
Cron Tasks
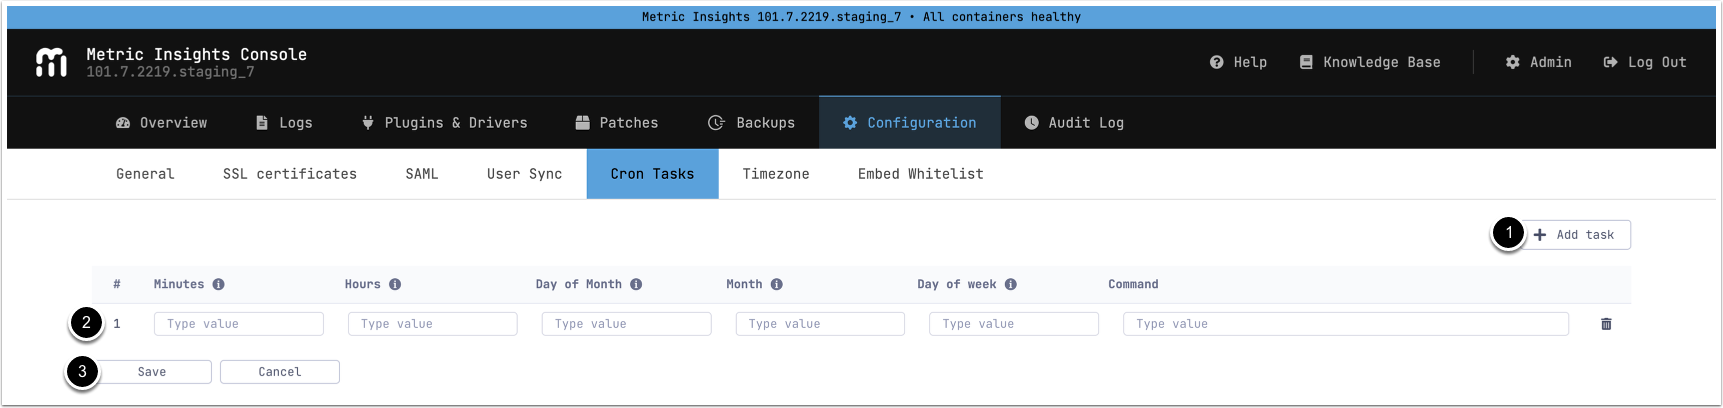
NOTE: The CRON command is not validated by the system; the user is responsible for its input.
- [+ Add Task]
- Fill in the cron task details. Hover over the information icon to see the accepted format and values for each field.
- [Save]
The Cron Tasks tab can be disabled by setting the environment variable DISABLE_CRON_UI to true within /opt/mi/config/deployment/credentials/console.env and redeploying the console container:
- Log in to the MI application host as the root user.
$ sudo -i- Navigate to the
/opt/mi/config/deployment/credentialsdirectory.
cd /opt/mi/config/deployment/credentials- Open
console.envand setDISABLE_CRON_UItotrue:
$ nano console.env
...
DISABLE_CRON_UI=true
...- Redeploy the console container:
$ mi-control rm --stop console
$ mi-control up -d consoleTimezone
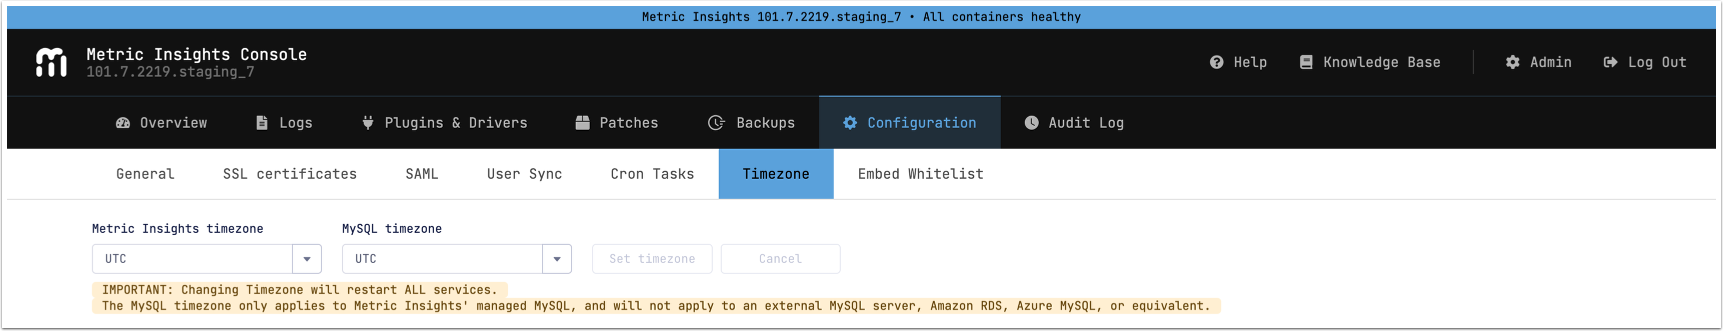
After installing the MI application, you can change both the MI timezone and the MySQL timezone here. This functionality is equivalent to using the --timezone installer option. Information about timezone changes in Metric Insights is recorded in the audit.log file.
NOTES:
- Changing the timezone will restart the corresponding services.
- Changing the Metric Insights timezone specifically will restart all services, including the MI Console and Chatbot.
- Changing the MySQL timezone only affects the local MySQL instance.
Embed Whitelist
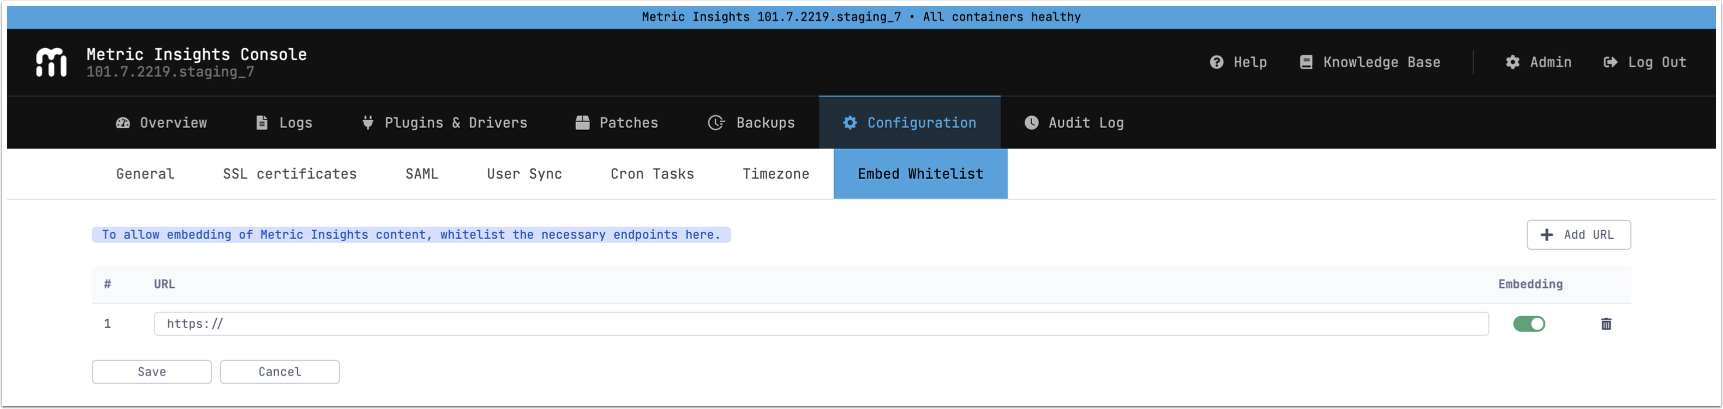
Use this tab to whitelist domains and web applications where MI Application objects can be embedded. This allows MI content to be embedded on the specified sites.
Audit Log
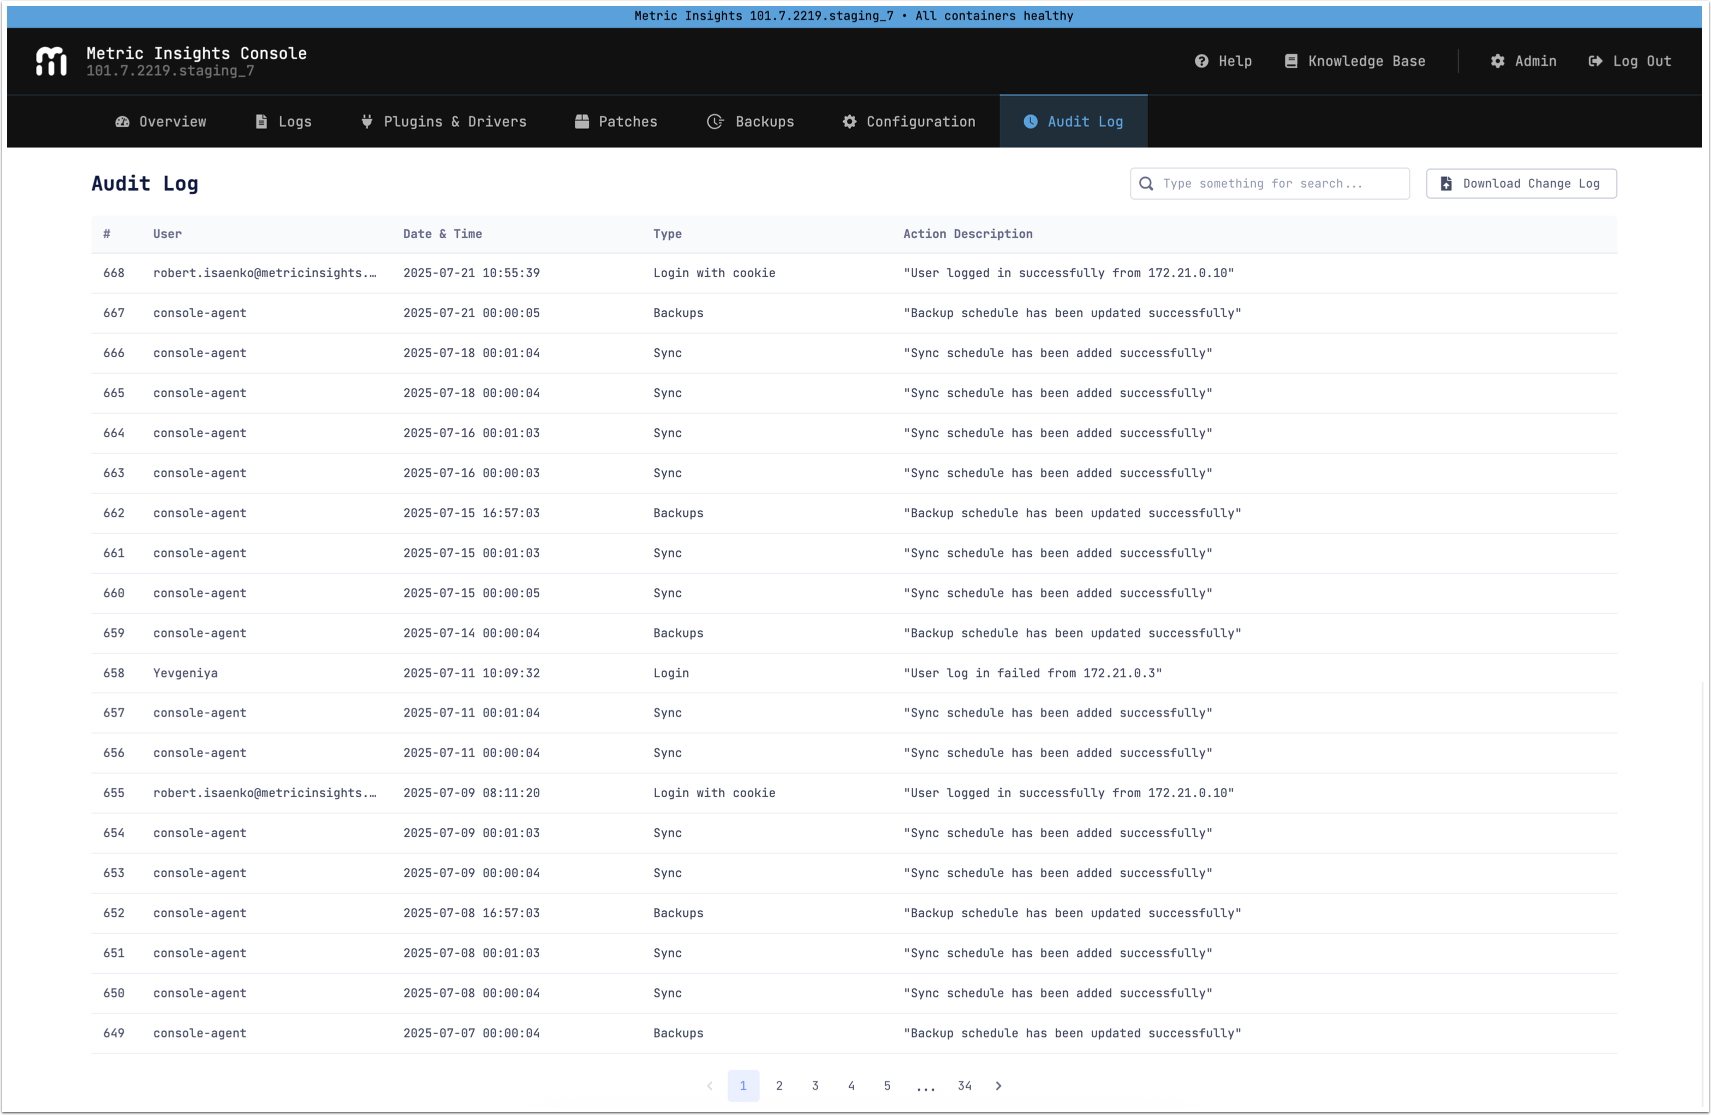
This section lists all operations that require a 2FA code. A 2FA code is required for any action that changes the system's state or MI configuration. The operations listed here are permanently stored.
Advanced
NOTES:
- Enabling High load mode requires sufficient RAM allocation for the Web service:
- Simple Install:
10GB+ - Orchestrated Environments:
- Web Master:
15GB+ - Web Slave:
10GB+each
- Web Master:
- Simple Install:
- Other application services are unaffected by this mode.
- Database
max_connectionsparameter must correspond to the desired concurrent user requests amount. Ideally, it should include a reserve 500–1000 connections; e.g.; for a target of 3,000 concurrent users per second, configure at least 3,500–4,000 maximum database connections.- See recommended MySQL parameters for details on other parameters.
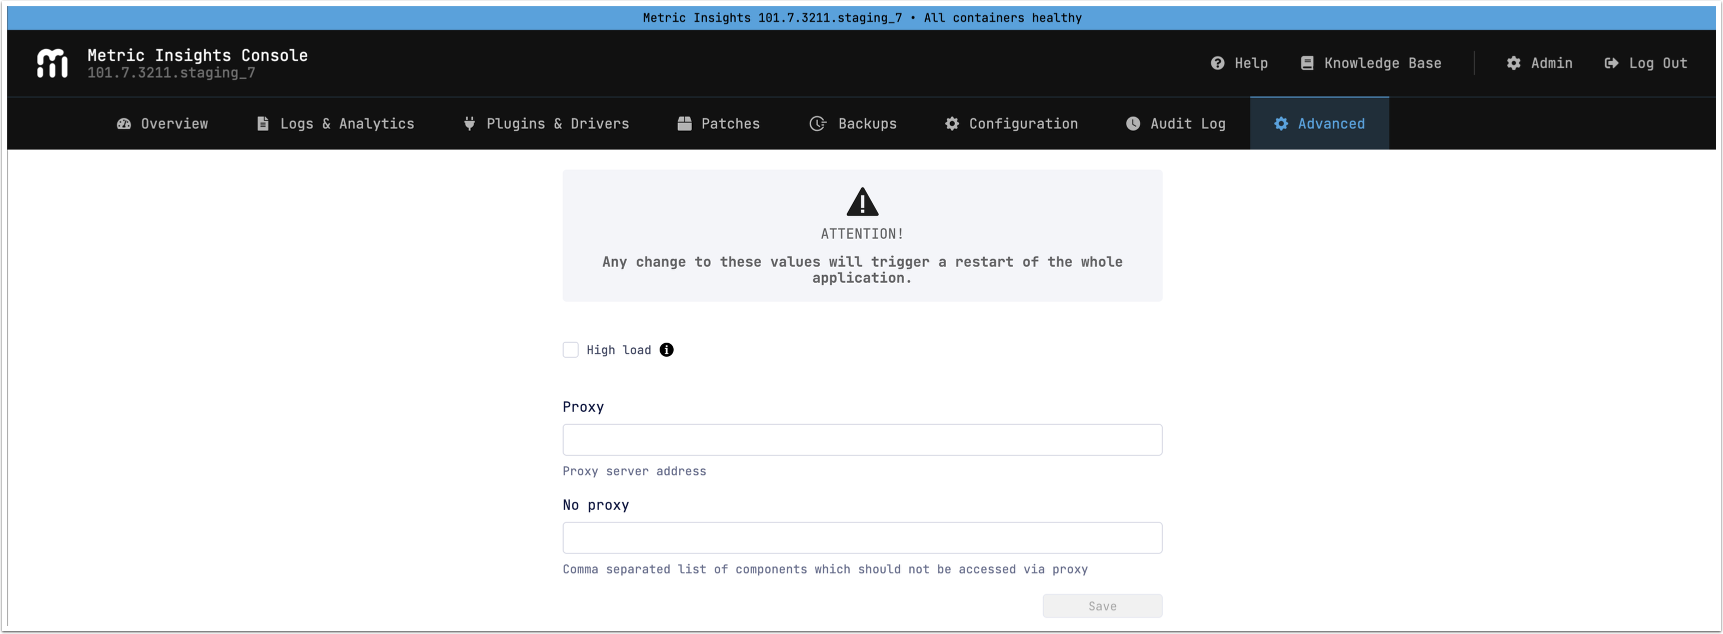
This section allows configuring High load mode and proxy settings:
- High load: Turn on this setting to enable the web service to handle a significantly higher volume of simultaneous concurrent user requests.
- Proxy: Enter the proxy server address.
- No proxy: Enter a comma-separated list of components that should not be accessed by proxy.
Admin Menu
Notifications
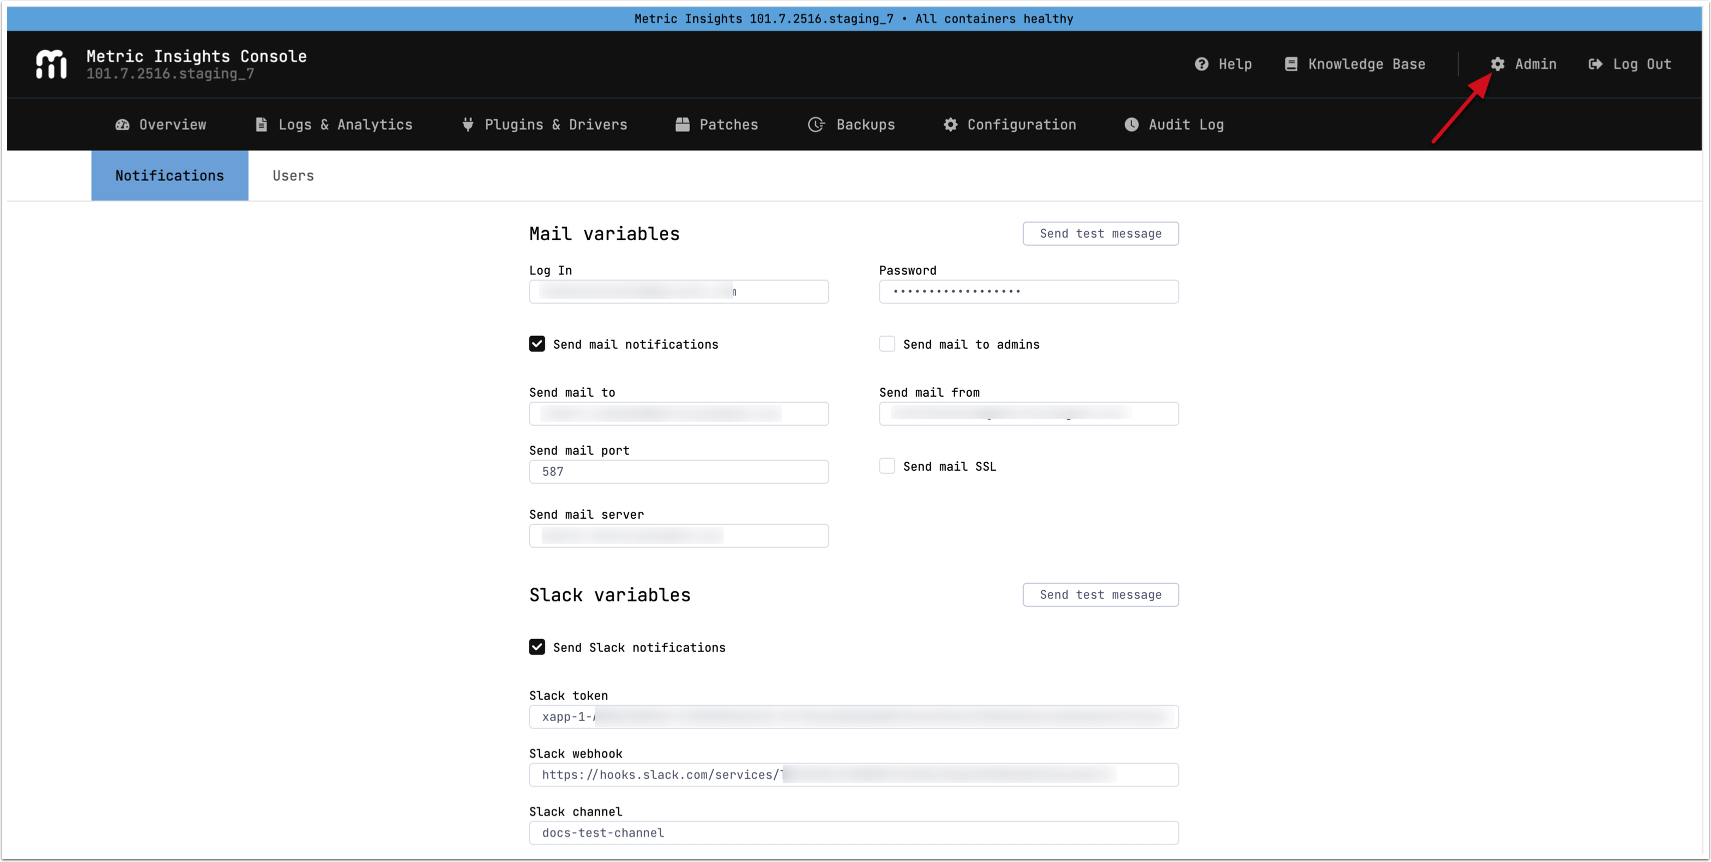
From the Notifications tab, configure alerting for service downtime events. Options include email and Slack notifications, or notifying MI Console administrators.
NOTE: See Configure Notifications for MI Console for more details.
Users
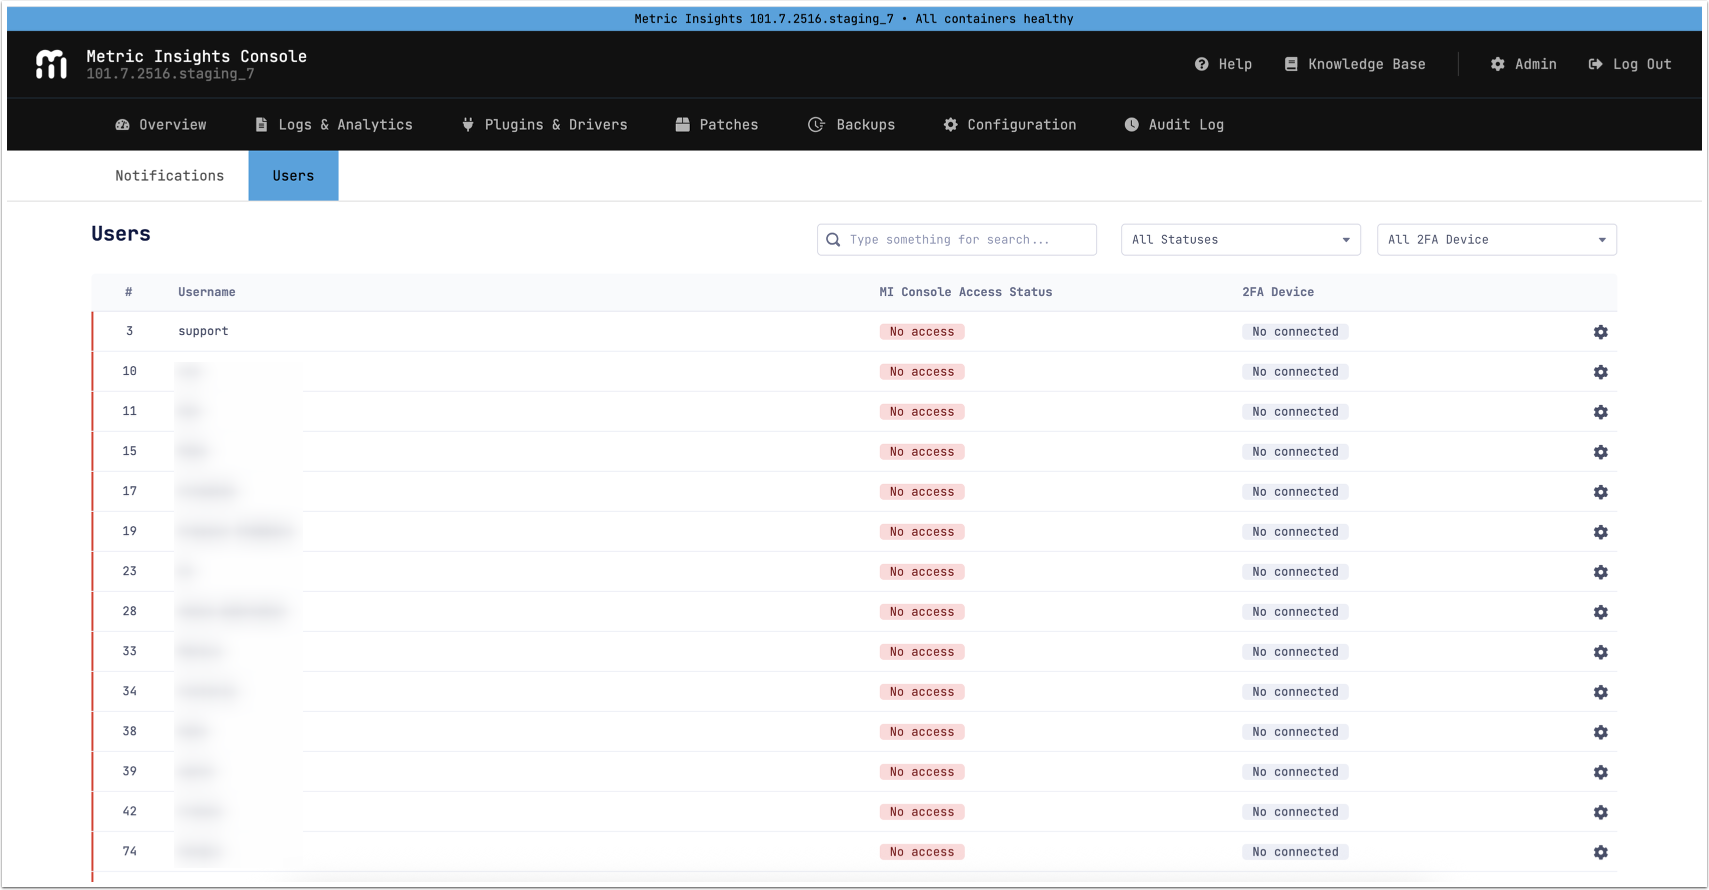
Beginning in v7.1.2, MI Console introduces a new Users tab, where you can grant or revoke MI Console access and reset the two-factor authentication (2FA).
See Managing Access for MI Console Users for details.