Beginning in v7.2.0, several Metric Insights application services can be configured to send metrics to Prometheus. This allows you to monitor application performance and health indicators such as request rate, response time, error counts, and memory usage.
This article assumes you already have a self-hosted Prometheus instance, and explains how to modify the Prometheus configuration file to enable metric collection from the selected Metric Insights application services.
The following Metric Insights application services support Prometheus metric export:
- Console;
- Data Analyzer;
- Concierge (AI);
- Data Processor.
Configure Prometheus
Update the configuration file of your self-hosted Prometheus instance as shown below:
  - job_name: '<service>'
    scheme: https
    metrics_path: '/metric/<service>'
    authorization:
      type: "OAuth"
      credentials: "<CONSOLE_ACCESS_TOKEN>"
    static_configs:
      - targets: ['<MI_hostname>:8081']
Replace the following placeholders with actual values:
- <service>: The Metric Insights application service from which Prometheus will collect metrics.
- Supported values:
console,data-analyzer,concierge,data-processor.
- Supported values:
- <CONSOLE_ACCESS_TOKEN>: An MI Console token stored in the
CONSOLE_ACCESS_TOKENvariable in the the .env files of the services. - <MI_hostname>: The full hostname of your Metric Insights application.
Example Prometheus configuration:
  - job_name: 'dataprocessor'
    scheme: https
    metrics_path: '/metric/dataprocessor'
    authorization:
      type: "OAuth"
      credentials: "ABc1d*******"
    static_configs:
- targets: ['example.metricinsights.com:8081']Example Metrics Visualization
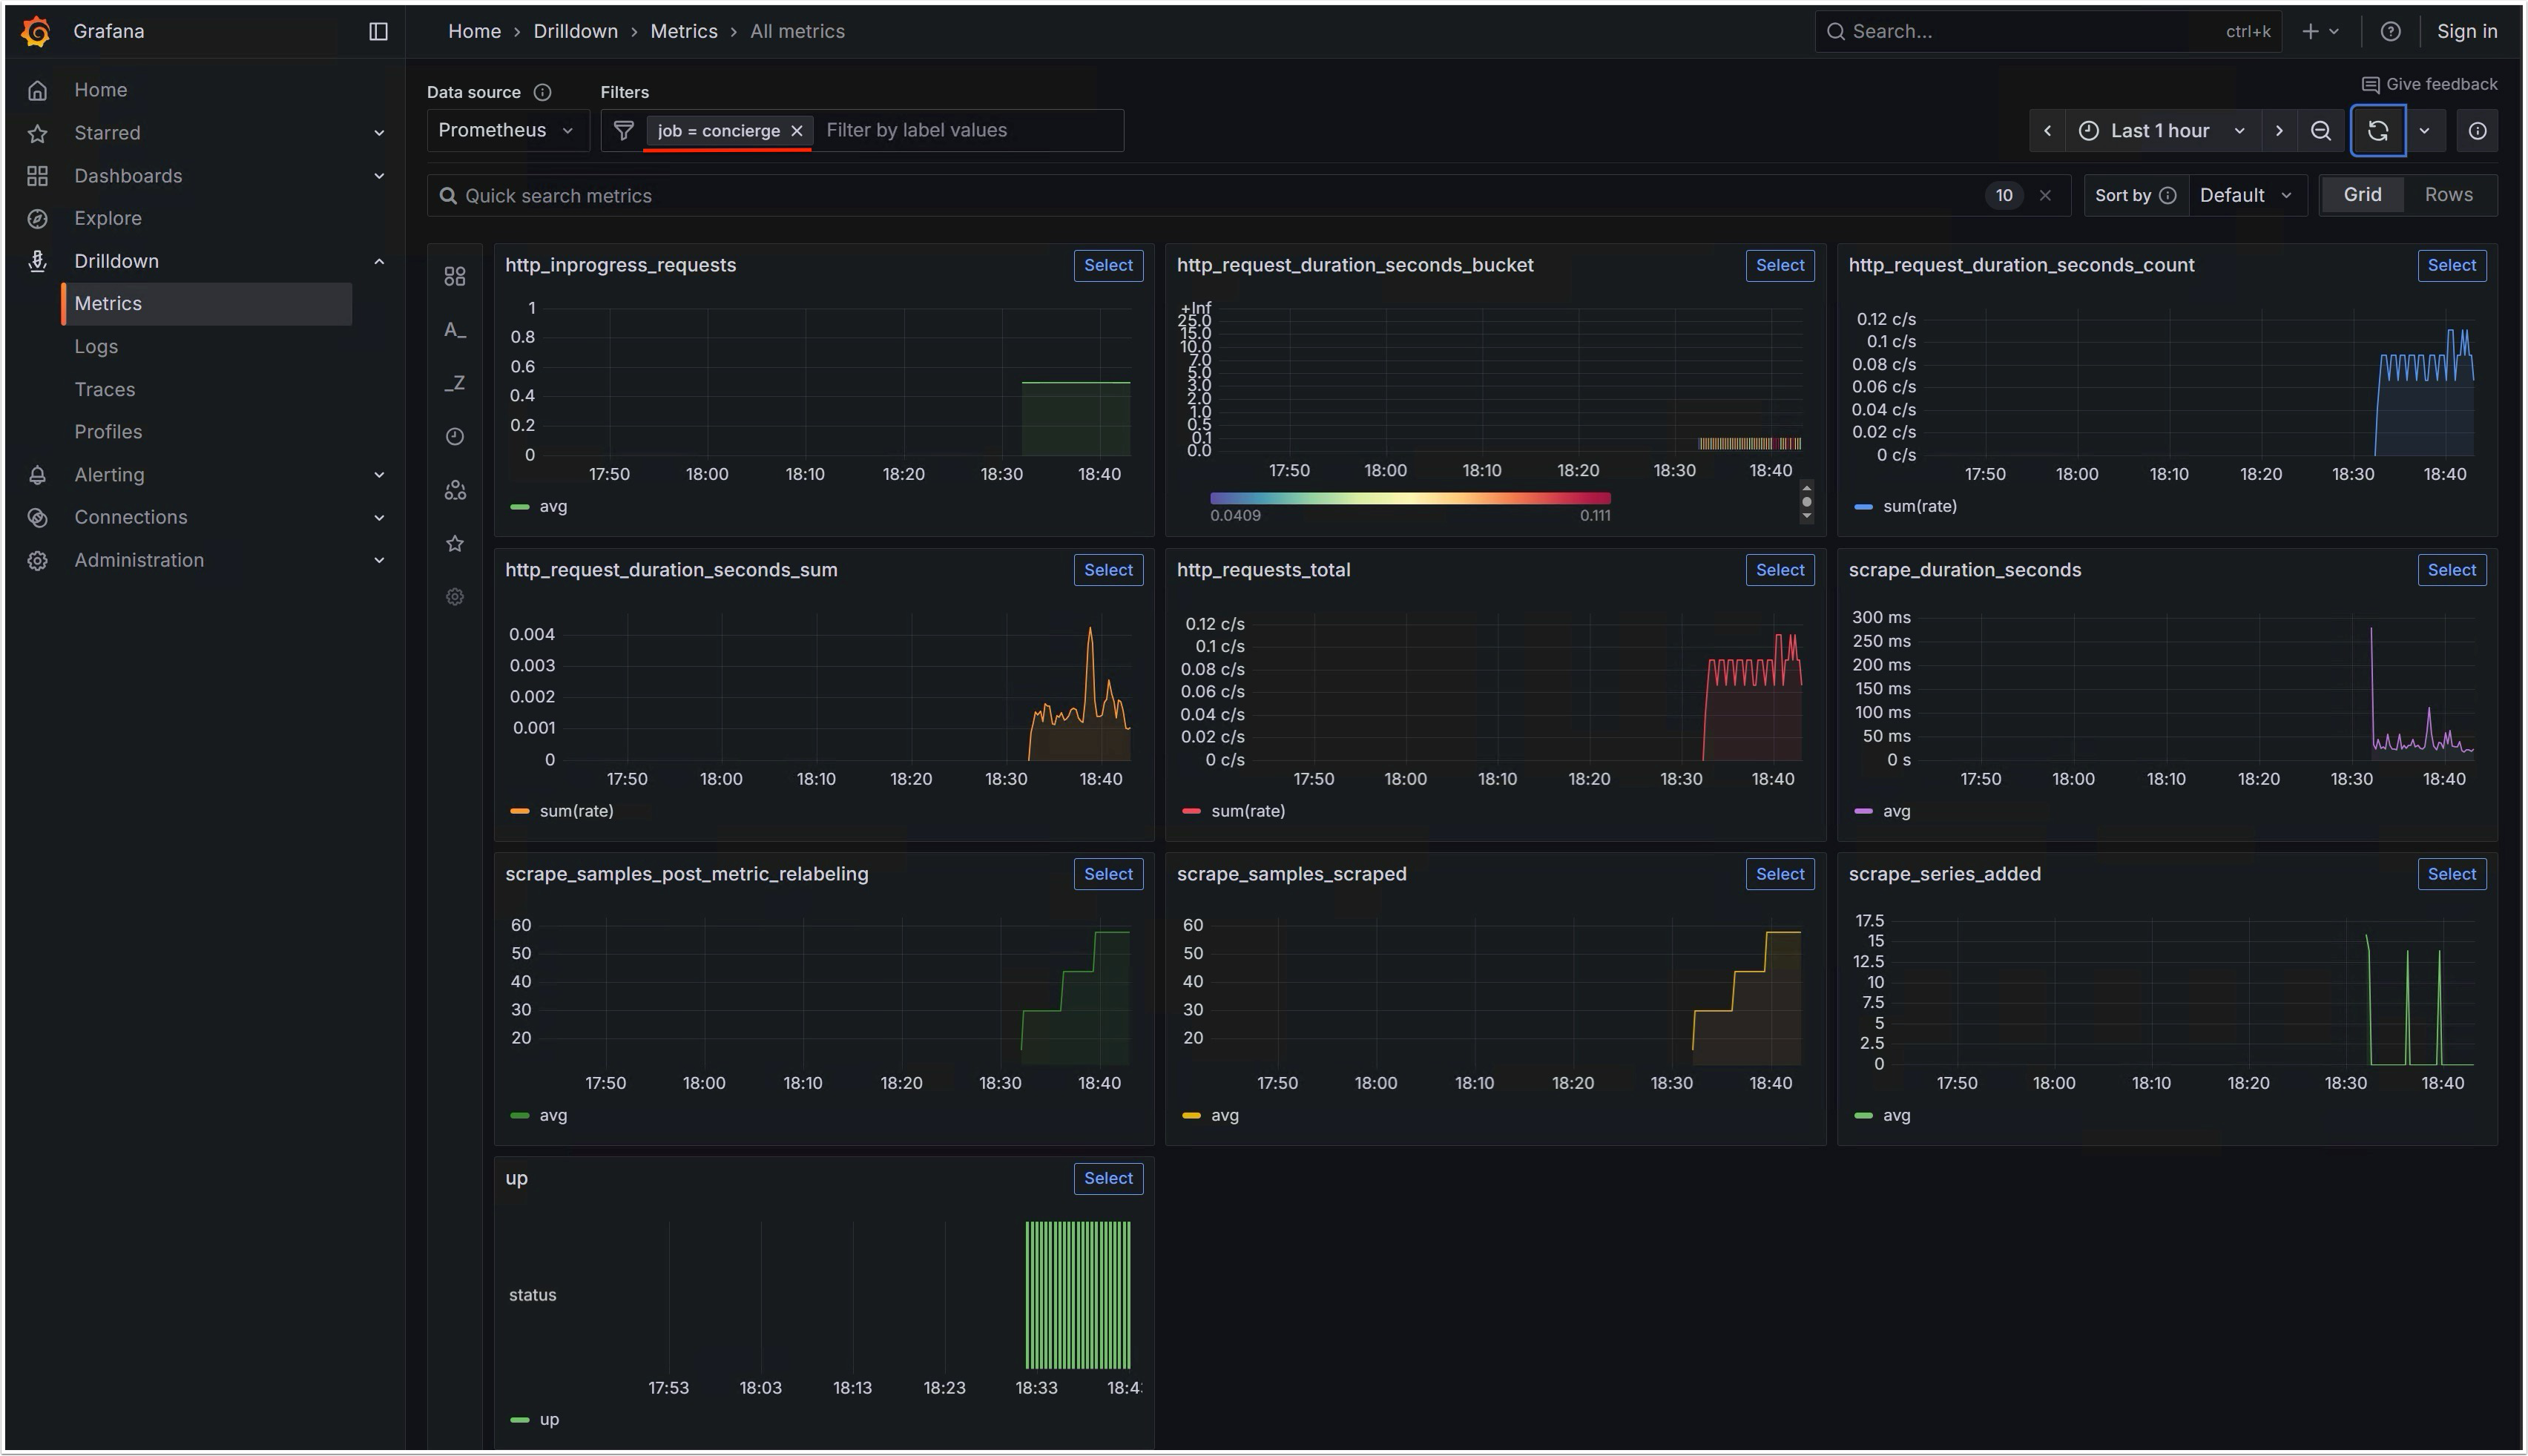
Below is an example of metrics from the Concierge service, collected by Prometheus and visualized in Grafana.