Beginning in v7.1.1, Metric Insights includes web service analytics powered by GoAccess. Reports are automatically generated every five minutes and are accessible in the MI Console. Administrators can monitor real-time user activity, traffic patterns, and performance metrics without additional setup or external tools.
Web Analytics Dashboard Overview
- For MI v7.1.2+: Access MI Console > Logs & Analytics > [Open Analytics]
- For MI prior to v7.1.2: Access the GoAccess dashboard at:
https://<MI hostname>/console/goaccess
NOTE: MI Console access is required to view the GoAccess dashboard.
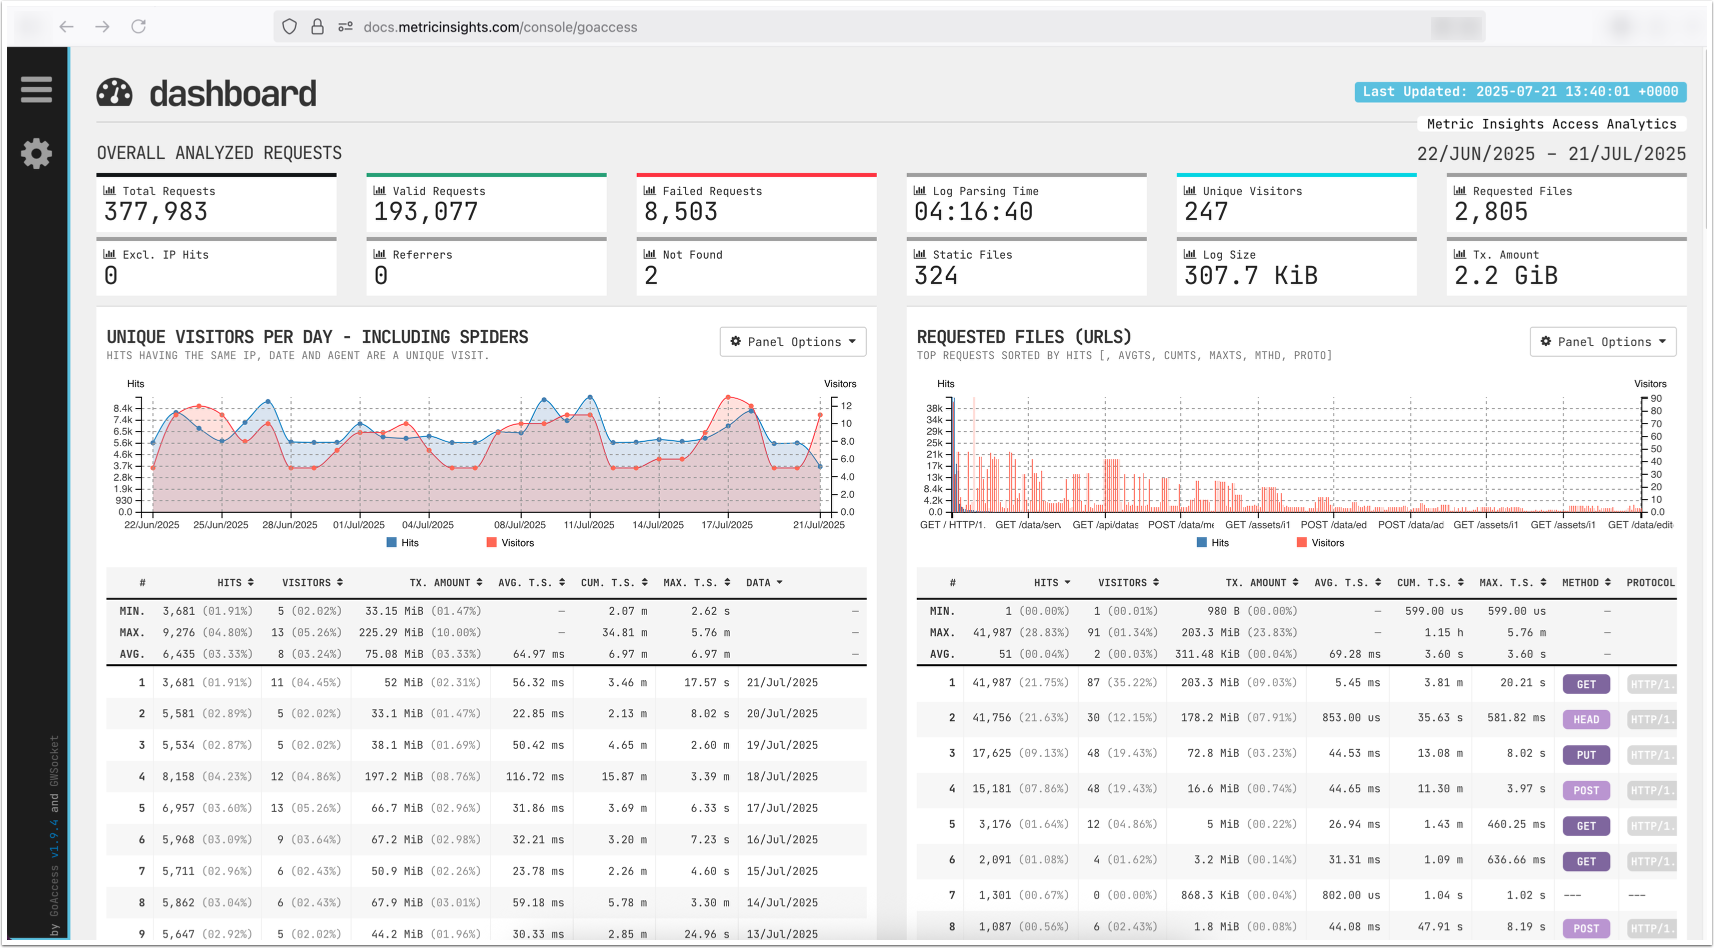
The GoAccess Web Analytics Dashboard provides real-time traffic insights to help administrators monitor usage and troubleshoot potential issues. Key metrics include:
- Traffic Overview: Track total requests, estimated unique visitors, and bandwidth usage.
- Traffic Trends: Review hourly and daily traffic patterns, updated in near real time.
- Top Content: Identify the most accessed dashboards, reports, and pages, with hit counts and percentage of total requests.
- Error and Status Monitoring: Detect spikes in 4xx/5xx errors to address broken links or server issues quickly.
- User Environment & Alerts: View browser and operating system usage, with alerts for anomalies such as high error volumes or slow requests.
NOTE: For more information on interpreting the GoAccess dashboard and advanced features, refer to the official GoAccess Manual.