This is the fourth use case in the Training by Example series. Review it after finishing the Training by Example: Use Case — Catalog, Training by Example: Use Case — Bursting and Training by Example: Use Case — Exceptions Report.
In this example, a business unit that oversees the company's Wine Sales requested to receive Reports displaying changes among sellers. Using the information from Top Sellers Report, created in the Training by Example: Exceptions Report play, the new Report has to contain:
- Products that appear in the Top Sellers Report for the first time in a current month
- Products that were on the prior Top Sellers Report, but have dropped off this month
- Products which have increased in value this month
Use the example workflow outlined below to:
- Learn how to use a CSV Dataset as an SQL Data Source
- Understand how to apply an SQL fetch statement to a Dataset
- Discover how to create a Custom View and build a Changes Report
Make sure you have completed all the following steps before beginning this Use Case:
- Created an SQL Data Source
- Created a Category
- Added a User Map
- Created a Folder
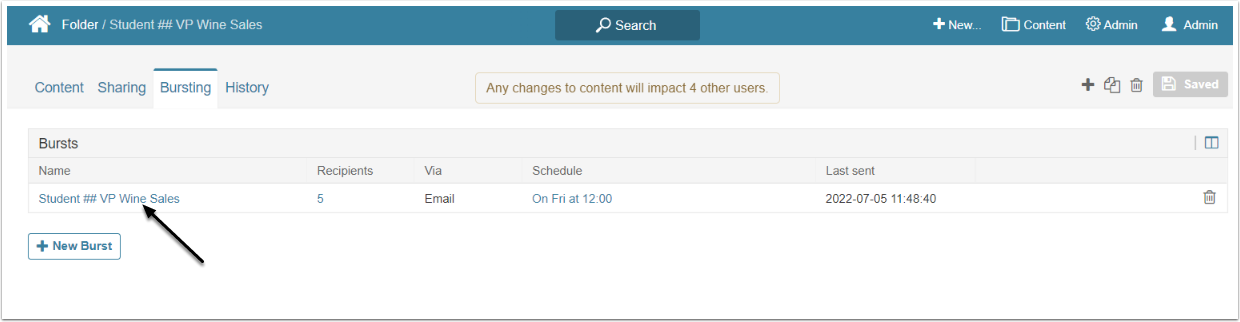
- Built a Burst
Data Collection
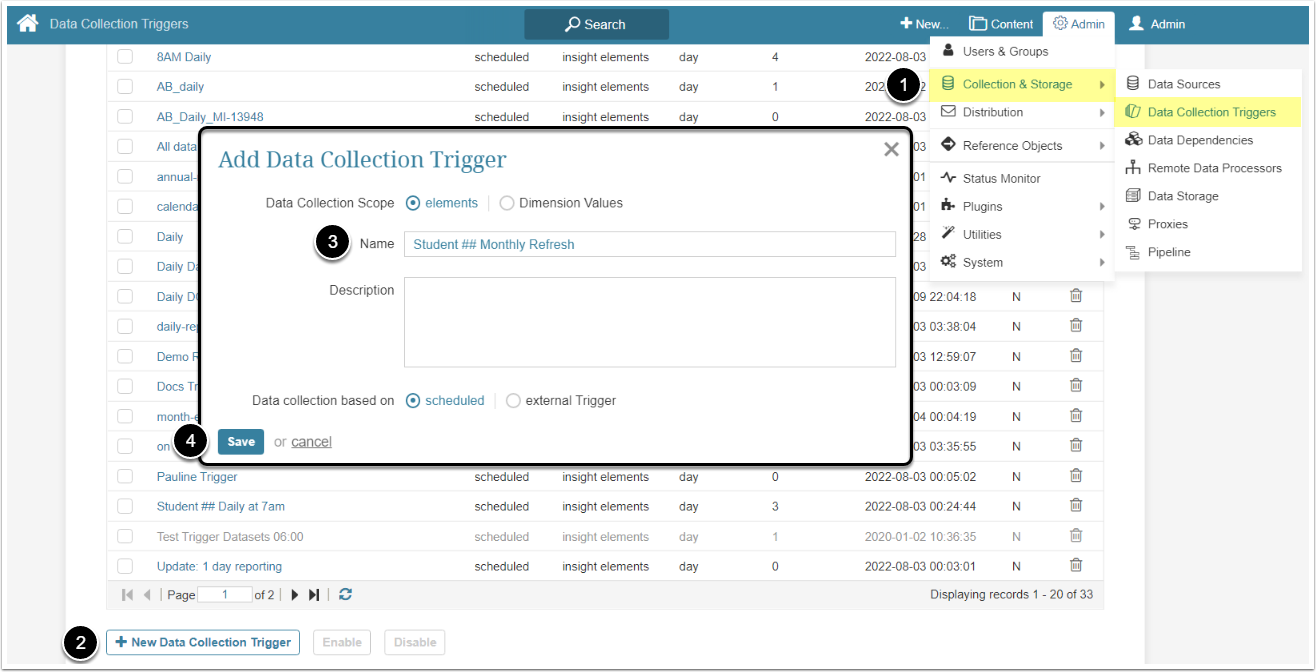
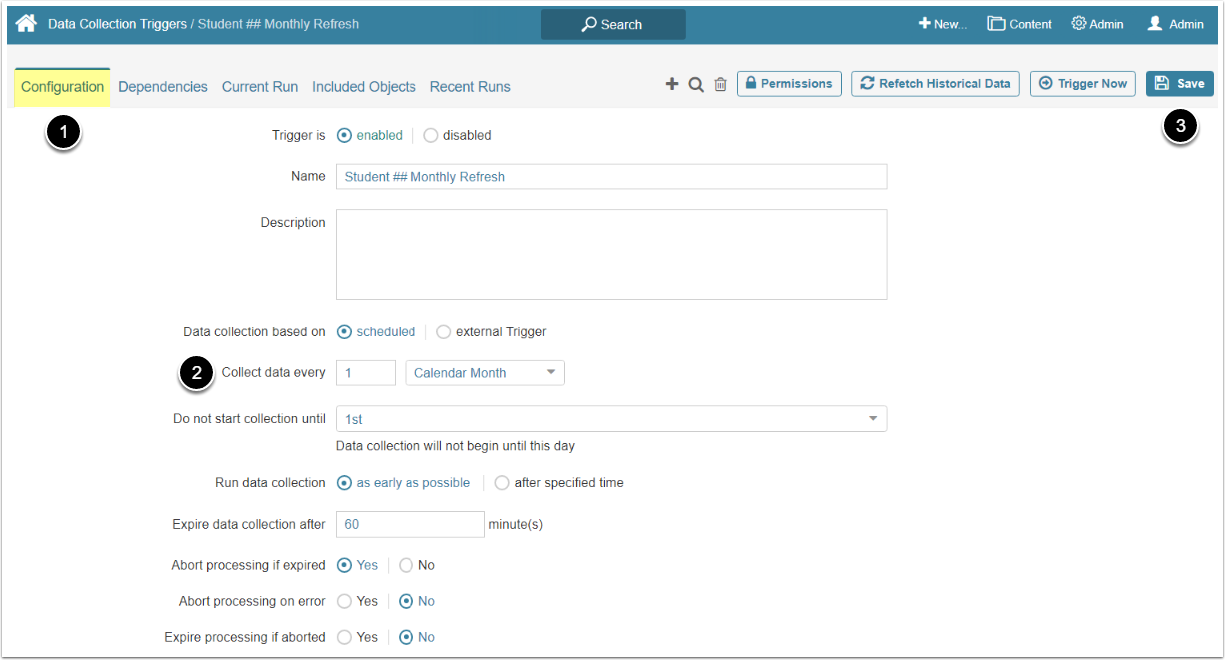
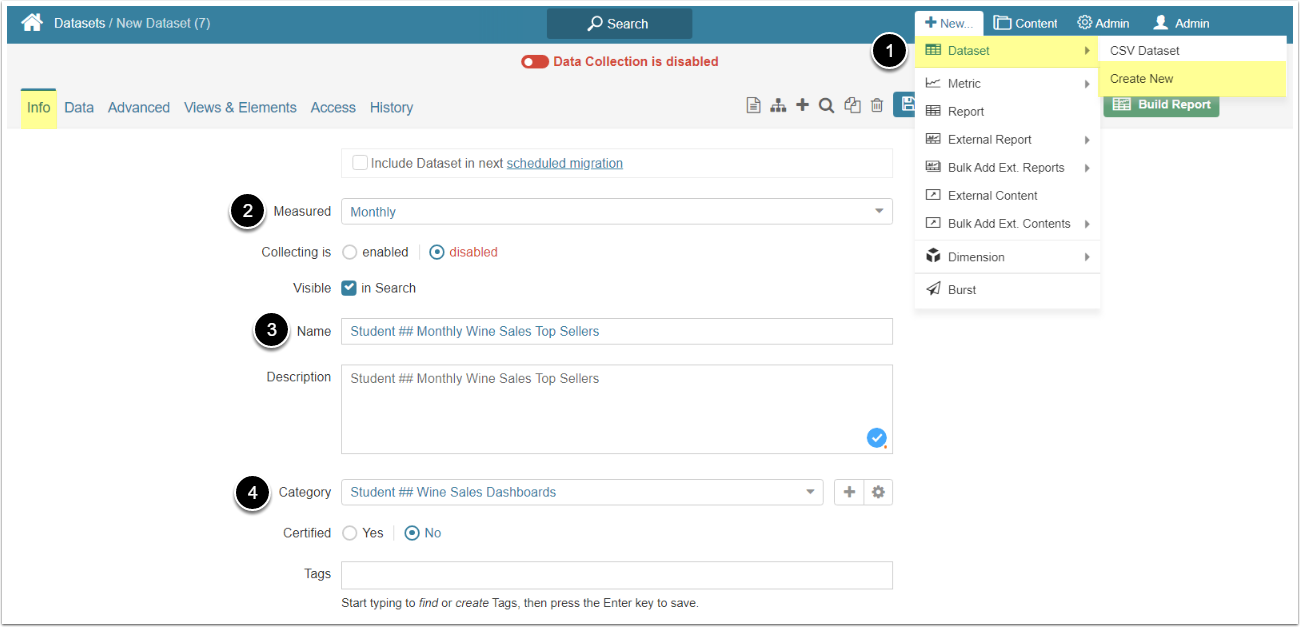
In this section you will learn how to create a Data Collection Trigger that collects data once a month.
Besides that, you will find out how to apply an SQL Statement to a Dataset. The SQL Statement can only apply to Datasets that either were created from the SQL Data Source or from the other Dataset, used as an SQL Data Source. Choose the option that is most suitable for you.
For this Use Case you will need the Trigger that updated data once a month.
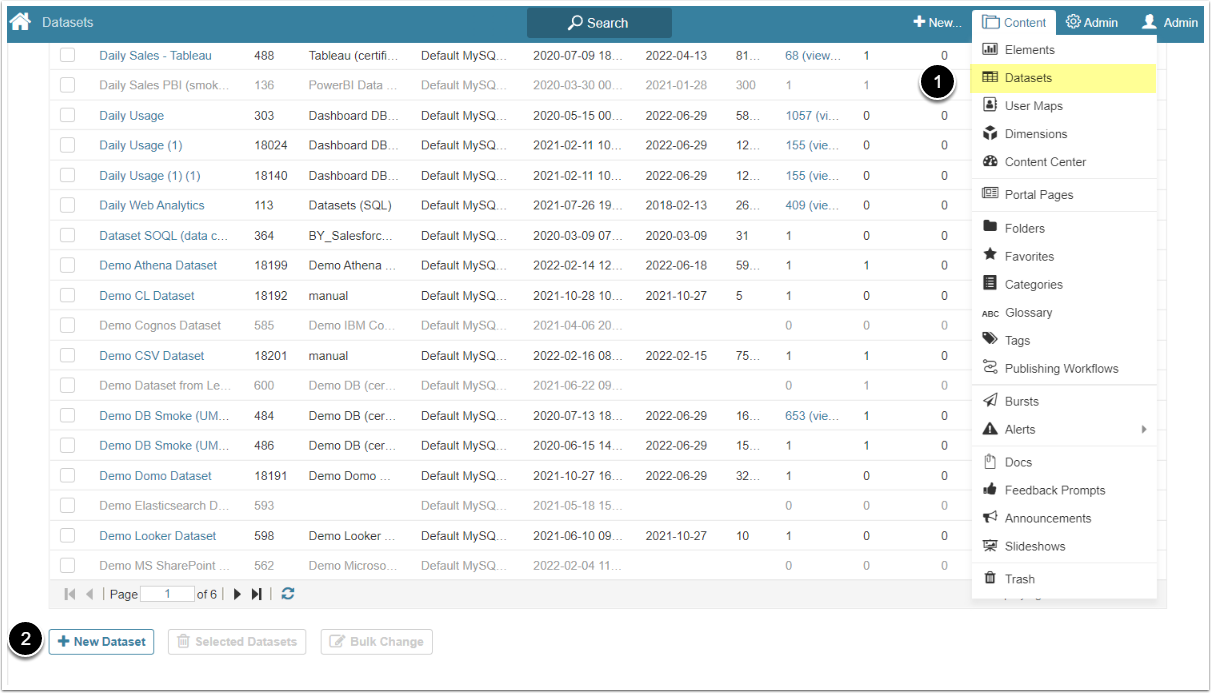
The CSV Dataset, created in the Training by Example: Exceptions Report doesn't fit for this use case, so you need to create a new one.
Download the CSV file. It contains the same data that is stored in our SQL Data Source. Use this alternative if you're unable to connect to the cloud-based Data Source.
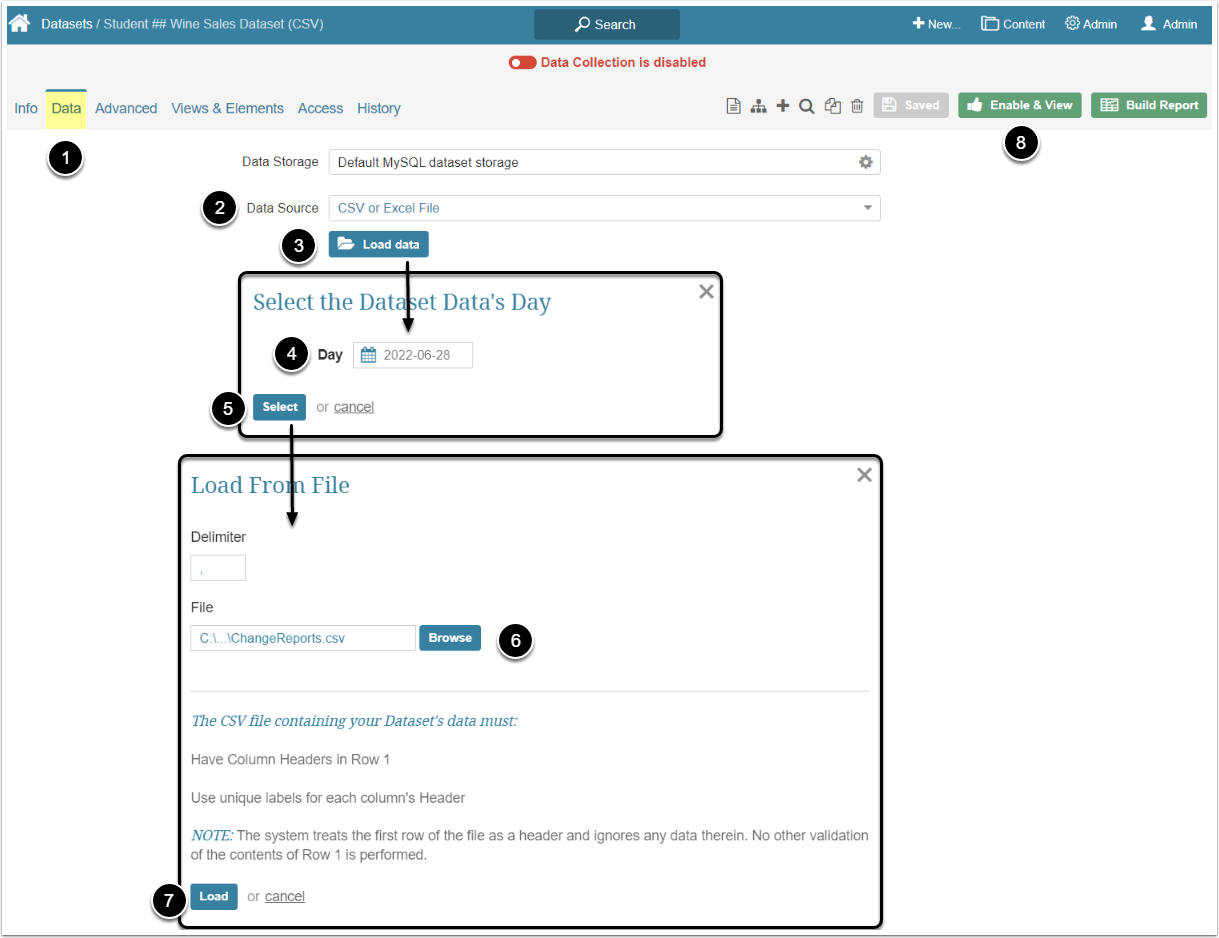
Completing theDatatab slightly varies depending on how the Data Source was created previously (in Training by Example: Exceptions Report). Perform one of them according to the Data Source method used. You need to do only one variant, not both.
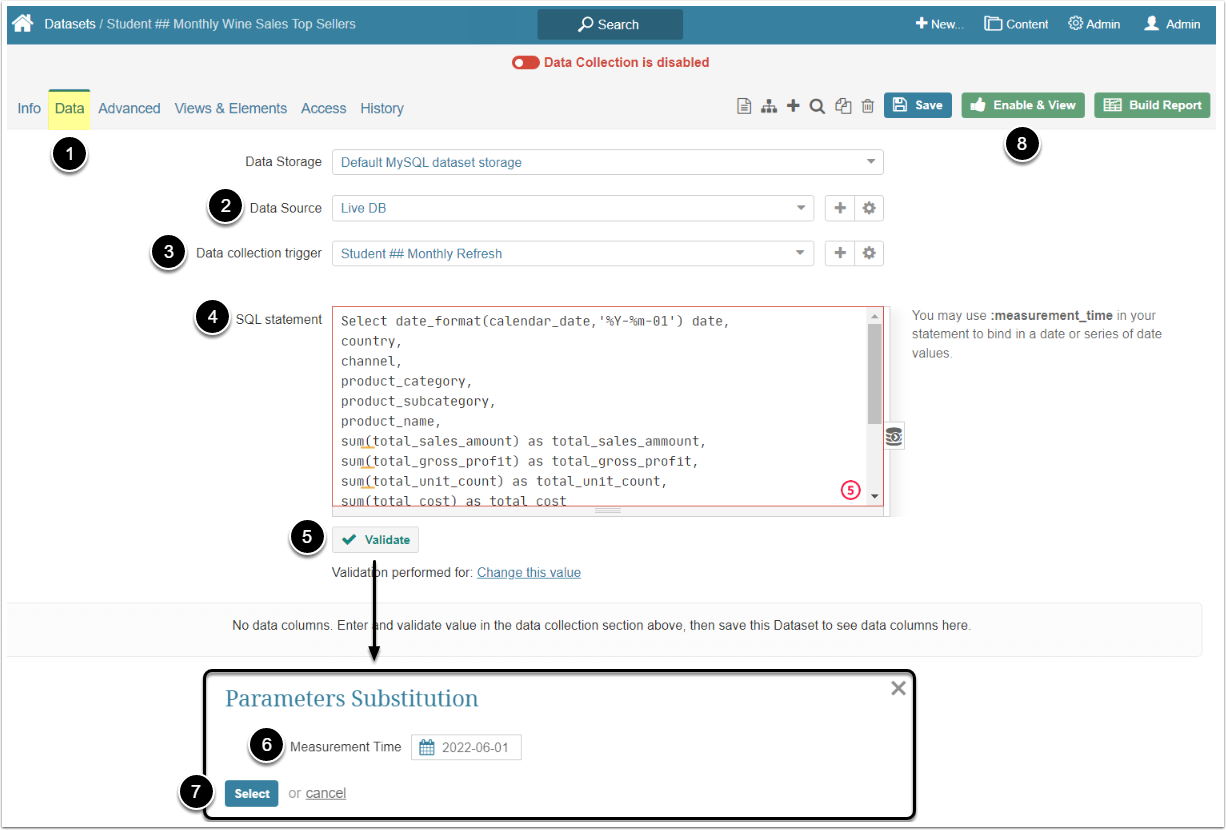
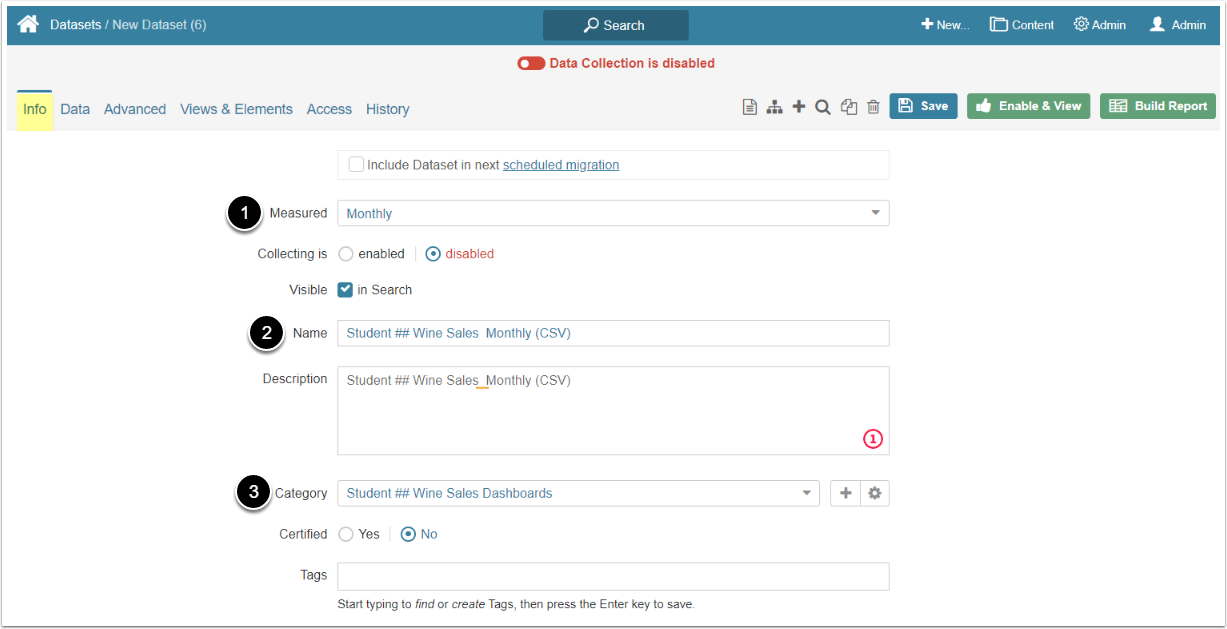
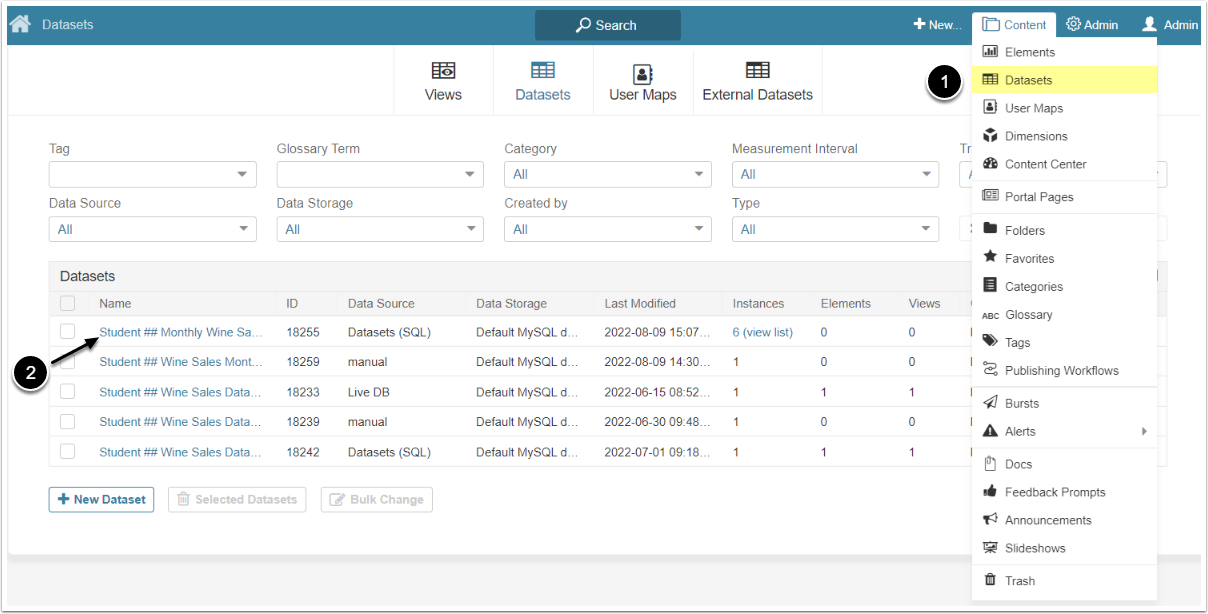
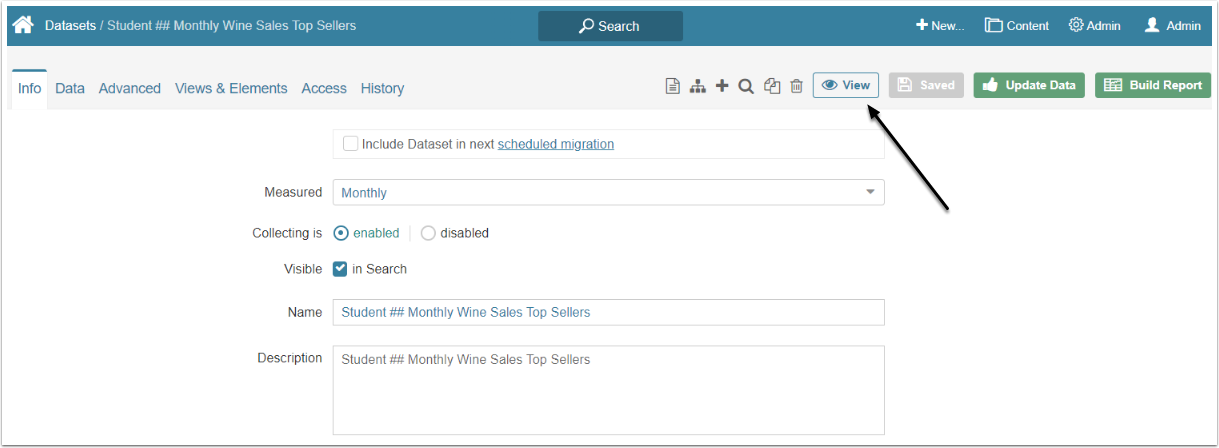
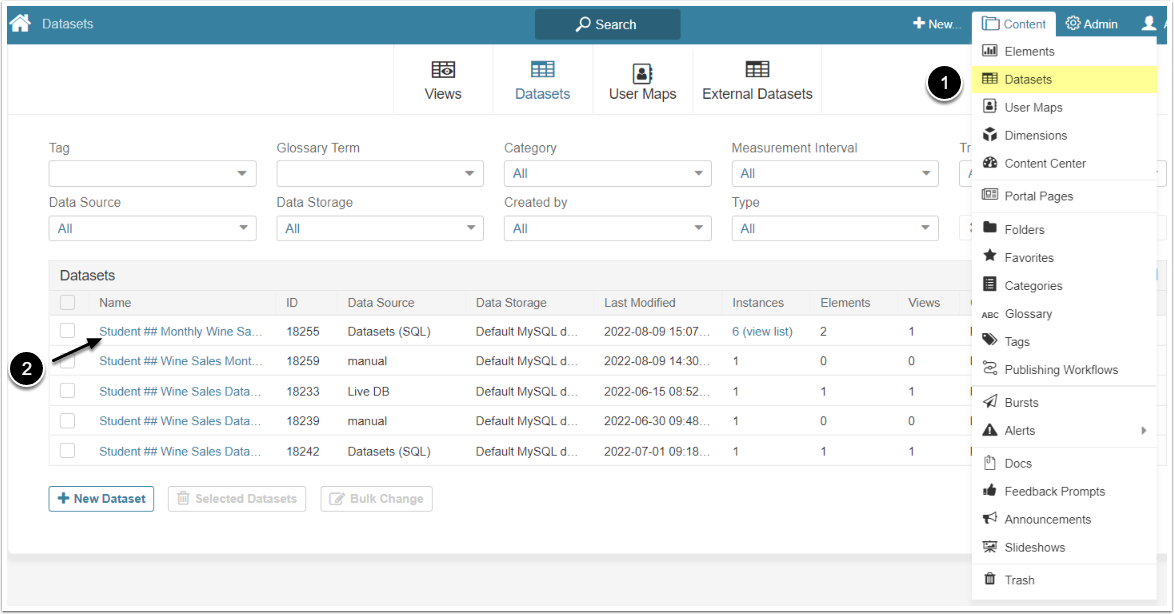
- Open theDatatab
- Data collection trigger:Select the"your name Monthly Refresh" Data Collection Trigger
- SQL statement:Enter the code below
- [Validate]
- Measurement Time: Select the 1st day of the previous month
- [Select]
Here's the code for theSQL Statementfield:
SELECT date_format(calendar_date,'%Y-%m-01') calendar_date, country, channel, product_category, product_subcategory, product_name,
SUM( total_sales_amount) AS total_sales_amount,
SUM(total_gross_profit) AS total_gross_profit,
SUM(total_unit_count) AS total_unit_count,
SUM(total_cost) AS total_cost
FROM daily_sales_summary
WHERE calendar_date =:measurement_time
GROUP BY 1,2,3,4,5,6
HAVING (`total_sales_amount`= '10000' OR `total_gross_profit`= '5000' OR `total_cost` = 0.5*`total_sales_amount`)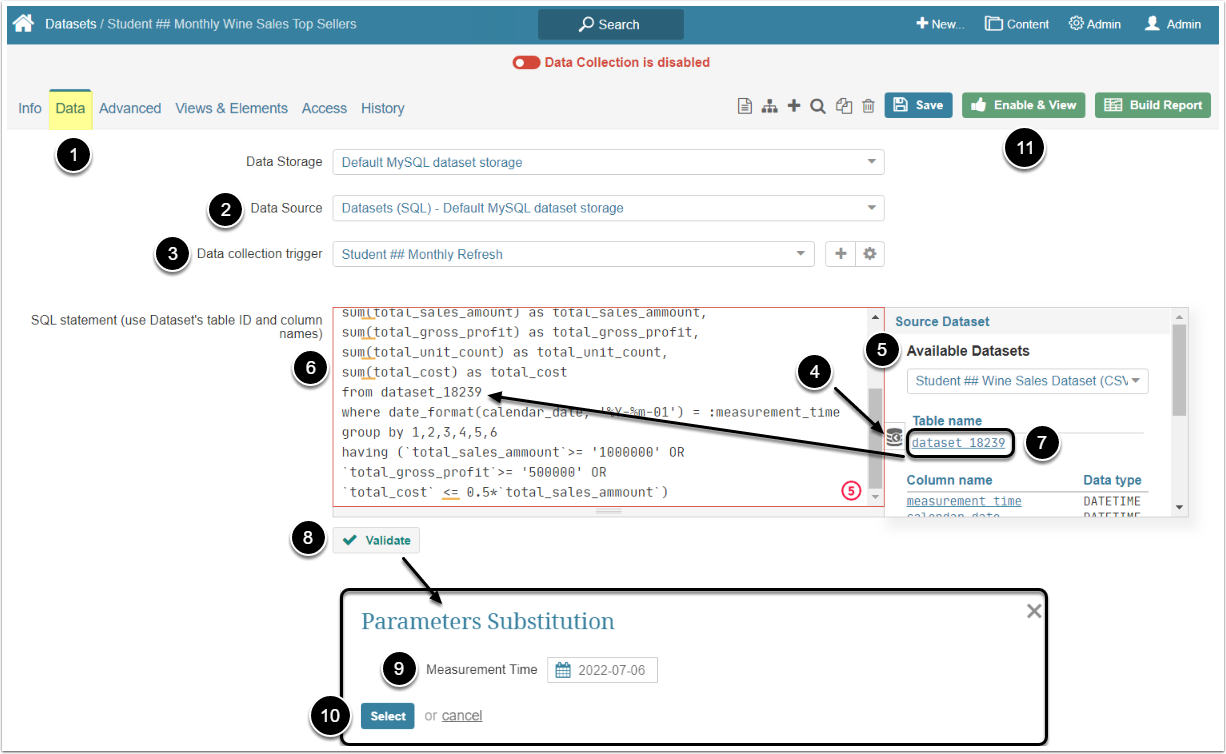
- Open the Data tab
- Data Source: Select the "Datasets (SQL) - Default MySQL" option
- Data collection trigger: Choose the"your name Monthly Refresh"Trigger
- ClickSource of Reportsbutton
- Available Datasets: Select the "your name Wine Sales Dataset" CSV Dataset you created
- SQL statement:Enter the code below
- In the code, replace the table name after the SQL "FROM" clause with theTable nameof the CSV Dataset
- [Validate]
- Measurement Time: Select a date in the past
- [Select]
Here's the code for theSQL Statementfield:
SELECT date_format(calendar_date,'%Y-%m-01') calendar_date, country, channel, product_category, product_subcategory, product_name,
SUM( total_sales_amount) AS total_sales_amount,
SUM(total_gross_profit) AS total_gross_profit,
SUM(total_unit_count) AS total_unit_count,
SUM(total_cost) AS total_cost
FROM dataset_18259
WHERE date_format(calendar_date, '%Y-%m-01') = date(:measurement_time)
GROUP BY 1,2,3,4,5,6
HAVING (`total_sales_amount`= '1000000' OR `total_gross_profit`= '500000' OR `total_cost` = 0.5*`total_sales_amount`)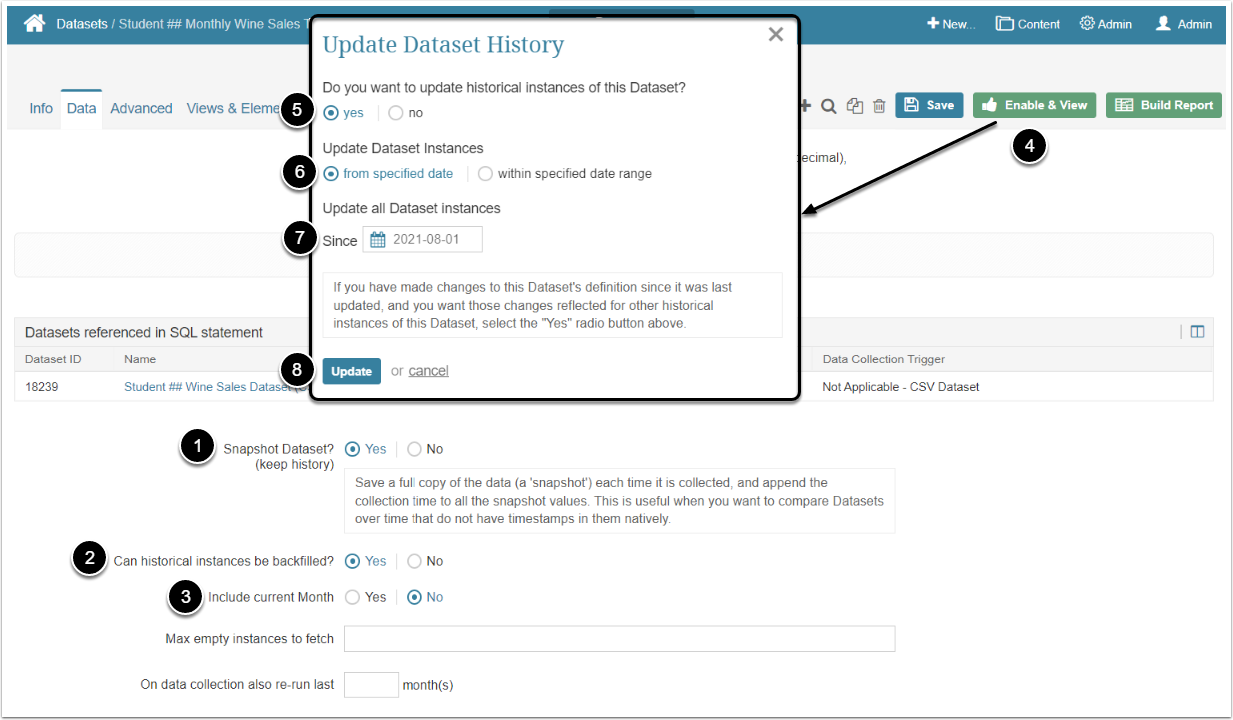
- Snapshot Dataset: Select "Yes"
- Can historical instances be backfilled: Choose "Yes"
- Include current Month: Select "No"
- [Enable & View]
- Do you want to update historical instances of Dataset: Choose "Yes"
- Update Dataset Instances: Select "from specified date"
- Update all Dataset Instances Since: Choose the date that will cover last 12 month
- [Update]
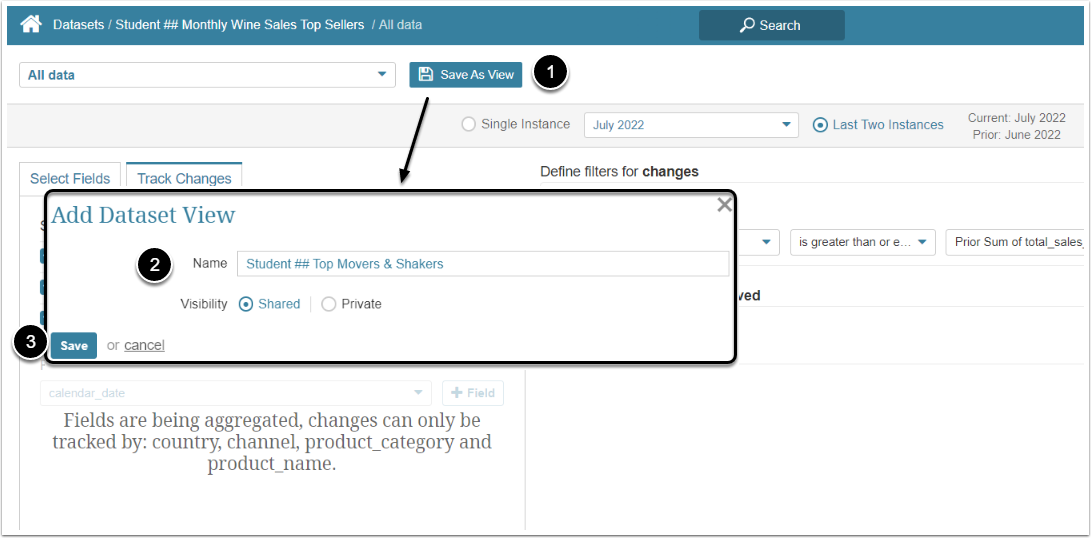
Datasets are designed to serve as a source of data for new Elements such as Metrics and Reports. By creating a Dataset View you can save customized filters and rules which generate specific valuable data. The View can be used to create a table of data displayed in an Internal Report.
In this section you will learn how to create a custom View that highlights changes appearing between the data collections in the Dataset Viewer and build a Report from that View.
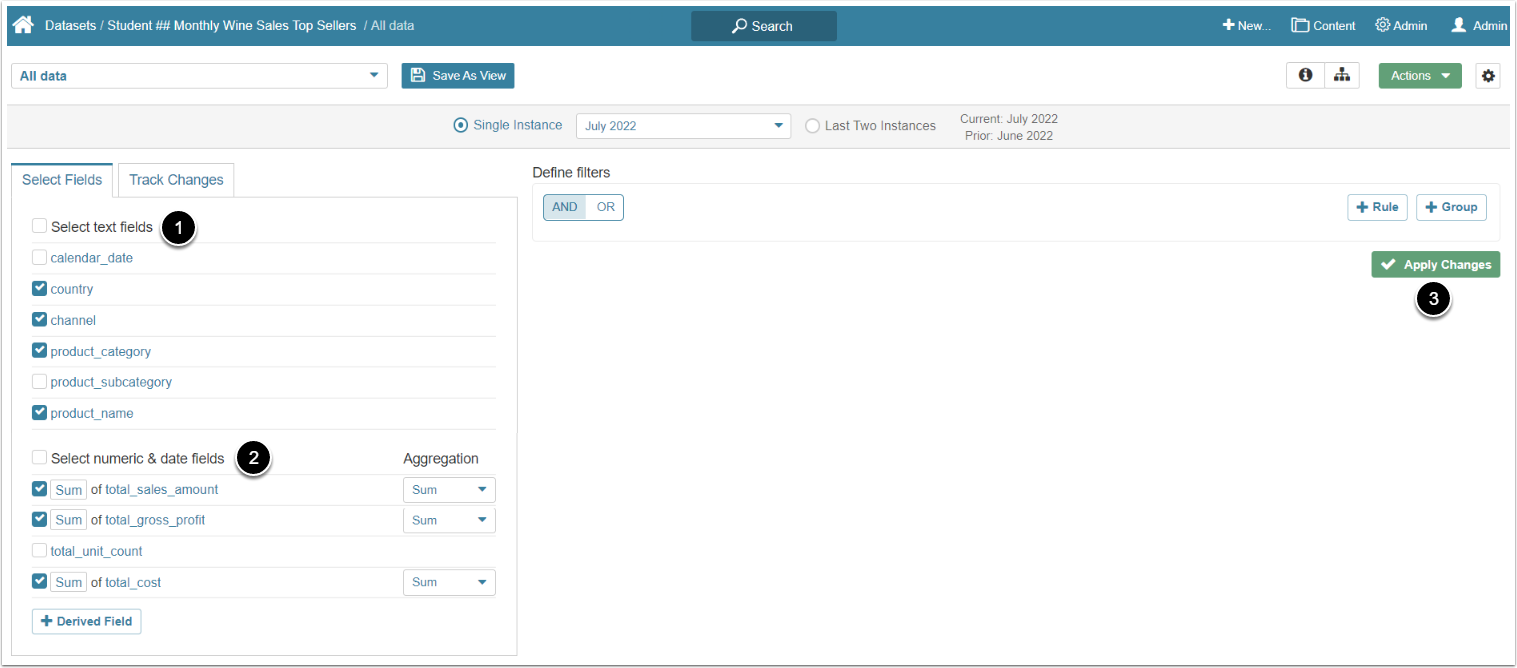
- Select the following text fields:
- country
- channel
- product_category
- product_name
- Select the following numeric & date fields:
- Total Sales Amount: Select "Sum" option in theAggregationcolumn
- Total Gross Profit: Select "Sum" option in theAggregationcolumn
- Total Cost: Select "Sum" option in theAggregationcolumn
- [Apply Changes]
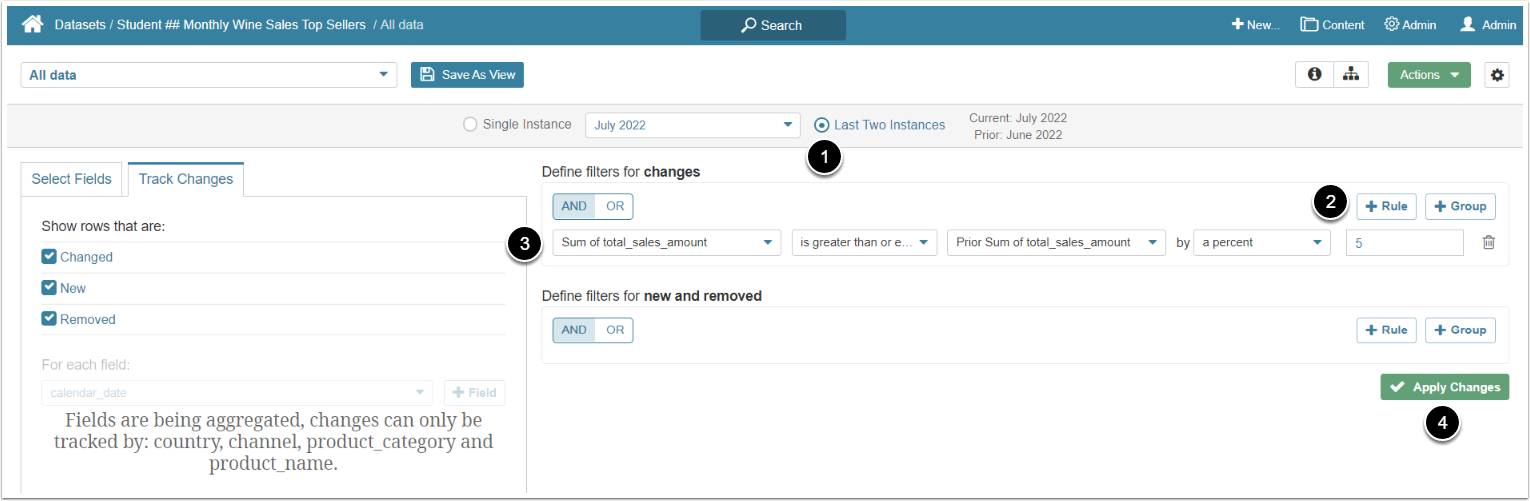
- Select Last Two Instances radio button
- [+ Rule]
- Define the filter Rules:
- "Sum of total_sales_amount" + "is greater than or equal to" + "Prior Sum of total_sales_amount" + "by percent" + "5"
- For more details refer to theCreate a Dataset Viewarticle
- [Apply Changes]
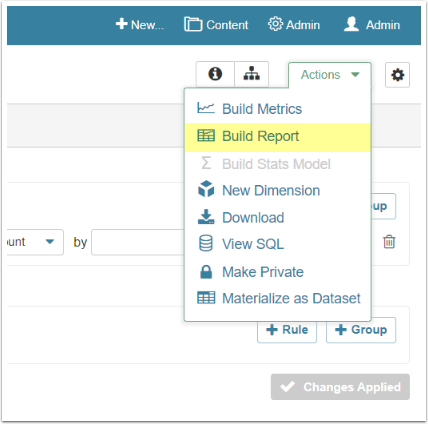
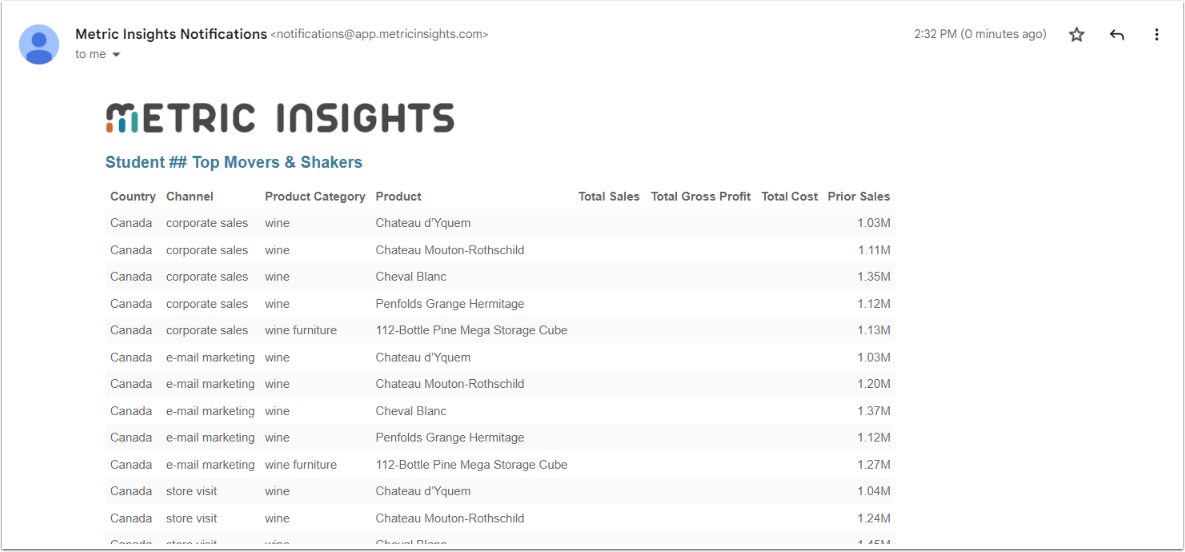
Reports display the custom View of the Dataset. In the Dataset Viewer you created a custom View that surfaces data changes.In this example, we'll build an Element tile for a Report. That Report can be shown on the Homepage and added to Bursts. For more information, refer toDataset Reports Overview.
In this section you will learn to build Changes Reports.
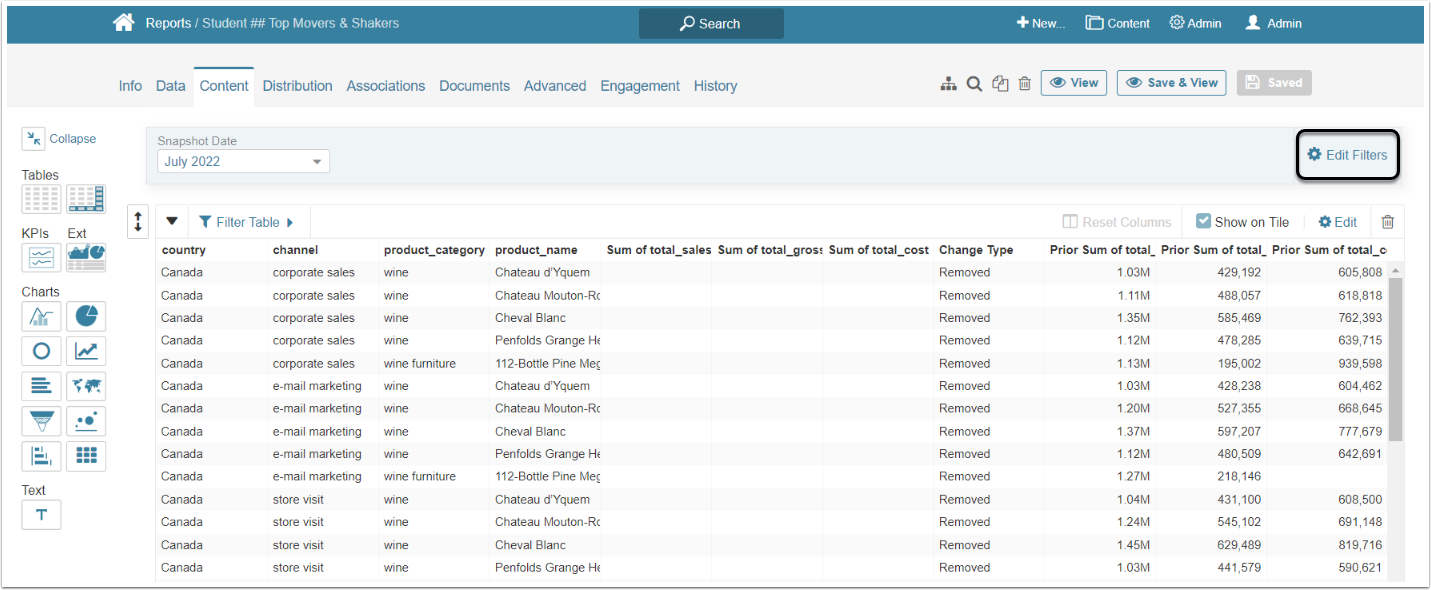
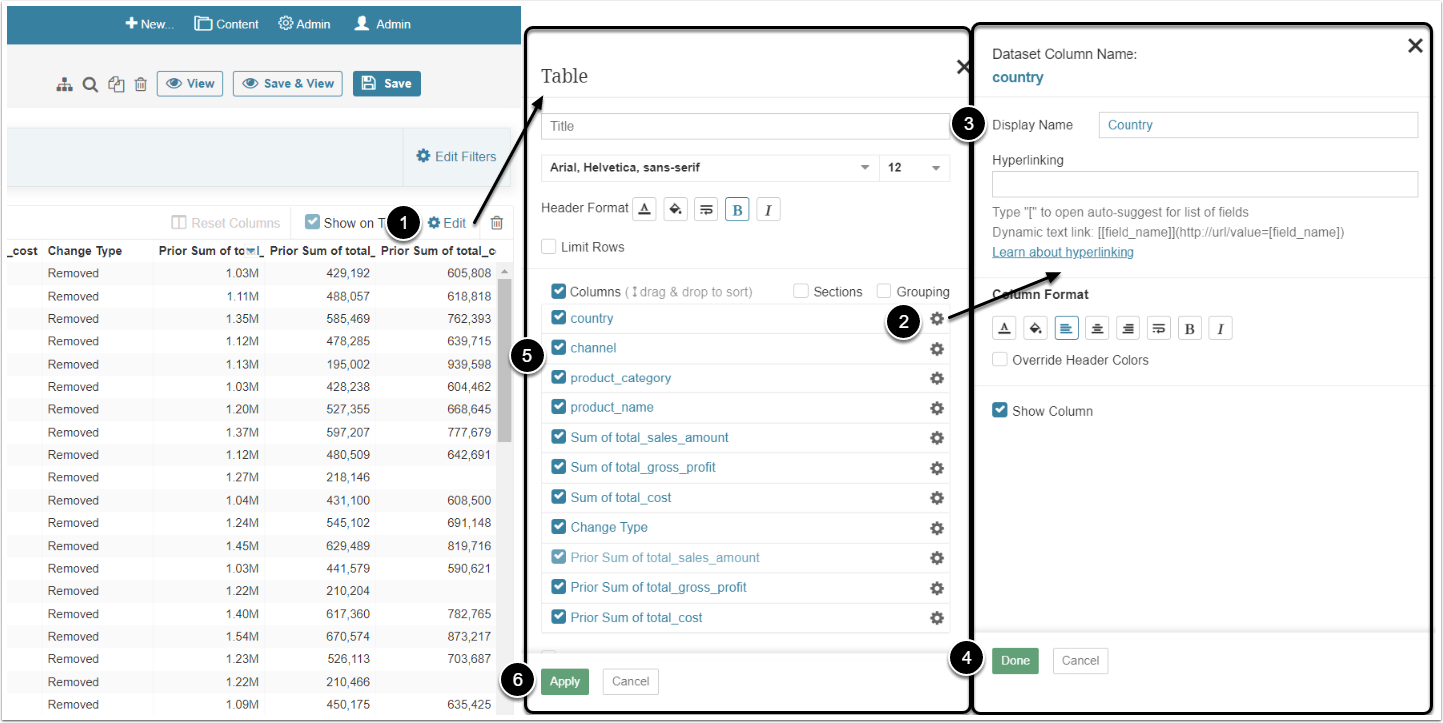
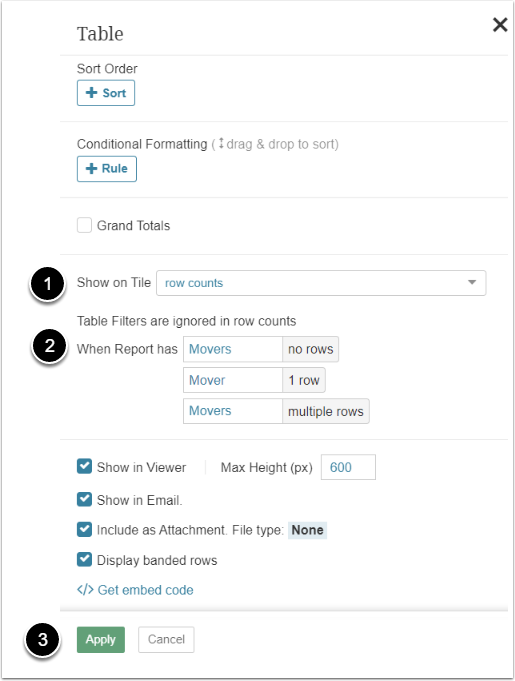
- ClickEdit
- Click the gear icon in the "country" row
- Display Name: Capitalize the column name "country" to "Country"
- [Done]
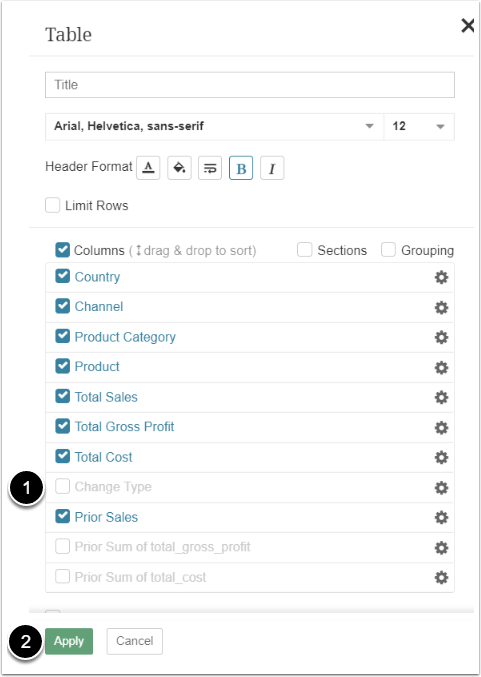
- Replace the names of other columns:
- "channel" to "Channel"
- "product_category" to "Product Category"
- "product_name" to "Product"
- "Sum of total_sales_amount" to "Total Sales"
- "Sum of total_gross_profit" to "Total Gross Profit"
- "Prior Sum of total_sales_amount" to "Prior Sales"
- "Sum of total_cost" to "Total Cost"
- [Apply]
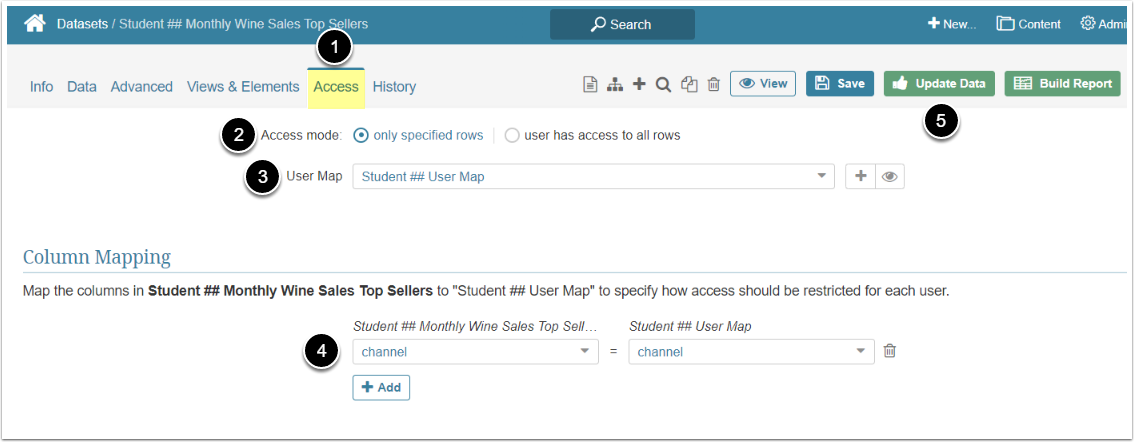
Access Control
In this section you restrict the Users access to the Dataset data by applying a User Map to it. This way you control what a specific user sees when opening both the Dataset and any reports. For additional information refer toCreate a User Maparticle.
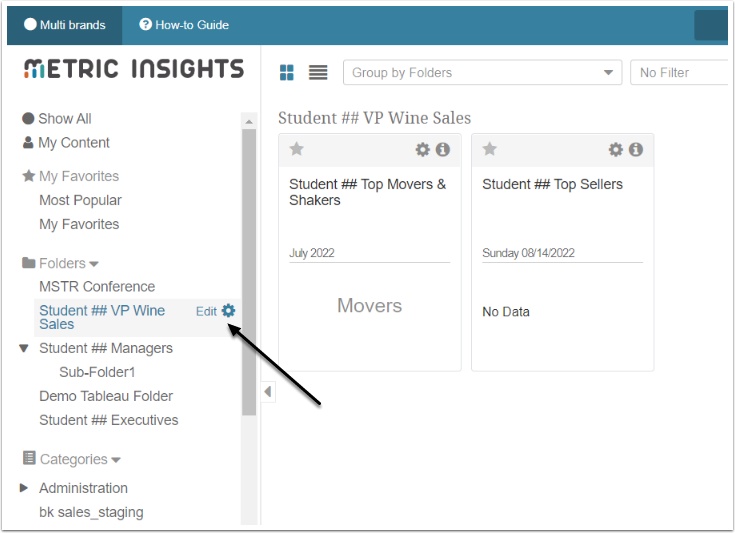
In this section you will add the Report to the Burst so the sent email includes it.
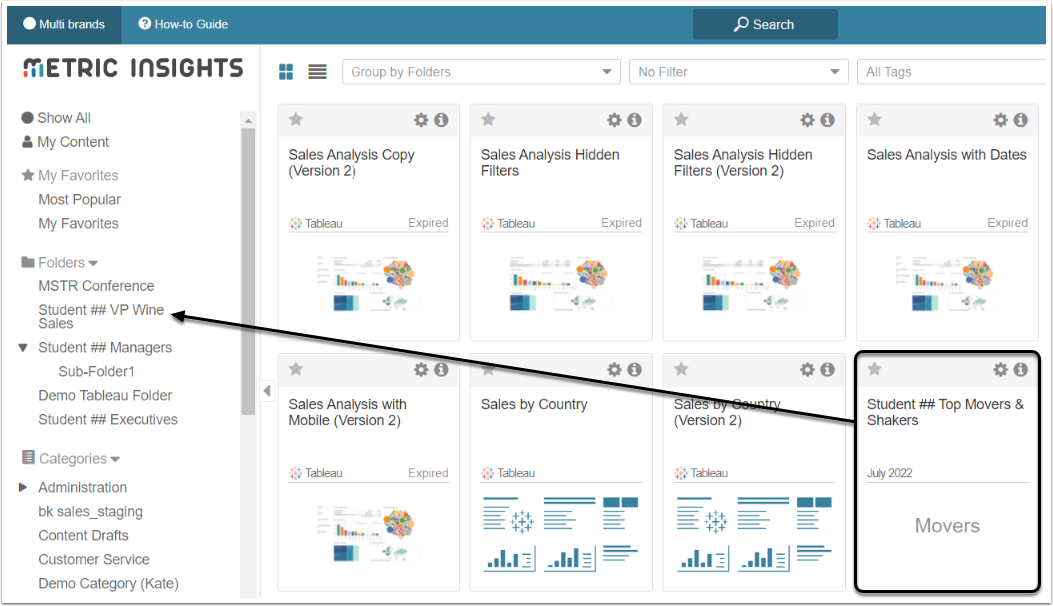
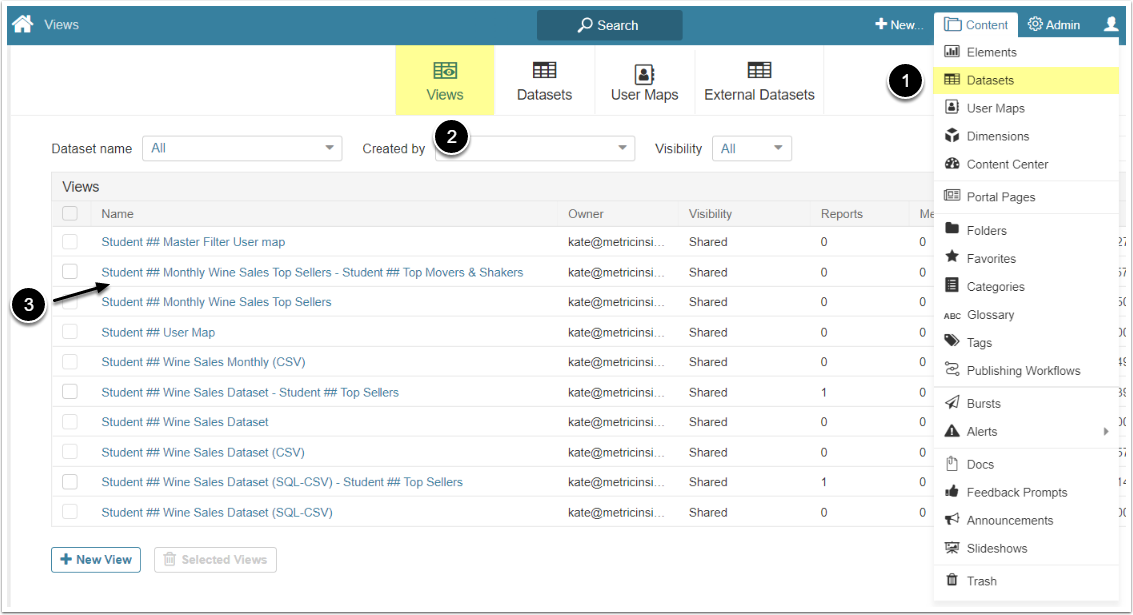
Drag-and-drop the "<your name> Top Movers & Shakers" External Report tile to the "<your name> VP Wine Sales" Folder you created.
You won't be able to see data on the tile if your Username is not included in the User Map applied to the Dataset. You will still be able to see data in the Dataset and Report Editors.
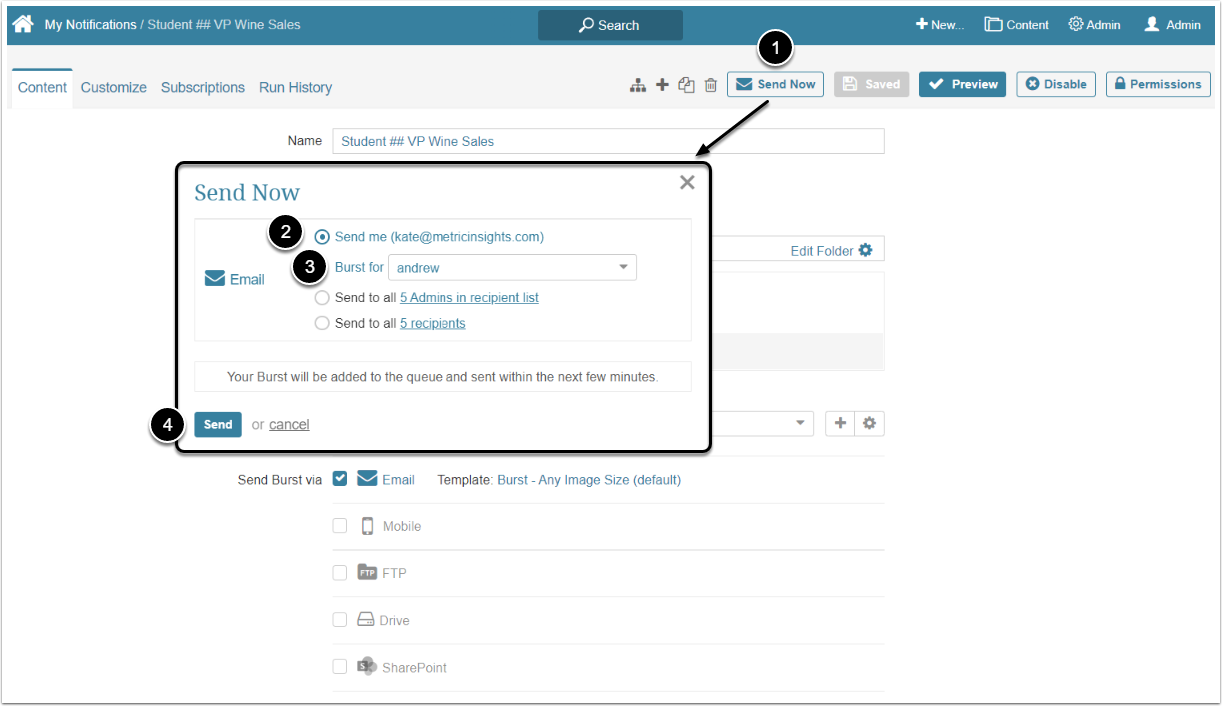
The following steps are available to Admins only.
Congratulations! You finished the workflow!