This is the third use case in the Training by Example series. Review it after finishing the Training by Example: Use Case — Catalog and Training by Example: Use Case — Bursting.
In this example, a request has been received from a business unit that oversees the company's Wine Sales. Users require a Top Sellers Report added as both a catalog tile and distributed via a Burst. The Report has to be visually compelling and detail the following exceptions if they exist:
- List any products that report greater than 5M in sales, or
- Products that report greater than 2M in profits, or
- Products that report total costs less than total sales by 50% over the last 90 days.
Use the example workflow outlined below to:
- Learn how to create an SQL Data Source or use a CSV Dataset as an SQL Data Source
- Understand how to apply an SQL fetch statement to a Dataset
- Discover how to create a Custom View and build an Exceptions Report
Make sure you have completed all the following steps before beginning this Use Case:
- Created a Category
- Added a Data Collection Trigger
- Built an External Report
- Created a Folder
- Built a Burst
Data Collection
In this Use Case you will learn how to apply an SQL Statement to a Dataset. The SQL Statement can only apply to Datasets that either were created from the SQL Data Source or from the other Dataset, used as an SQL Data Source. Choose the option that is most suitable for you.
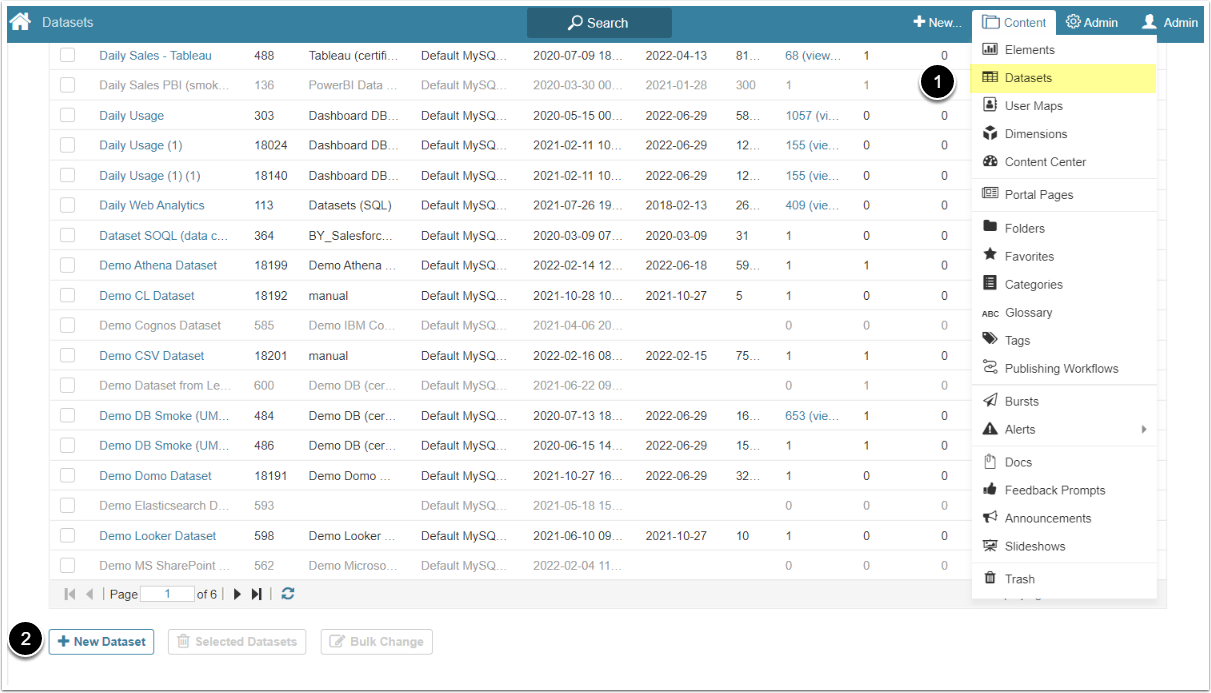
After setting a Data Source, you will also create a Dataset and build an SQL Fetch Statement in it.
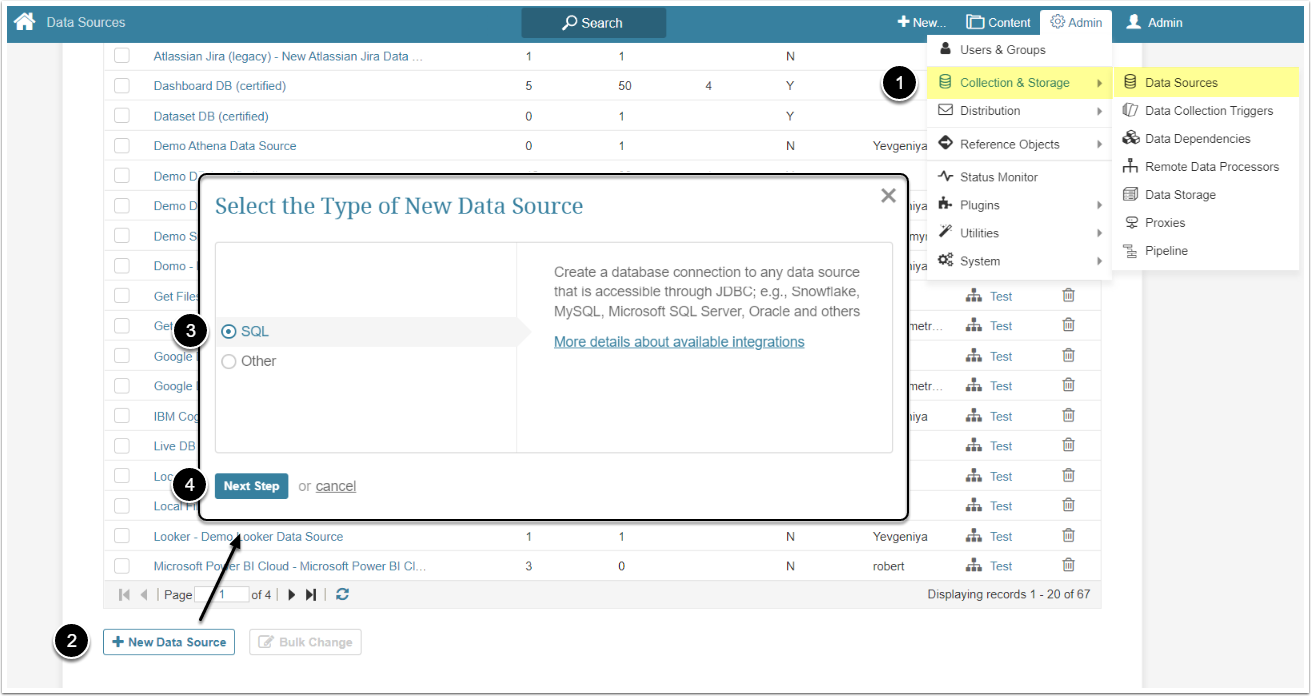
Follow the steps described in the Create an SQL Data Source section if your company's security policy allows you to connect to an external cloud-based Data Source. Use the Create a CSV Dataset alternative if you're unable to connect to the cloud-based Data Source. You need only complete one or the other, not both.
For the purposes of training there is a publicly accessible SQL Data Source.
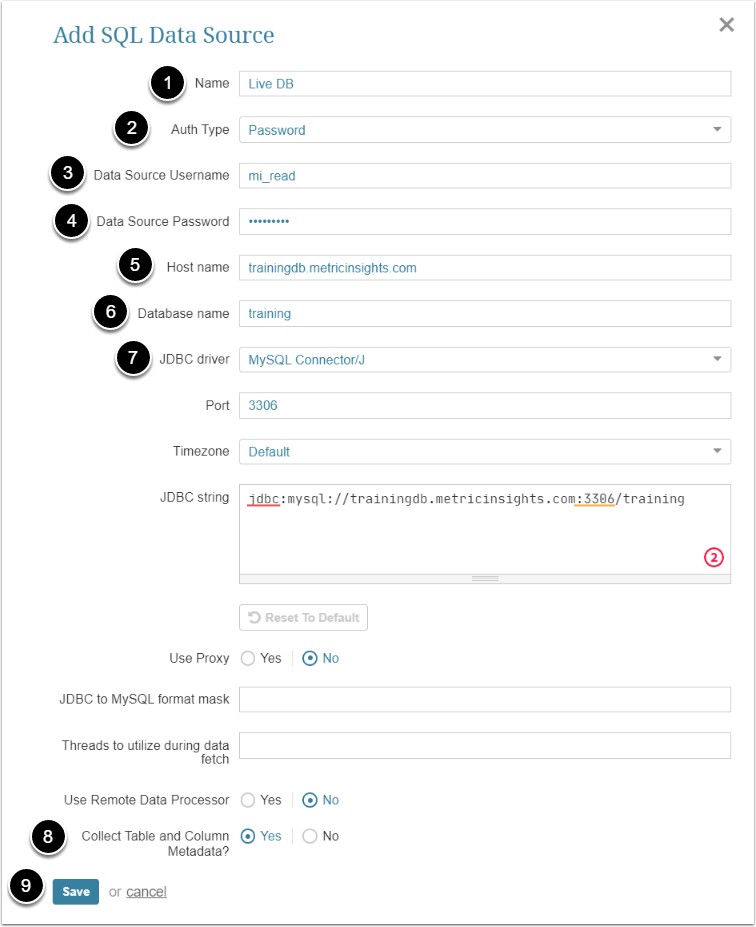
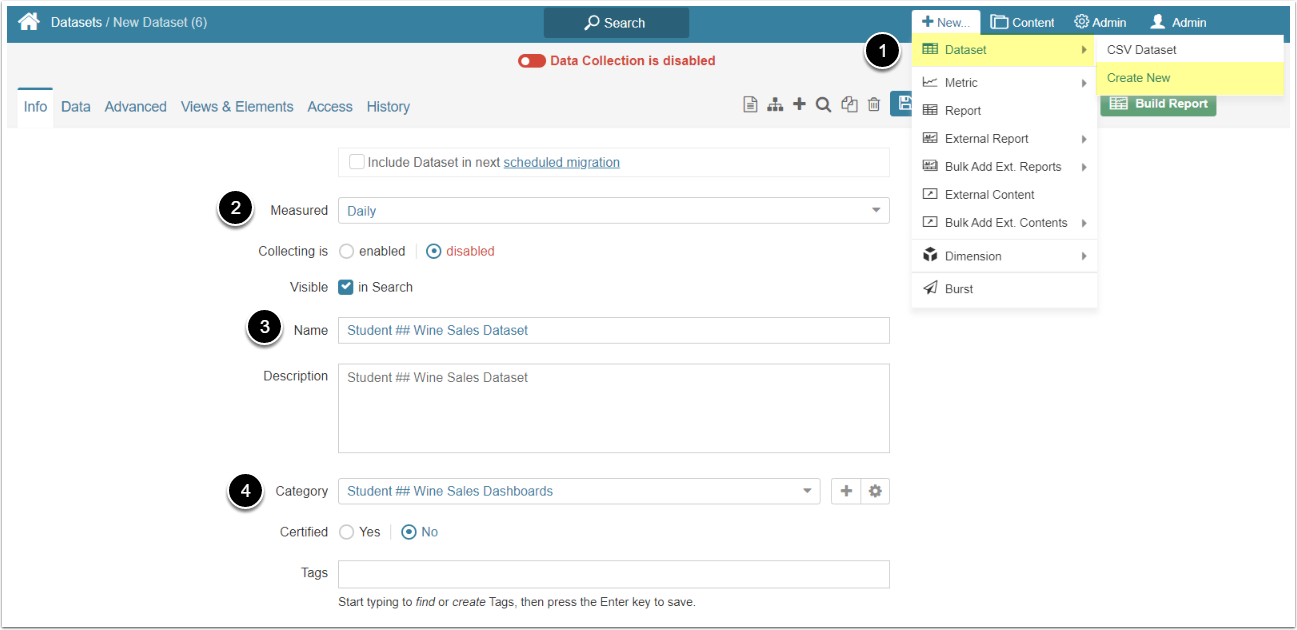
- Name: Provide a descriptive name for the Data Source
- Auth Type: Select "Password" option
- Data Source Username: Use the "mi_read" username
- Data Source Password: Insert the "zxz6rxe0YXN1nfa!fzk" password
- Host name: Enter "trainingdb.metricinsights.com" as host name
- Database name: Insert "training"
- JDBC string: Select the "MySQL Connector/J" option
- Collect Table and Column Metadata: Select "Yes"
- [Save]
Download the CSV file. It contains the same data that is stored in our SQL Data Source. Use this alternative if you're unable to connect to the cloud-based Data Source as described above.
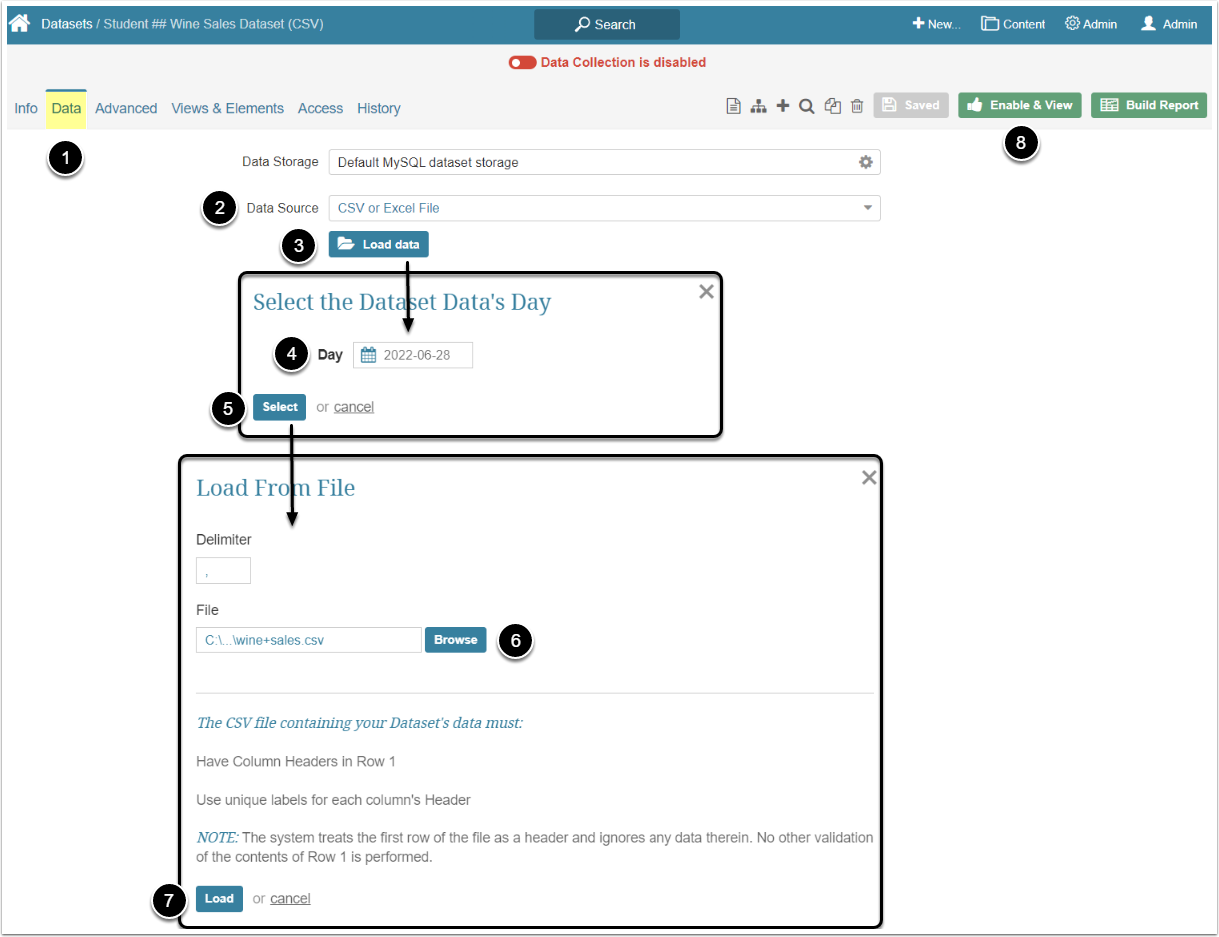
Completing the Data tab slightly varies depending on how the Data Source was created in Step 1. Perform one of them according to the Data Source method used above.
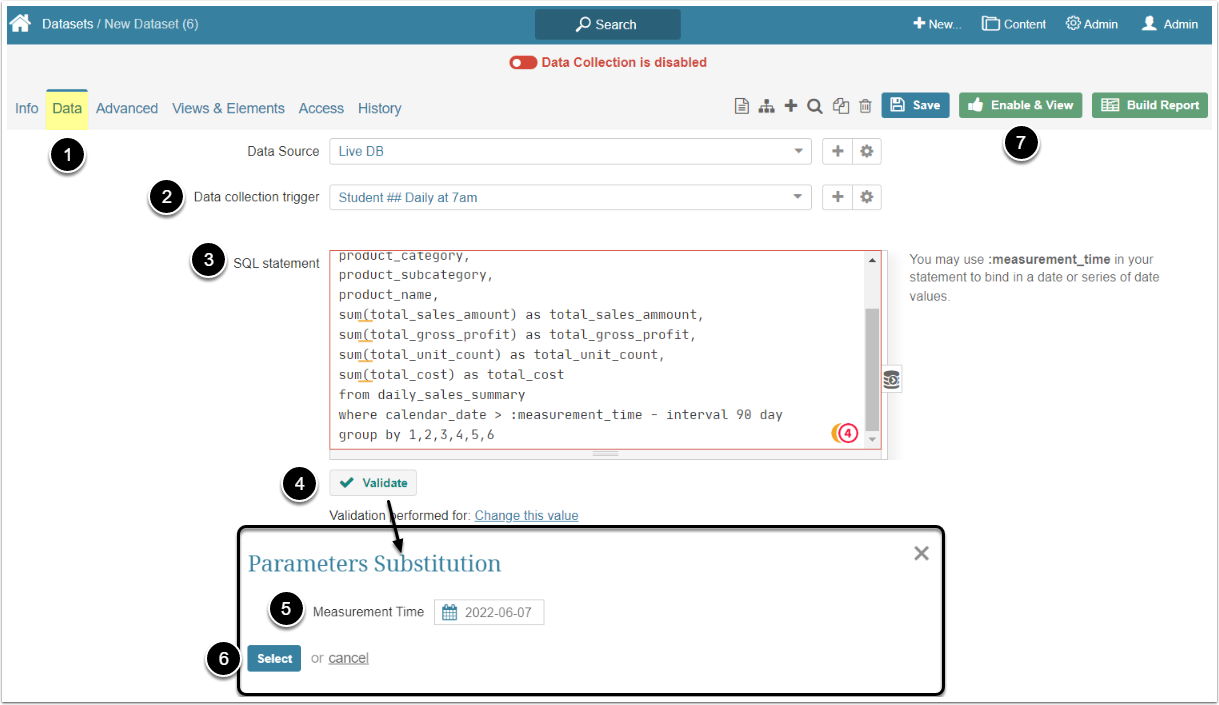
- Open the Data tab
- Data collection trigger: Select the "<your name> Daily at 7am" Data Collection Trigger
- SQL statement: Enter the code below
- [Validate]
- Measurement Time: Select a date in the past
- [Select]
- [Enable & View]
Here's the code for the SQL Statement field:
SELECT date_format(calendar_date,'%Y-%m-01') date,
country,
channel,
product_category,
product_subcategory,
product_name,
SUM(total_sales_amount) AS total_sales_ammount,
SUM(total_gross_profit) AS total_gross_profit,
SUM(total_unit_count) AS total_unit_count,
SUM(total_cost) AS total_cost
FROM daily_sales_summary
WHERE date_format(calendar_date, '%Y-%m-01') = date(:measurement_time)
GROUP BY 1,2,3,4,5,6
HAVING (total_sales_ammount >= 1000000 OR
total_gross_profit >= 500000 OR total_cost  <= 0.5* total_sales_ammount)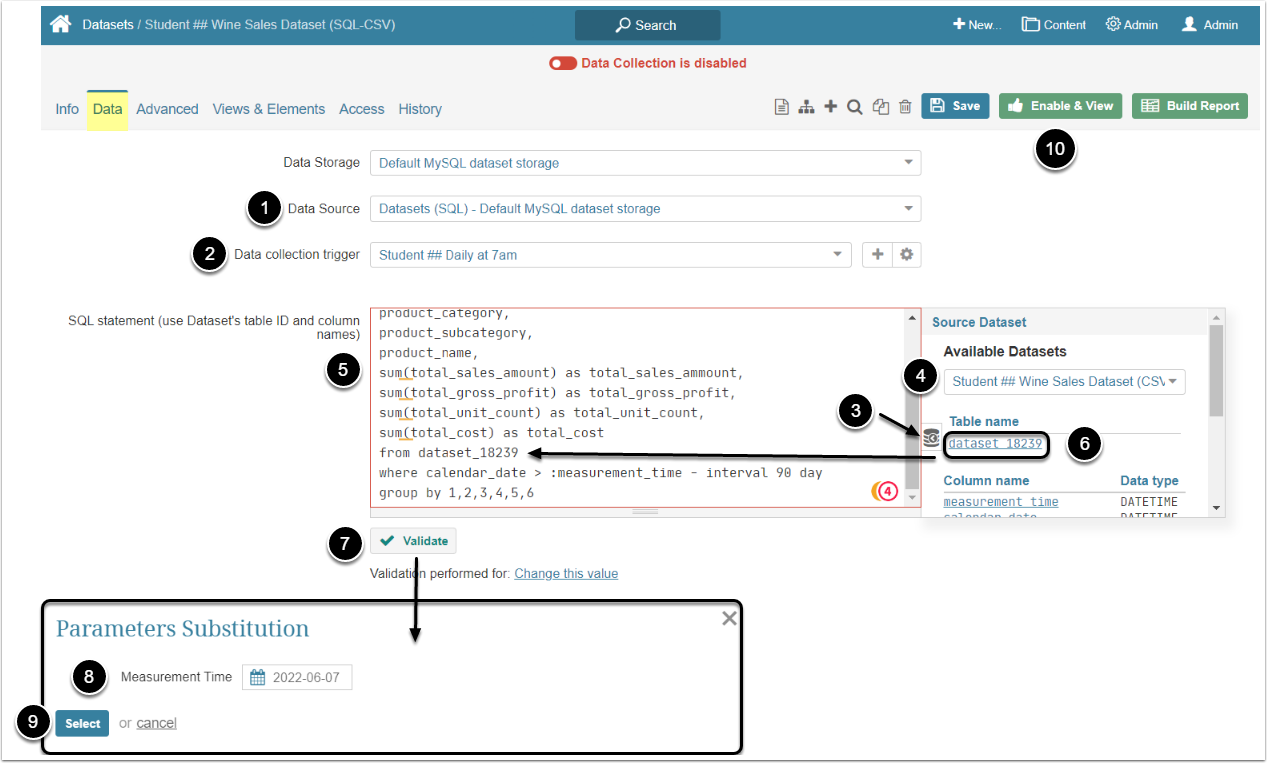
- Data Source: Select the "Datasets (SQL) - Default MySQL" option
- Data collection trigger: Choose the "<your name> Daily at 7am" Trigger
- Click Source of Reports button
- Available Datasets: Select the CSV Dataset you created
- SQL statement: Enter the code below
- In the code, replace the table name after the SQL "FROM" clause with the Table name of the CSV Dataset
- [Validate]
- Measurement Time: Select a date in the past
- [Select]
- [Enable & View]
Here's the code for the SQL Statement field:
SELECT date_format(calendar_date,'%Y-%m-01') date,
country,
channel,
product_category,
product_subcategory,
product_name,
SUM(total_sales_amount) AS total_sales_ammount,
SUM(total_gross_profit) AS total_gross_profit,
SUM(total_unit_count) AS total_unit_count,
SUM(total_cost) AS total_cost
FROM dataset_18239
WHERE date_format(calendar_date, '%Y-%m-01') = date(:measurement_time)
GROUP BY 1,2,3,4,5,6
HAVING (total_sales_ammount >= 1000000 OR
total_gross_profit >= 500000 OR total_cost <= 0.5* total_sales_ammount)Content Creation
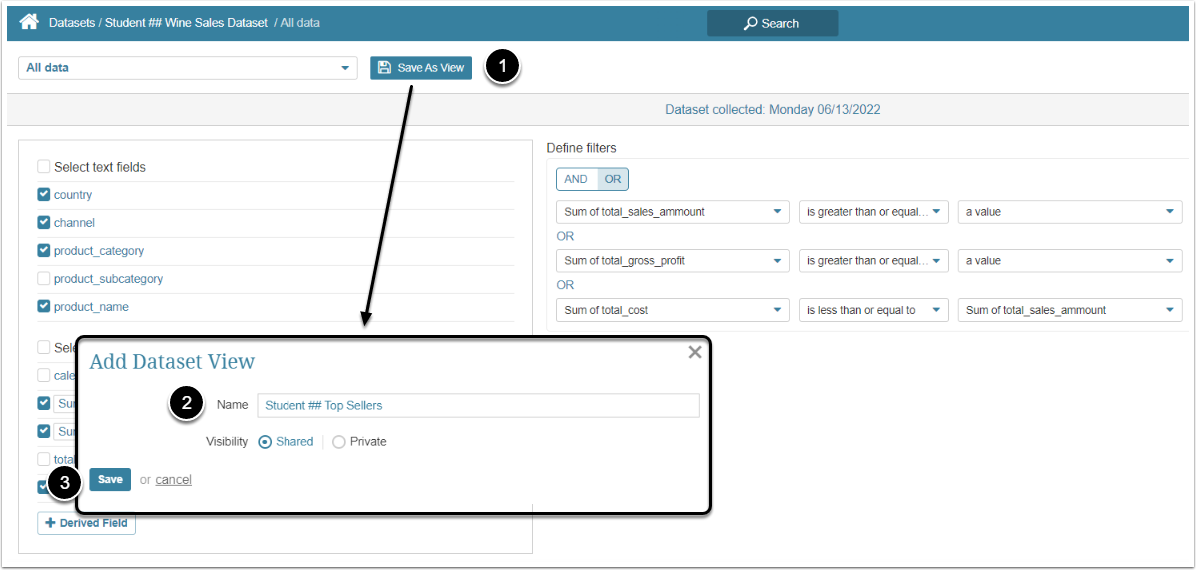
Datasets are designed to serve as a source of data for new Elements such as Metrics and Reports. By creating a Dataset View you can save customized filters and rules which generate specific valuable data. The View can be used to create a table of data displayed in an Internal Report. Besides the Table View you can also add Charts, Graphs, and other visual elements to the Report. For more information, see the Dataset Reports section.
In this section you will learn how to create a custom View in the Dataset Viewer and build a Report from that View.
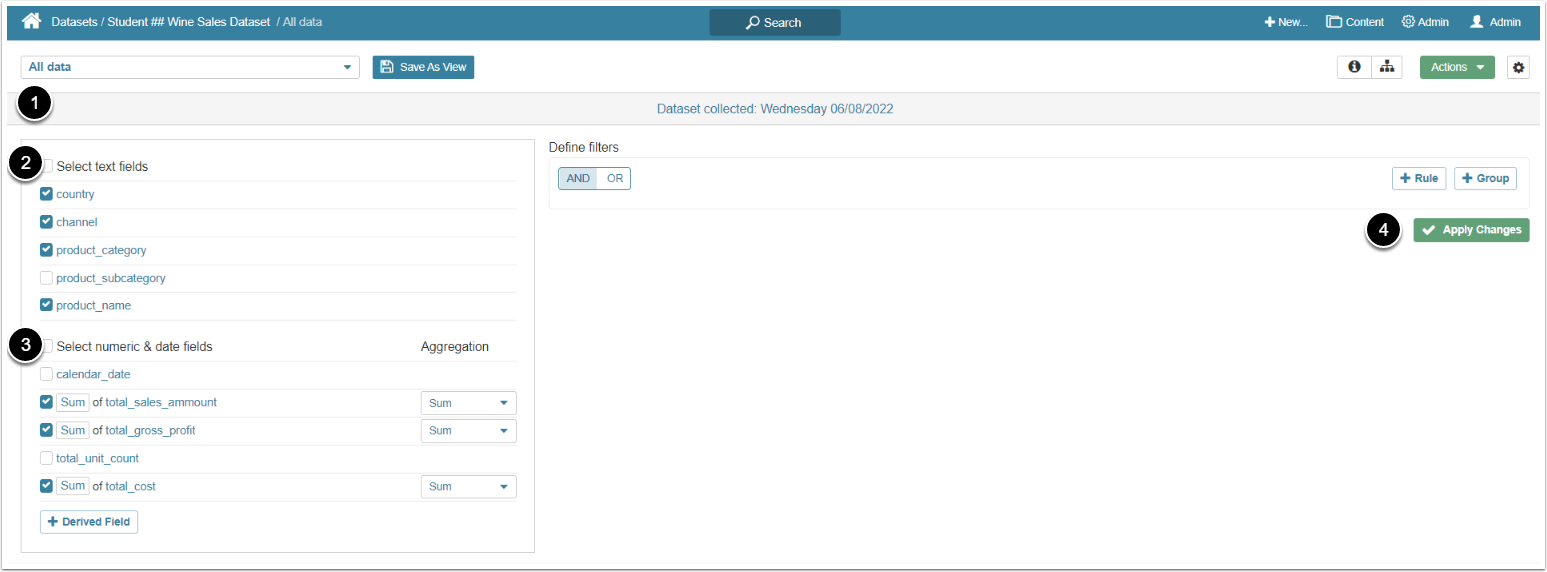
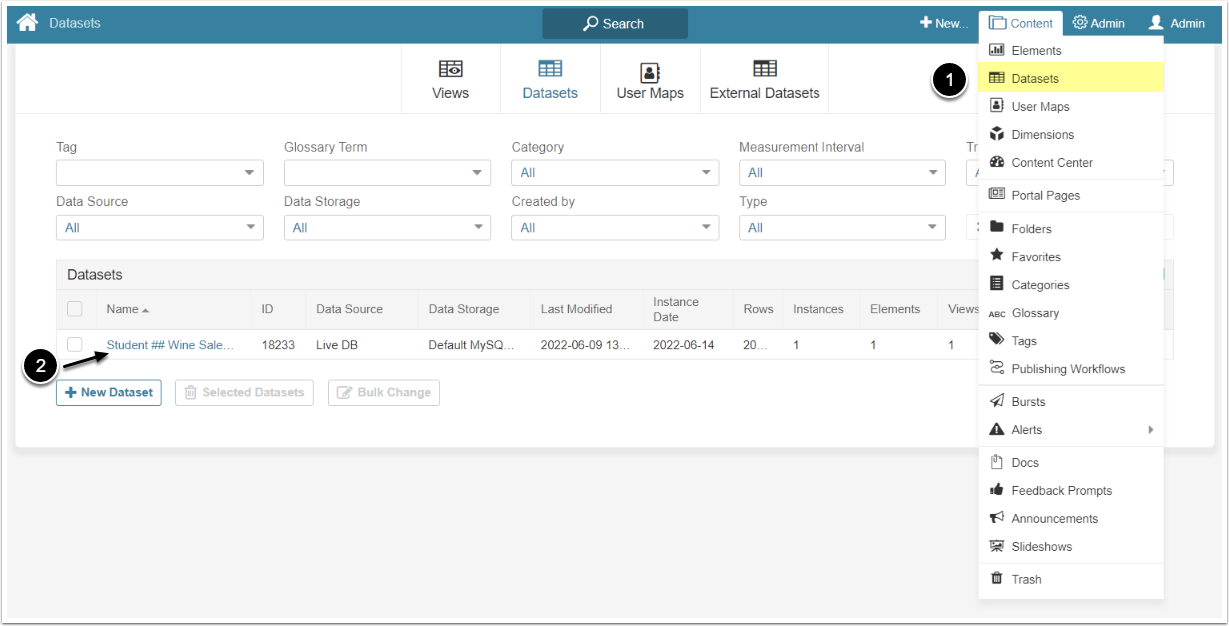
- Open the Dataset Viewer and select "All Data" view
- Select the following text fields:
- Country
- Channel
- Product_category
- Product_name
- Select the following numeric & date fields:
- Total Sales Amount: Select "Sum" option in the Aggregation column
- Total Gross Profit: Select "Sum" option in the Aggregation column
- Total Cost: Select "Sum" option in the Aggregation column
- [Apply Changes]
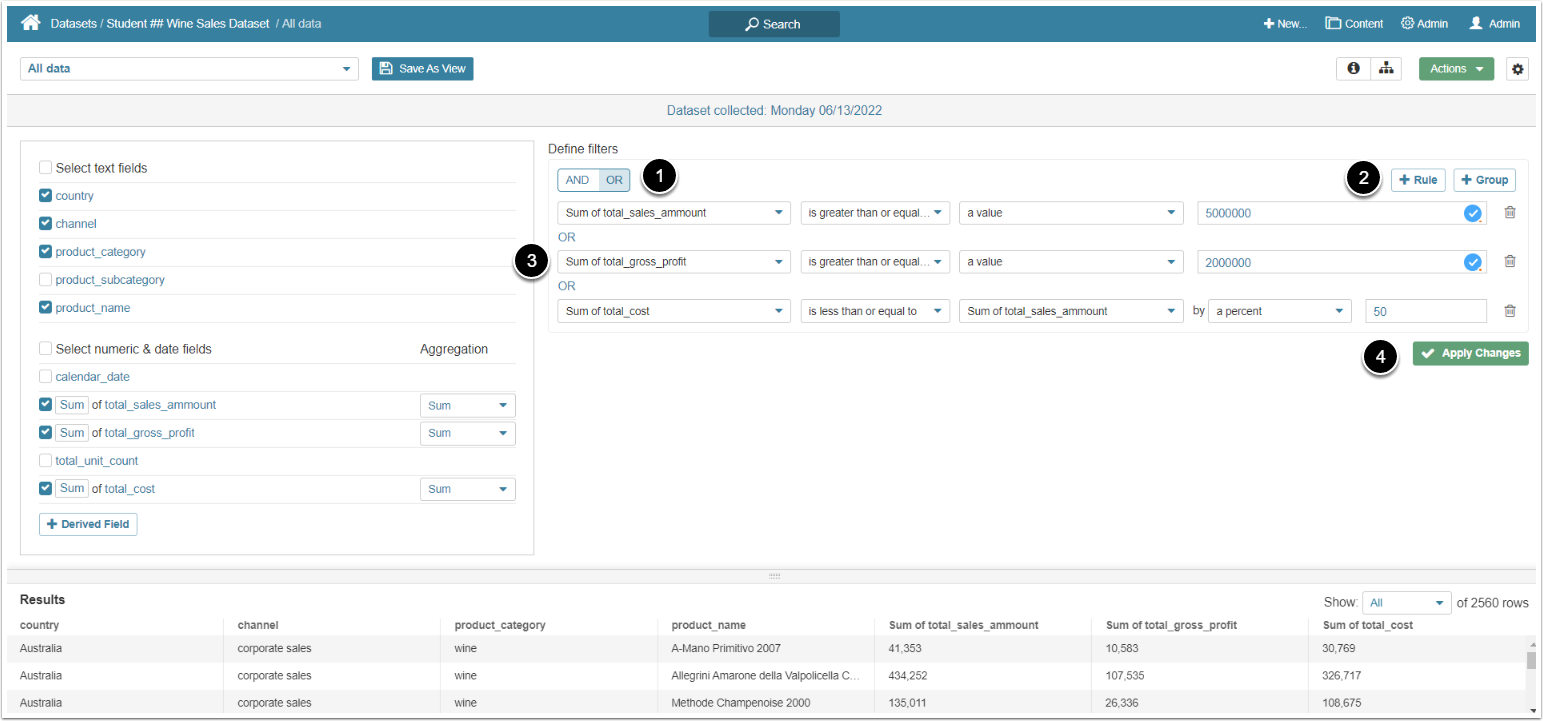
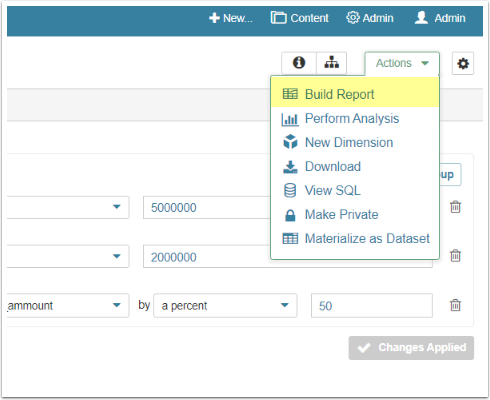
- Switch the toggle to "OR"
- [+ Rule]
- Define the filter Rules:
- "Sum of total_sales_amount" + "is greater than or equal to" + "a value" + "5000000"
- "Sum of total_gross_profit" + "is greater than or equal to" + "a value" + "2000000"
- "Sum of total_cost" + "is less than or equal to" + "Sum of total_sales_amount" + "by a percent" + "50"
- For more details refer to the Create a Dataset View article
- [Apply Changes]
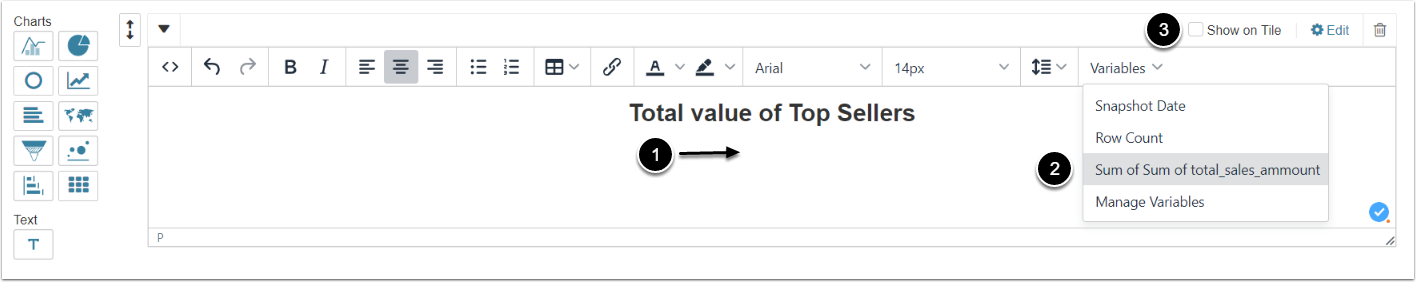
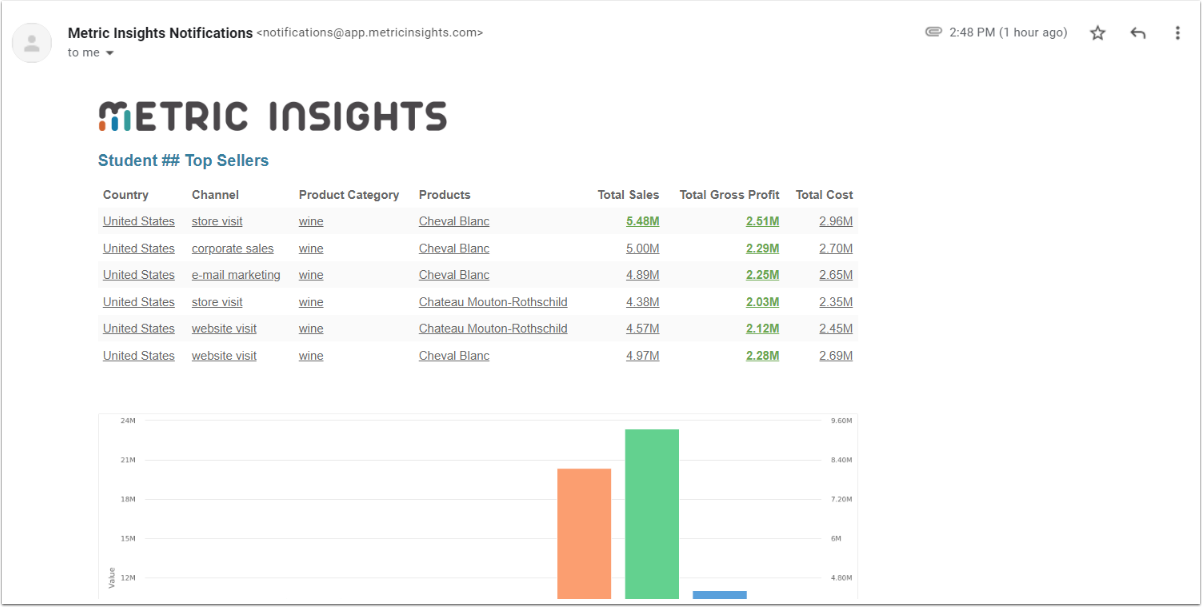
Reports are live connections to the custom View of the Dataset. In the Dataset Viewer you created a custom View that surfaces relevant data exceptions which can be used to create Elements in the catalog. In this example, we'll build an Element tile for a Report. That Report can be shown on the Homepage and added to Bursts. For more information, refer to Dataset Reports Overview.
In this section you will learn to build Reports.
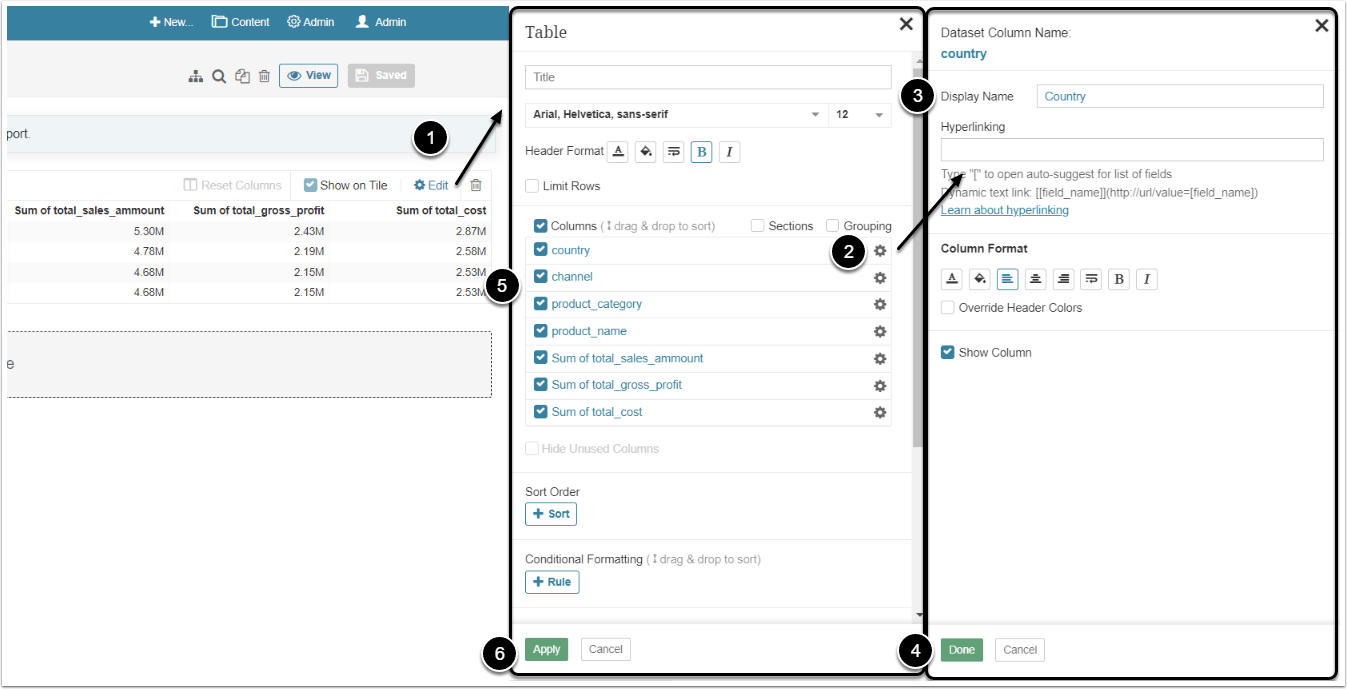
- Click Edit
- Click the gear icon in the "country" row
- Display Name: Capitalize the column name "country" to "Country"
- [Done]
- Replace the names of other columns:
- "channel" to "Channel"
- "product_category" to "Product Category"
- "product_name" to "Product"
- "Sum of total_sales_amount" to "Total Sales"
- "Sum of total_gross_profit" to "Total Gross Profit"
- "Sum of total_cost" to "Total Cost"
- [Apply]
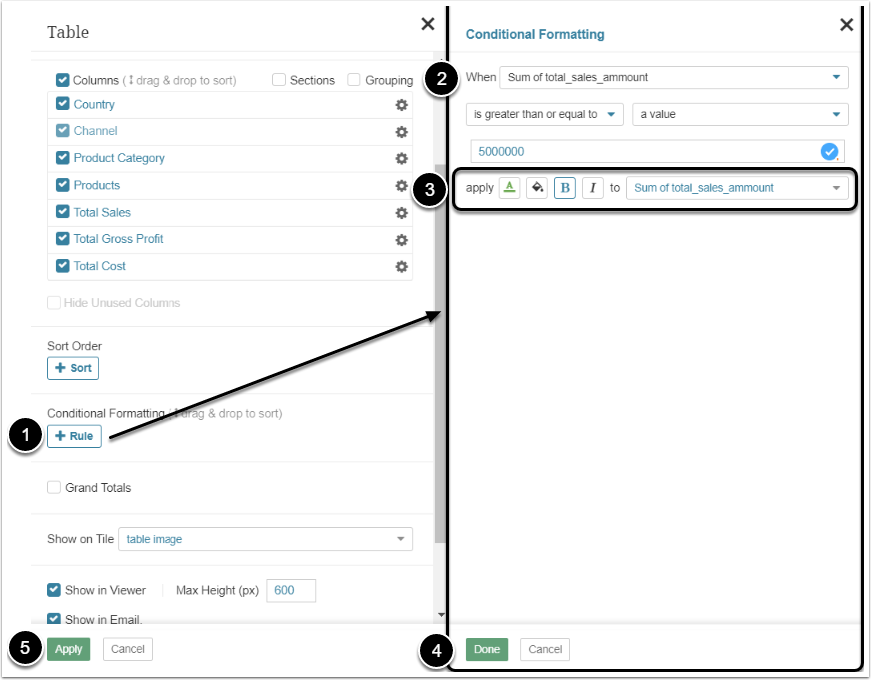
- [+ Rule]
- Set the Conditional Formatting Rule:
- "Sum of total_sales_amount" + "is greater than or equal to" + "a value" + "5000000"
- Apply green bold font to "Sum of total_sales_amount"
- [Done]
- [Apply]
Repeat for two more rules:
- "Sum of total_gross_profit" + "is greater than or equal to" + "a value" + "2000000"
- Apply green bold font to "Sum of total_gross_profit"
- "Sum of total_cost" + "is less than or equal to" + "Sum of total_sales_amount" + "by a percent" + "50"
- Apply green bold font to "Sum of total_cost"
For more details refer to Dataset Reports Overview article.
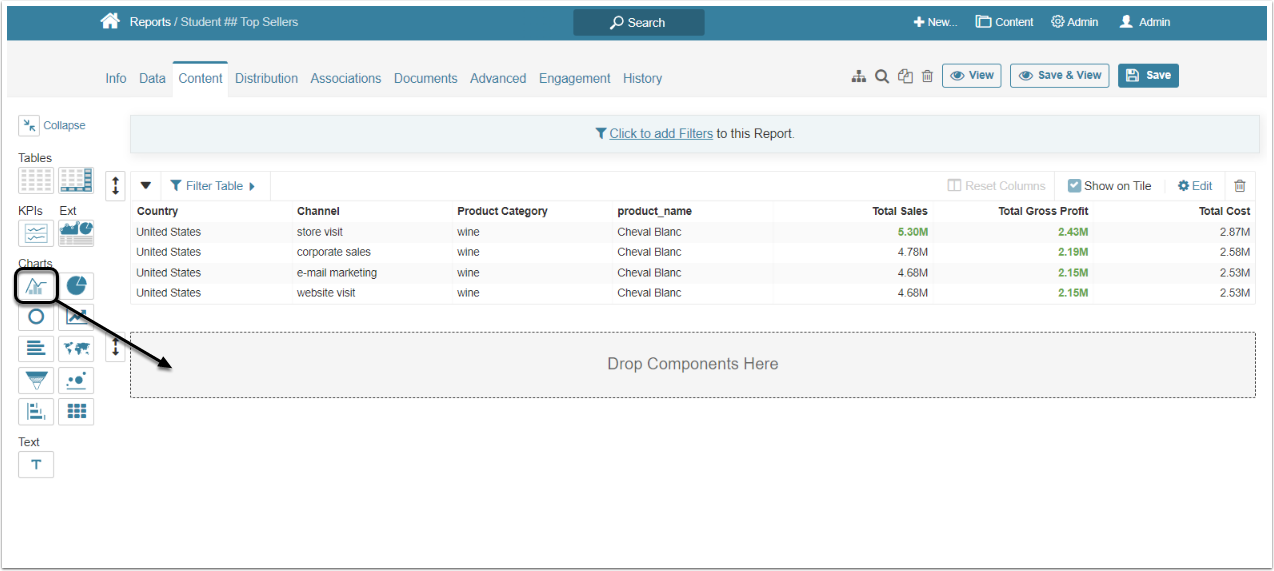
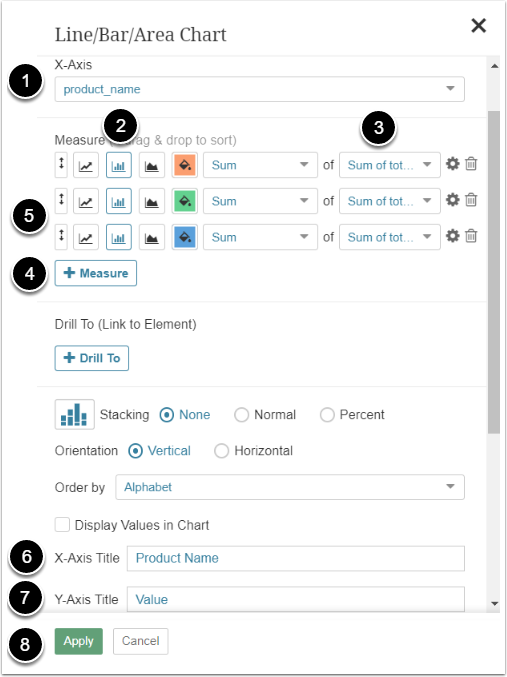
- X-Axis: Select "product_name" option
- Select the "Show as bar" icon in the measure row
- Choose "Sum of total_sales_amount"
- [+ Measure]
- Repeat for "Sum of total_gross_profit" and "Sum of total_cost"
- X-Axis Title: Type "Product Name"
- Y-Axis Title: Insert "Values"
- [Apply]
For more details refer to the Creating Charts in Dataset Reports article.
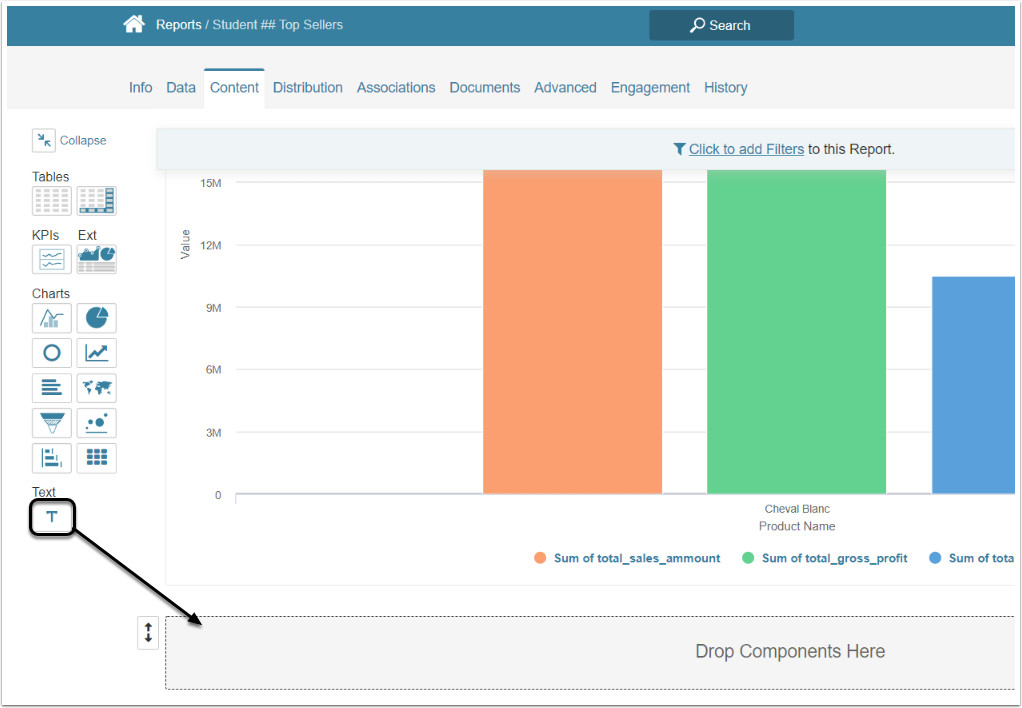
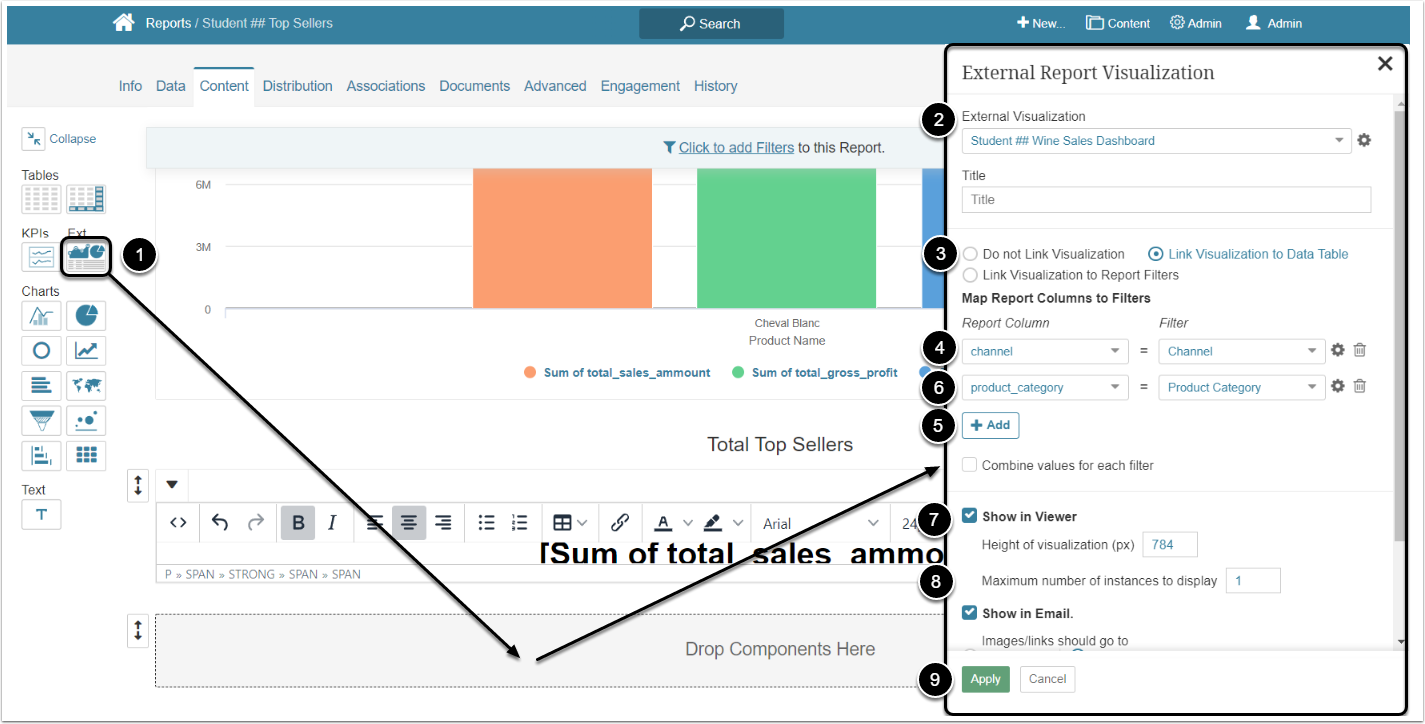
- Drag the External Report icon to the Drop Components Here section
- External Visualization: Select the "<your name> Wine Sales Dashboard" External Report
- Choose "Link Visualization to Data table" option
- In the Report Columns select the "channel" option and in the Filters choose "Channel" option
- [+ Add]
- In the Report Columns select the "product_category" option and in the Filters choose "Product Category" option
- Activate the Show in Viewer checkbox
- Maximum number of instances to display: Insert "1"
- [Apply]
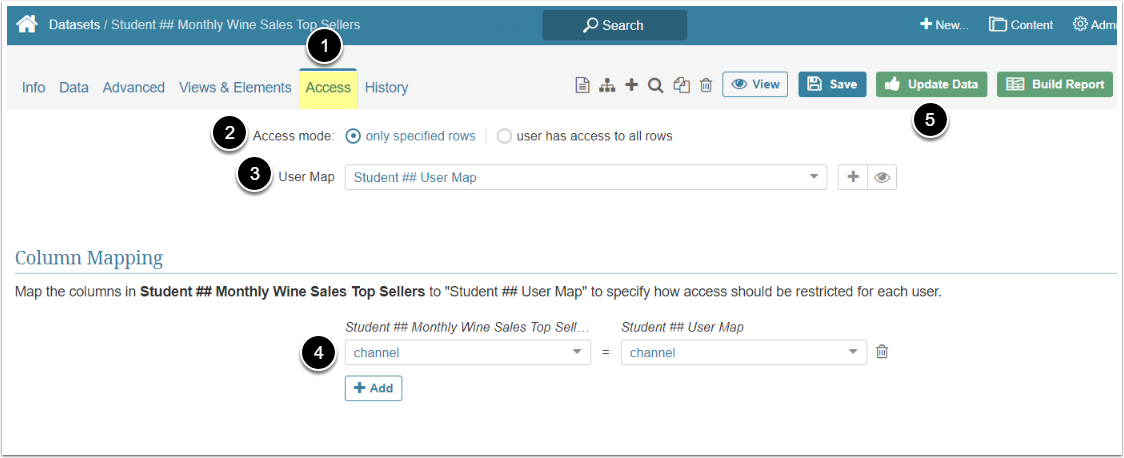
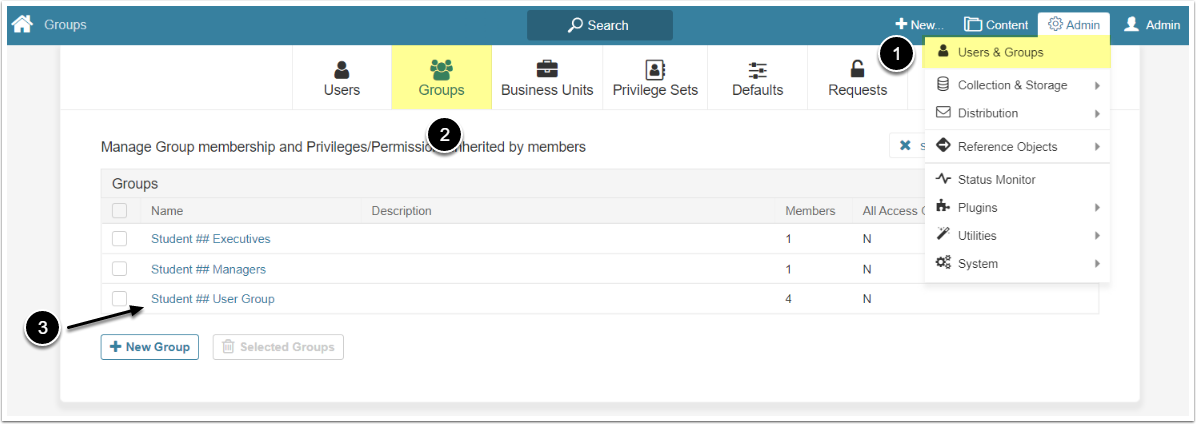
Access Control
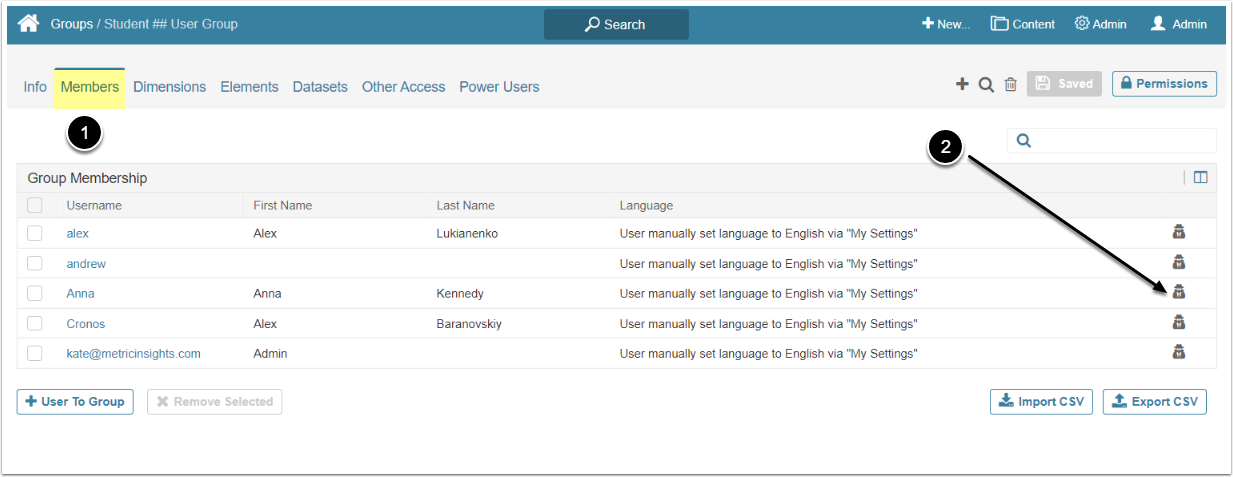
In this section you restrict the User's access to the Dataset data by applying a User Map to it. This way you control what a specific user sees when opening both the Dataset and any reports. For additional information refer to Create a User Map (Apply Row Level Security) article.
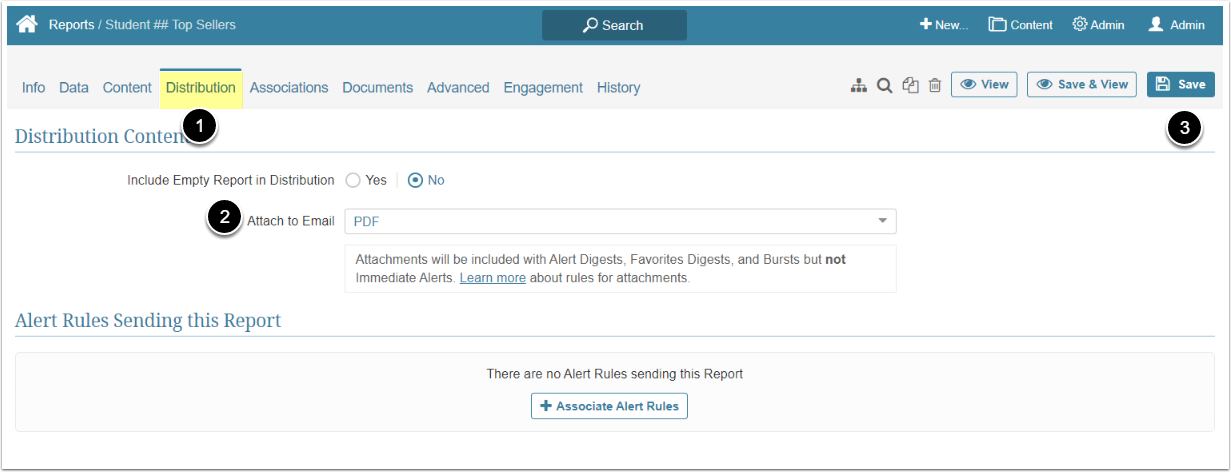
Distribution of Content
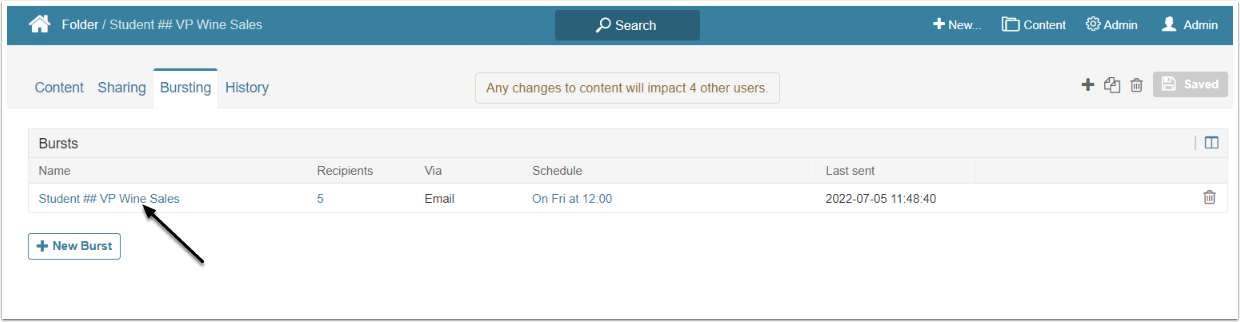
In this section you will add the Report to the Burst and manage the distribution so the sent email will include attached files.
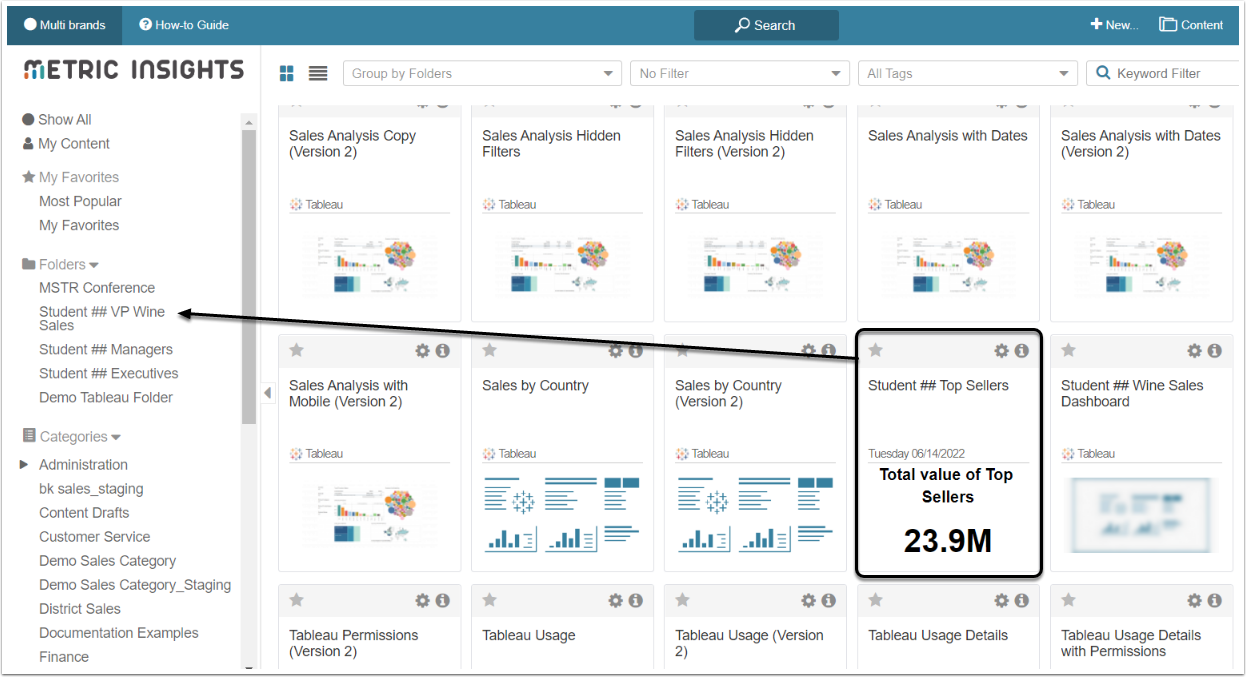
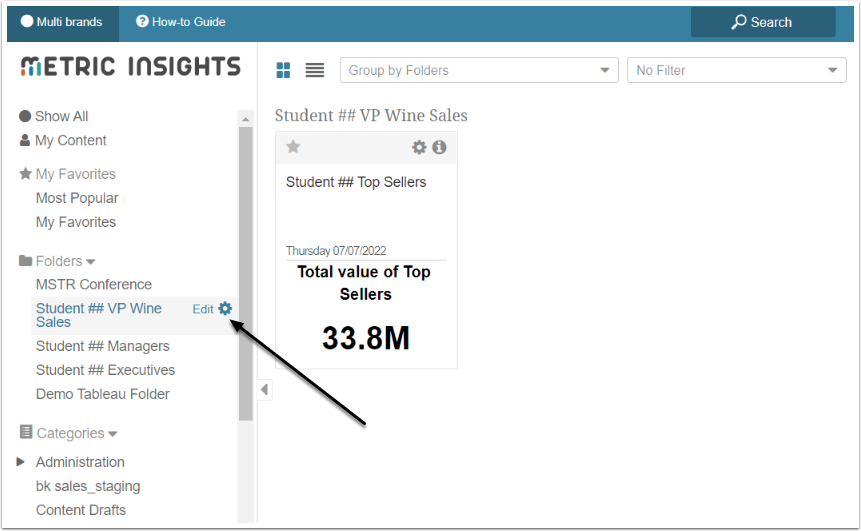
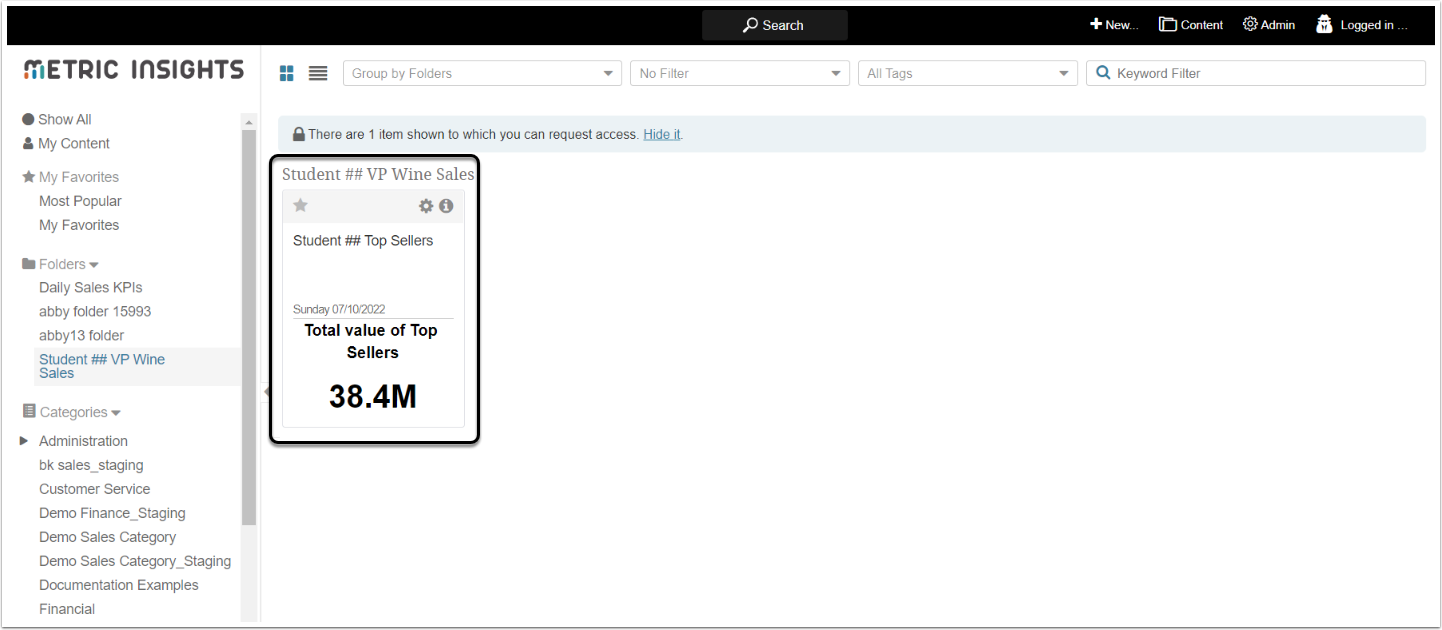
Drag-and-drop the "<your name> Top Sellers" External Report tile to the "<your name> VP Wine Sales" Folder you created.
You won't be able to see data on the tile if your Username is not included in the User Map applied to the Dataset. You will still be able to see data in the Dataset and Report Editors.
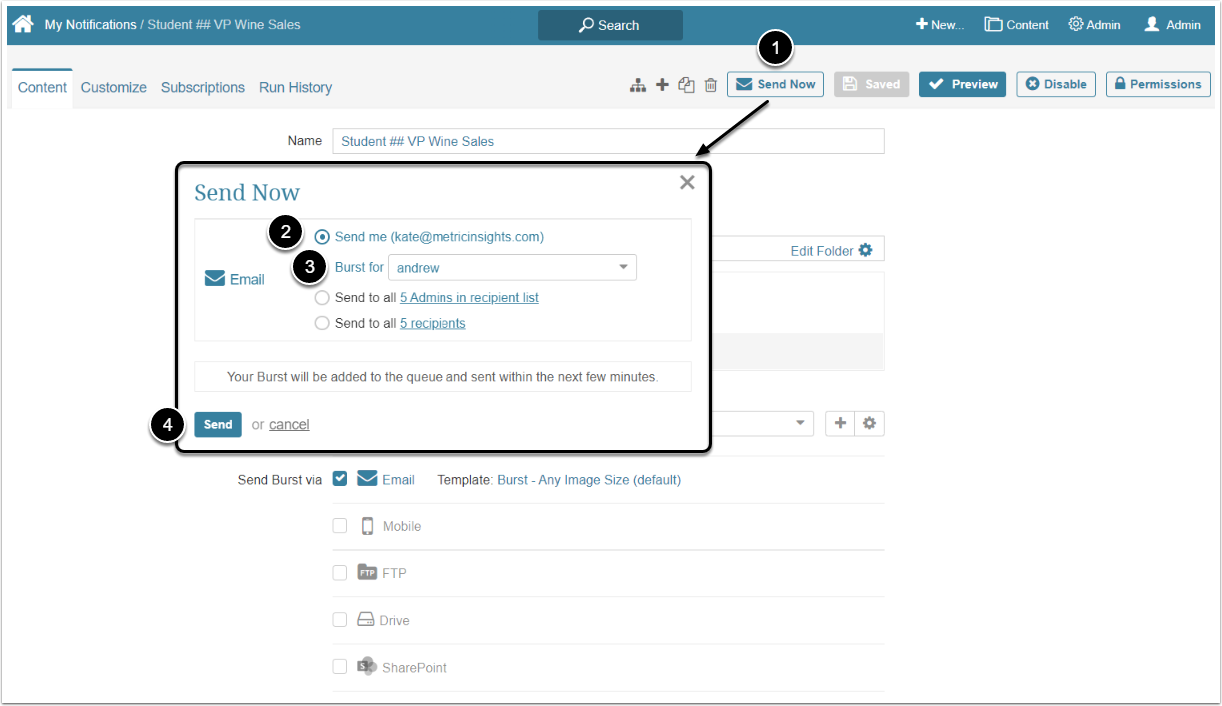
The following steps are available to Admins only.
Congratulations! You finished the workflow!