This article contains a sample of an end-to-end Metric Insights system Use Case. If you are new to the system, completing all the steps introduces you to several features within the system and explains how they work together. In addition, the Use Case familiarizes you with MI's vocabulary.
In this example, the Admin has a request from a business unit that oversees company Wine Sales. They request that the Metric Insights Catalog display content from a dashboard pre-filtered for specific users; e.g., the manager who works only with the online purchases needs to see the data filtered by the "website" channel of sales on the first place. Use the example workflow outline below to:
- Understand how users connect to BI platforms, retrieve and display an existing dashboard from Tableau – Wine Sales Dashboard
- Learn how to create elements that display content
- Organize the tile into a Folder where each user will see their expected filter defaults
Though the example uses Tableau, the workflow is general enough that it can be applied to different BI platforms that use filtered visualizations.
A similar workflow is outlined in this training video.
Data Collection
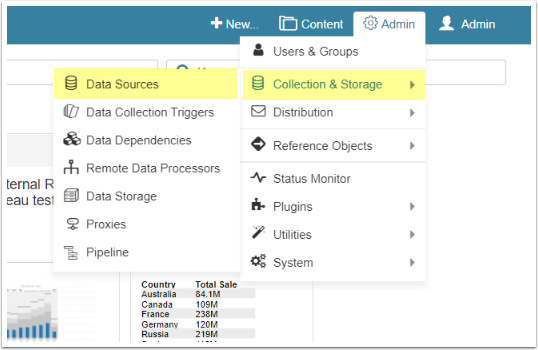
In this section, you connect to the Tableau Data Source that establishes a pipeline between the Metric Insights and Tableau data visualization software. Metric Insights can interface with a wide variety of different business intelligence tools.
Make sure to register on the Tableau website and create an account and some data files. For this Use Case you will need the username and password of your Tableau account.
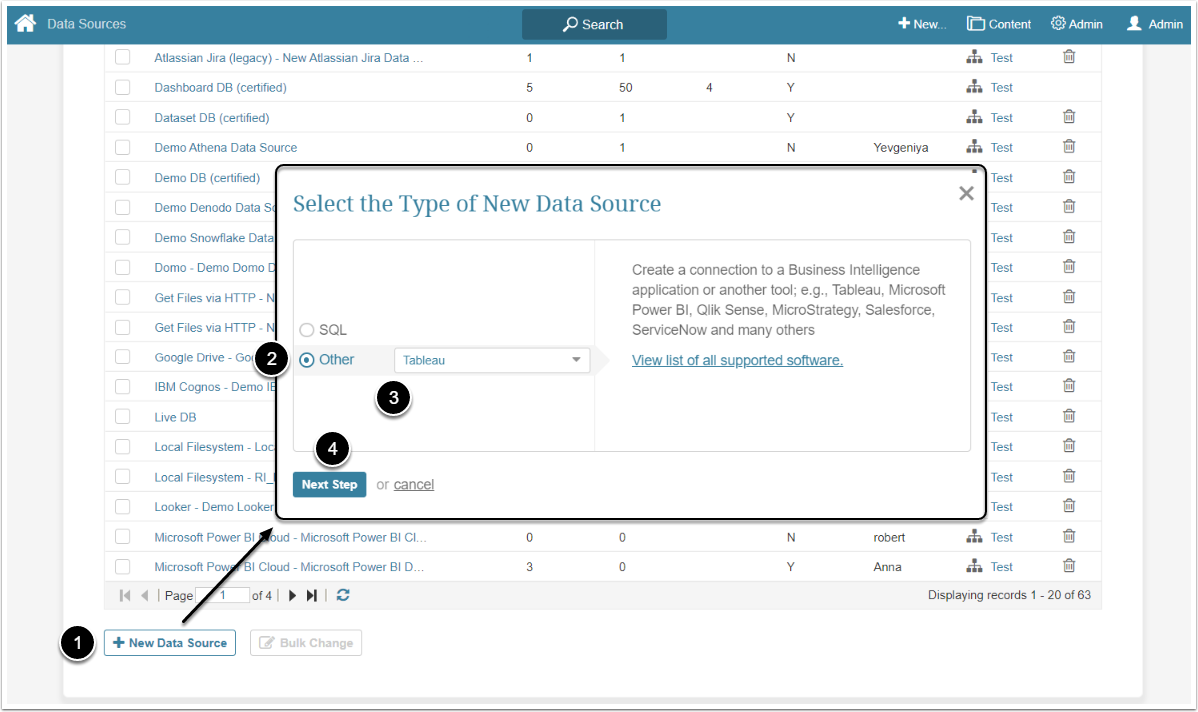
Detailed information about the types of Data Sources and general approach to them can be found in Understanding Data Sources article.
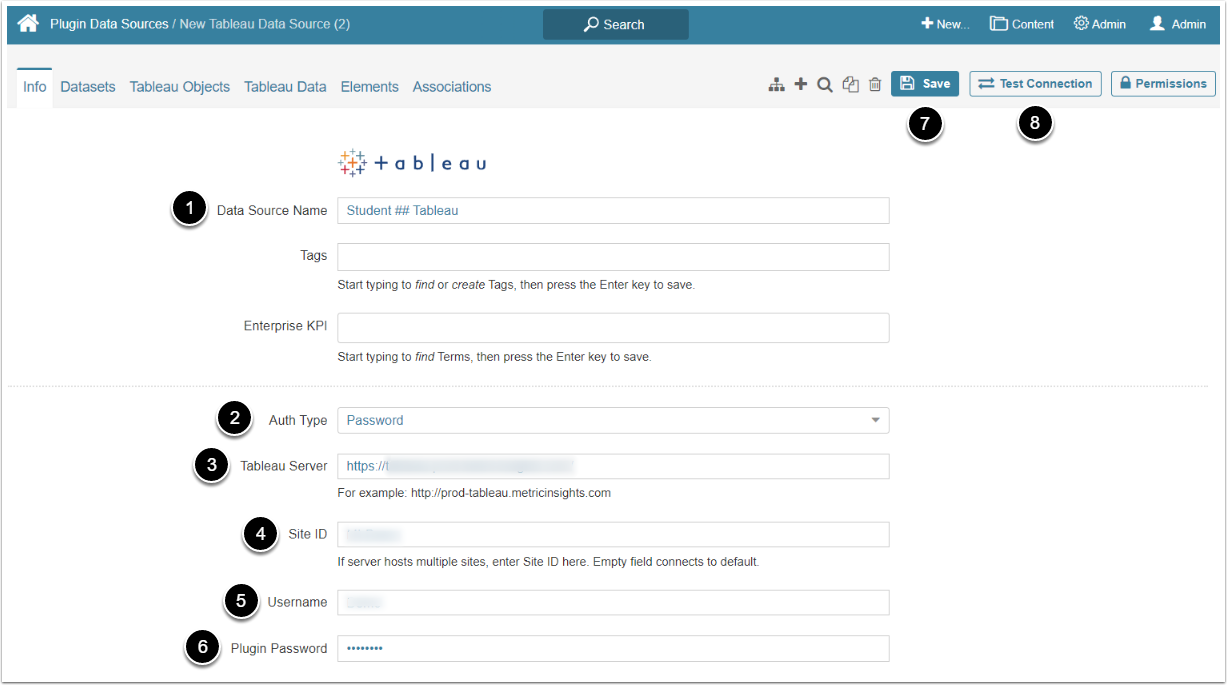
Complete the fields:
- Data Source Name: Name the Data Source "<your name> Tableau". In this use case "Student ##" is used instead of a name
- Auth Type: Choose "Password"
- Tableau Server: Insert the address of the Tableau server
- Site ID: Type the ID of the site you are using
- Username: Use the username of the account you registered on the Tableau website
- Password: Insert the password of the account you registered on the Tableau website
- [Save]
- [Test Connection]
If your entries are correct, the "Connection validated successfully" notification appears.
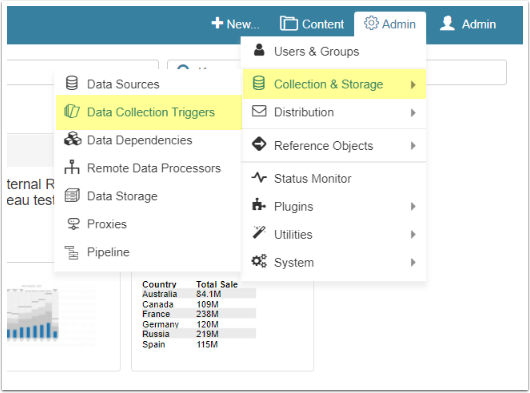
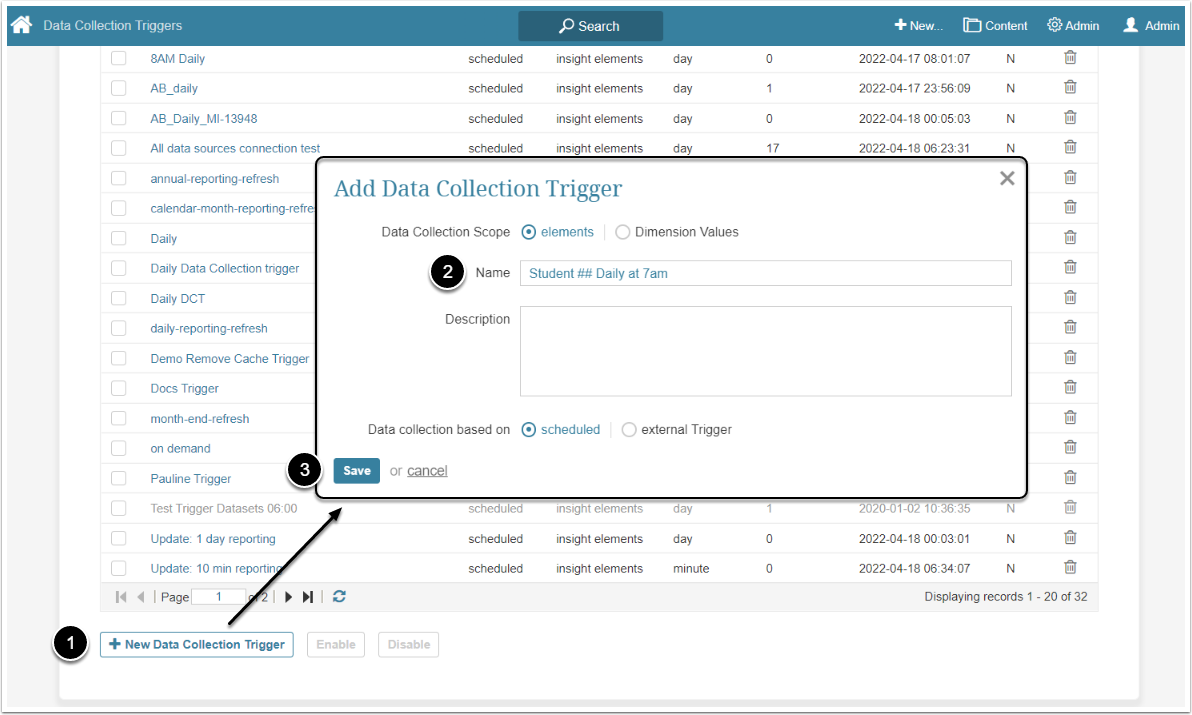
Data Collection Triggers define when content should be updated within Metric Insights. You can select at what time and how often the data will be collected from Tableau. For more details about Data Collection Triggers, check this article.
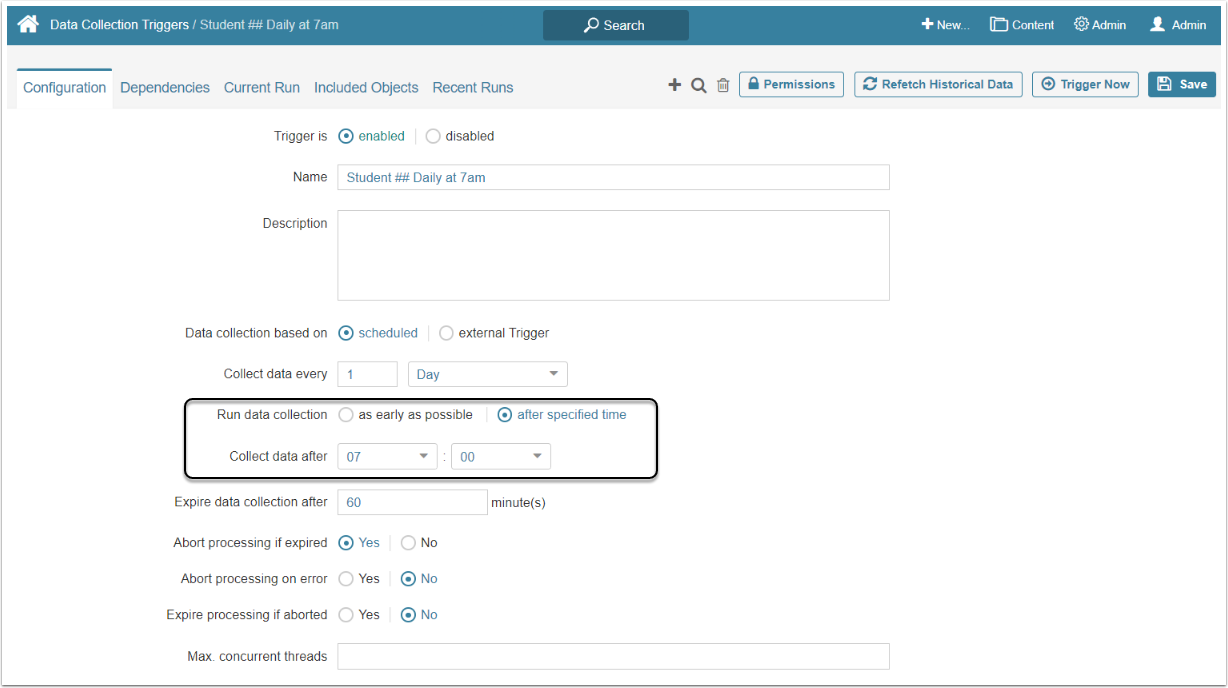
- Run data collection: Set to "After Specified Time"
- Collect data after: Choose the time
- [Save]
If you would like to understand what other options on the Configuration tab are responsible for, check Create a Data Collection Trigger article.
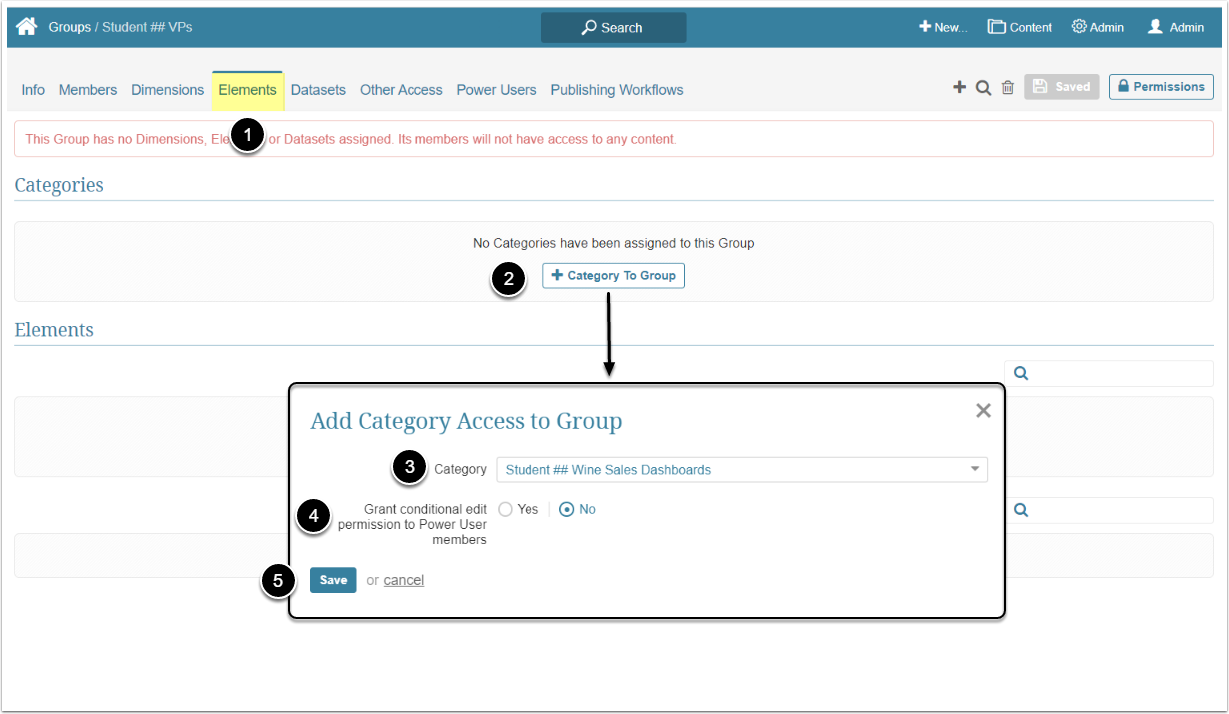
Content Creation
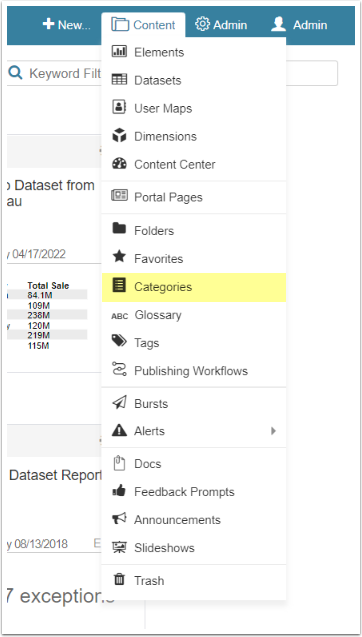
In this section you will create a Category for the content, an External Report to which that Category will be applied and a User Map that will define what part of the data will be visible to Users.
For more details, refer to Create a Category article.
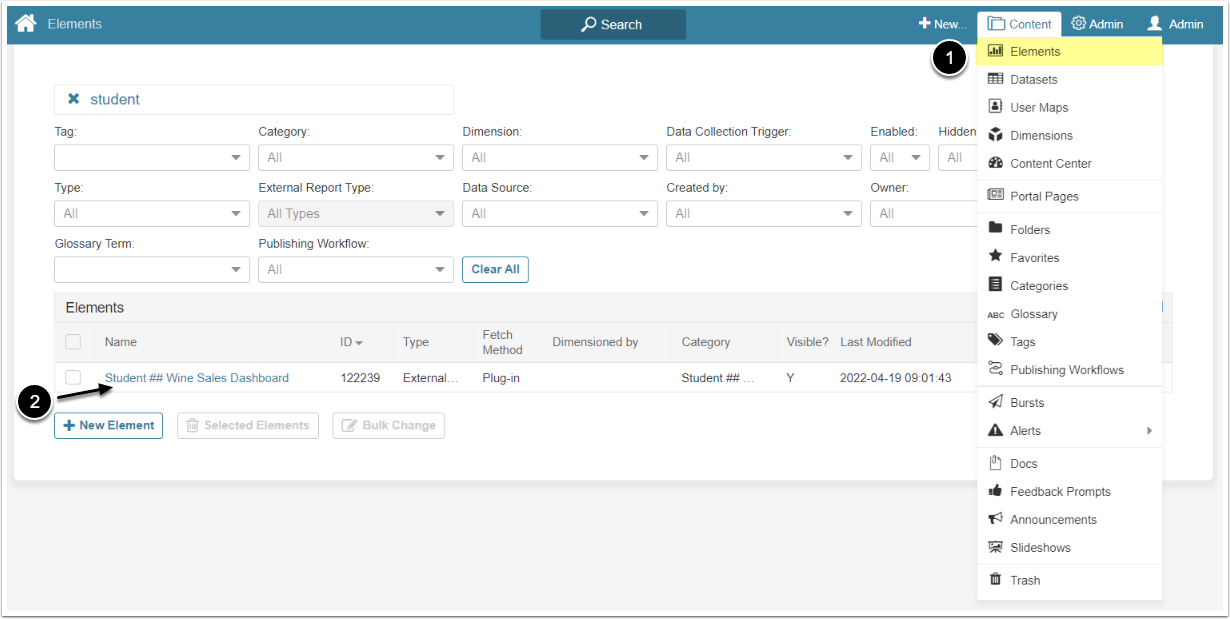
External Report is a piece of content that allows to automatically gather and show data, stored in an external source, apply filters to that data and flexibly customize its display. For a detailed description of External Report features, refer to the External Report Overview article.
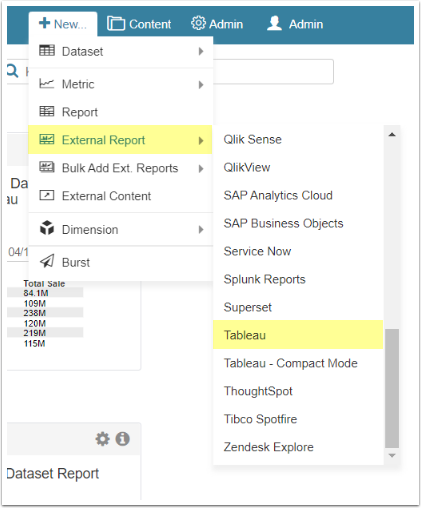
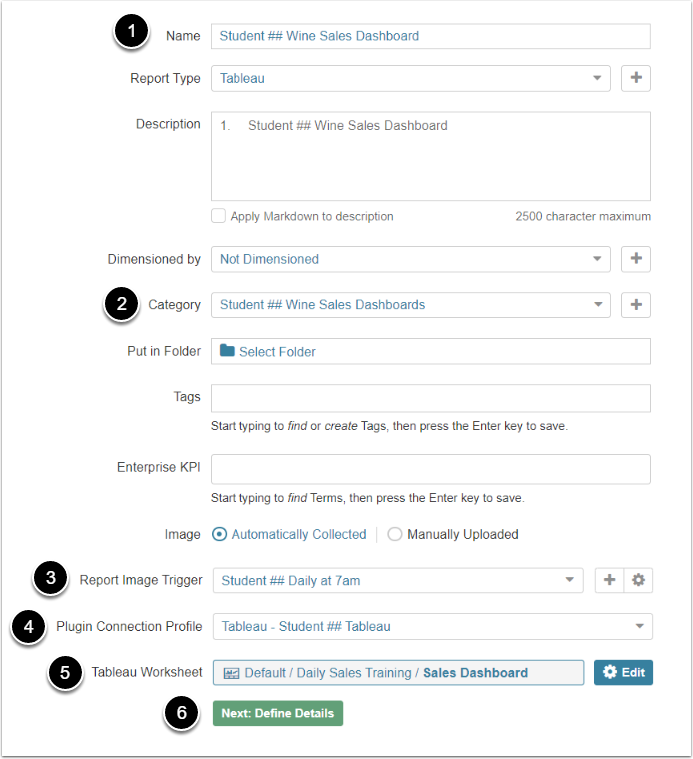
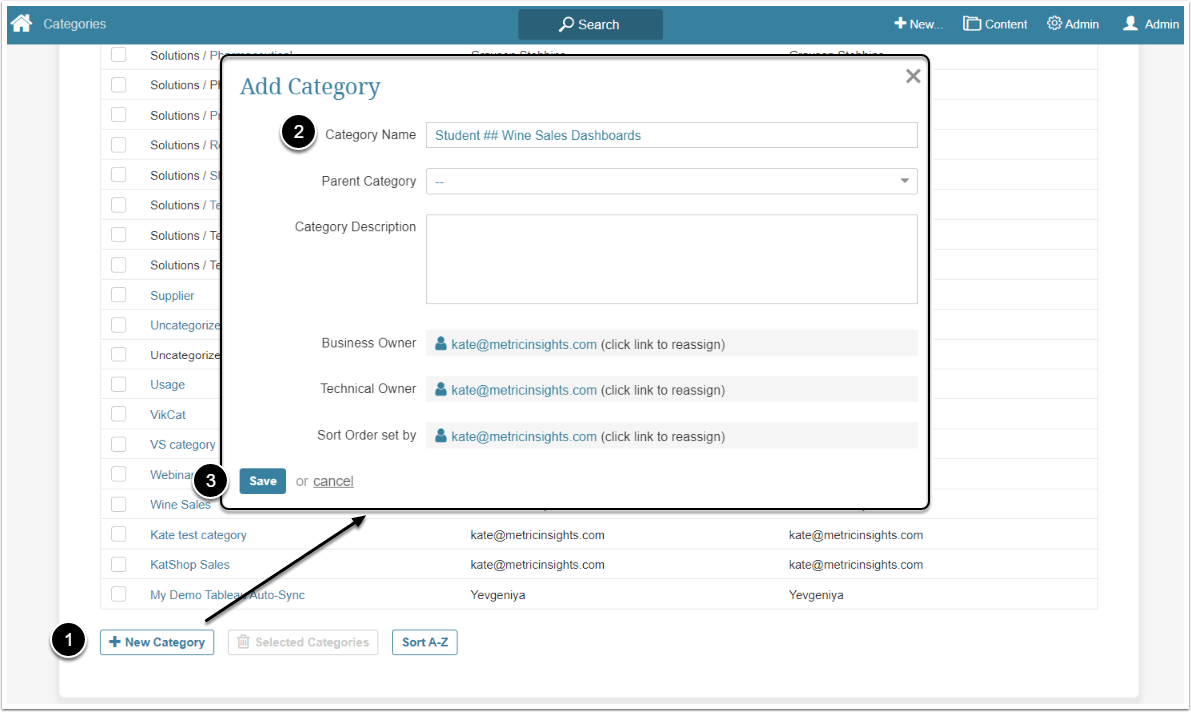
- Name: Name the External Report "<your name> Wine Sales Dashboard". In this use case "Student ##" is used instead of a name
- Category: Select the "<your name> Wine Sales Dashboards" Category
- Report Image Trigger: Choose the "<your name> Daily at 7am" Trigger
- Plugin Connection Profile: Select "<your name> Tableau" Data Source
- Tableau Worksheet: Click on the field and in the displayed window choose the file
- [Next: Define Details]
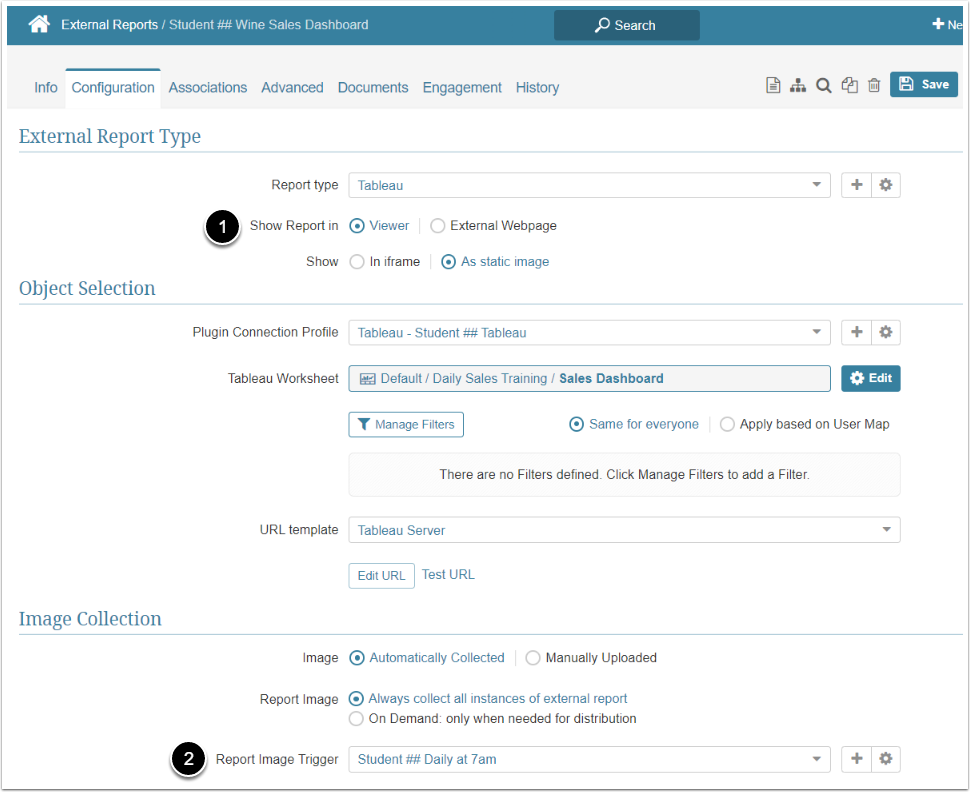
If you created filters for the data in Tableau account or any BI tool you use and want to use them in Metric Insights, you first need to retrieve their names. Afterward, you will be able to match those filters with the User Map.
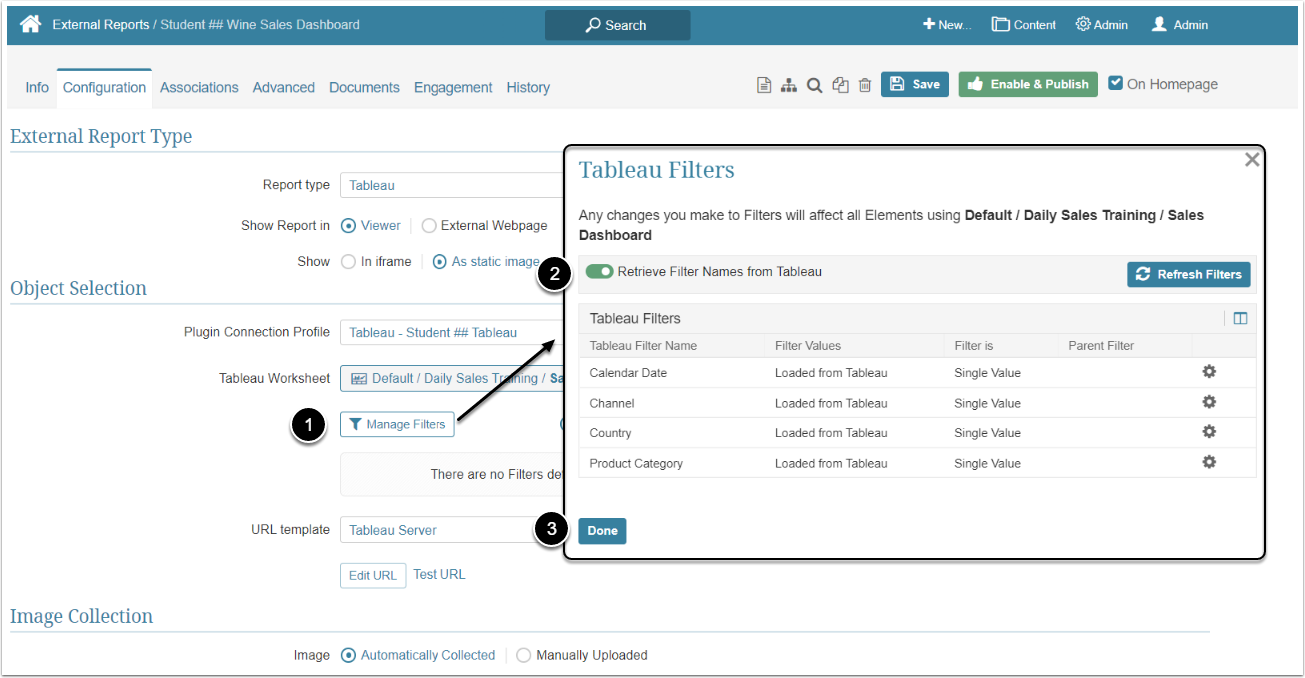
- [Manage Filters]
- Activate Retrieve Filter Names from Tableau toggle switch
- [Done]
See Filtering in External Reports for more details.
In simple words, User Map works like an additional filter. It grants the User access to the filter values, created in a BI tool. User Map is a table, made on your PC or in any BI tool, that defines what kind of data a specific user sees in Viewer. In this workflow, the User Map connects a Metric Insights User name to a filter value as defined in the Tableau filter section of the External Report. Because we know in advance the values that belong to each User, we can map those usernames to specific filter values as a convenient, intelligent default. See the detailed explanation of what the User Map is in this article.
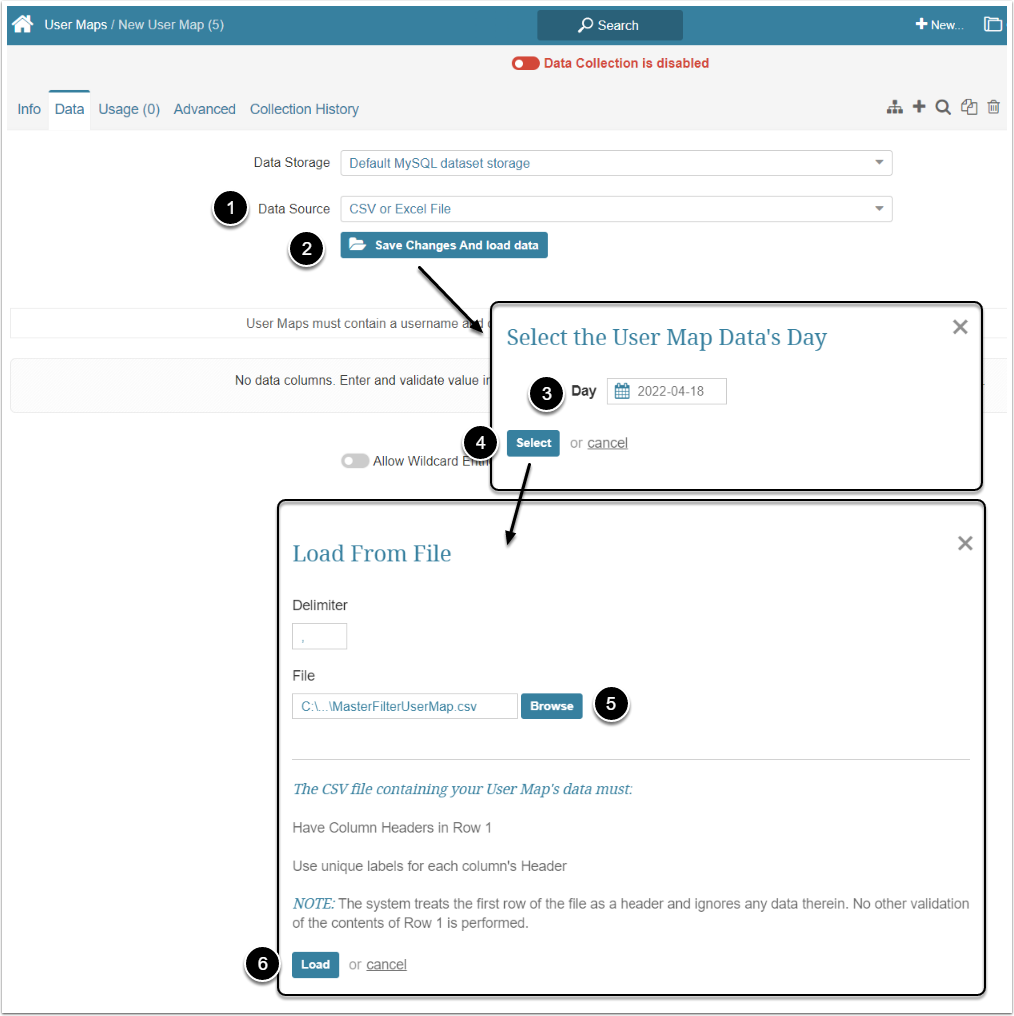
The User Map can use any Data Source but in this use case it will be a CSV file. So, you will need a test CSV file. You can download it or create it manually.
In Excel or similar tool, create a table that contains "username" column. The table should have columns with the names that match the names of columns in the External Report table. Fill them with data, mapping the usernames with the types of information they see by default. When the designated user enters the Homepage, in this External Report he will, by default, see the data you listed in the User Map. Here is an example of such a table:
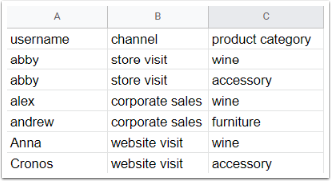
Give it a descriptive name and save the table as a CSV file.
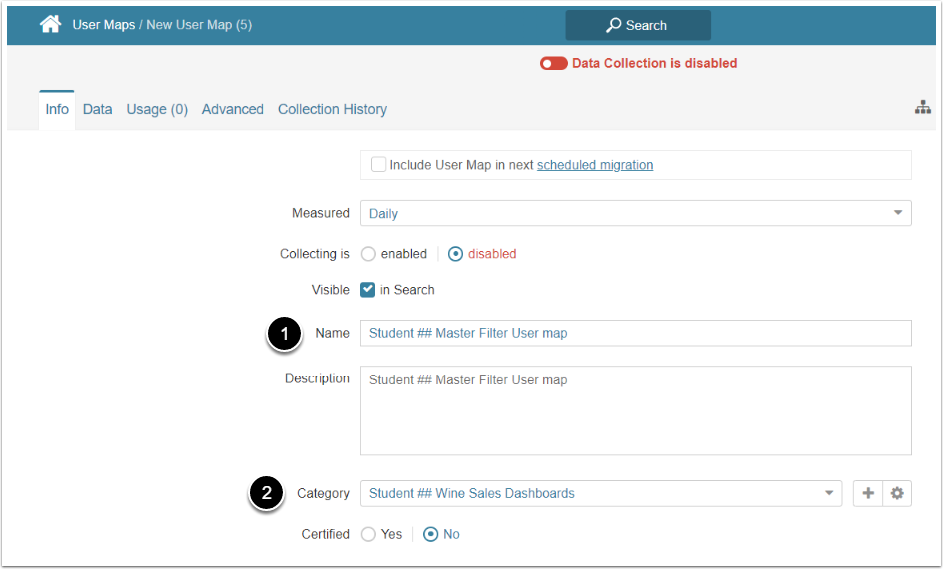
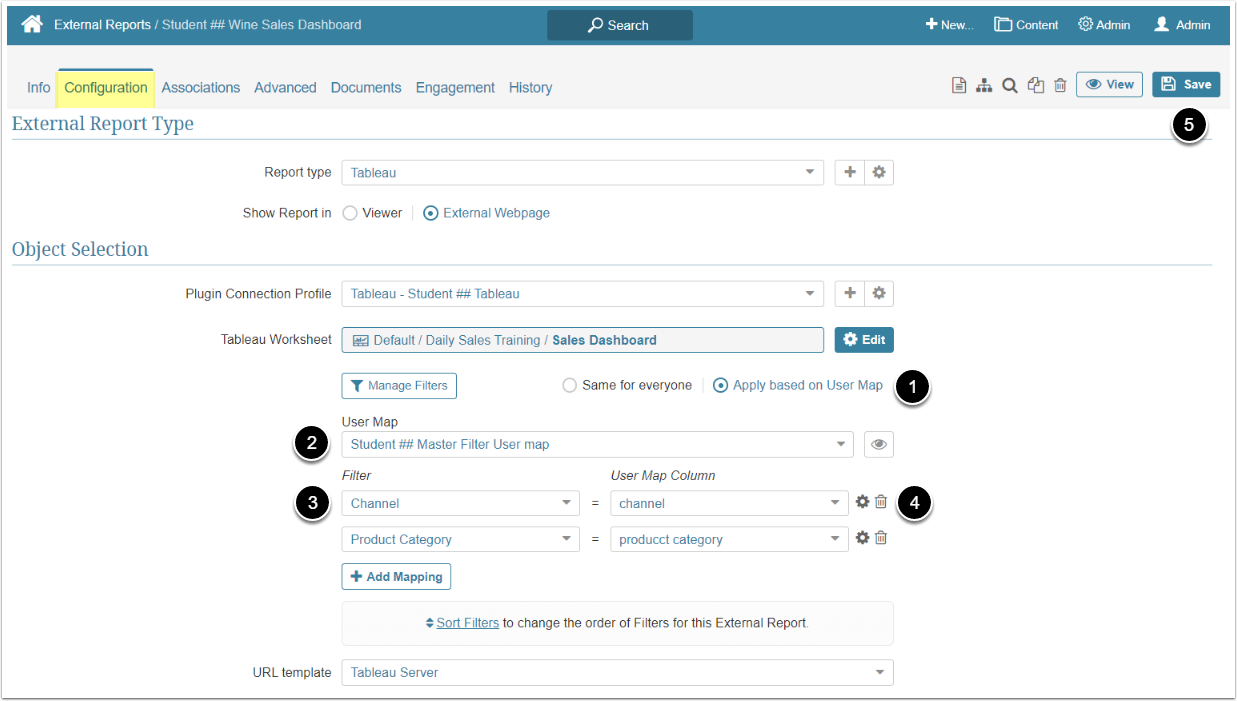
- Select Apply Based on User Map radio button
- User map: Choose the "<your name> Master Filter User Map" User Map you created
- Filter: Select the name of the filter, retrieved from the BI tool
- User Map Column: Choose the name of the column in the User Map to match the BI tool filter
- [Save]
You applied User Map to External Report. Now, when a User contained in the User Map enters the Homepage, this External Report will contain data for the filter value assigned to that person.
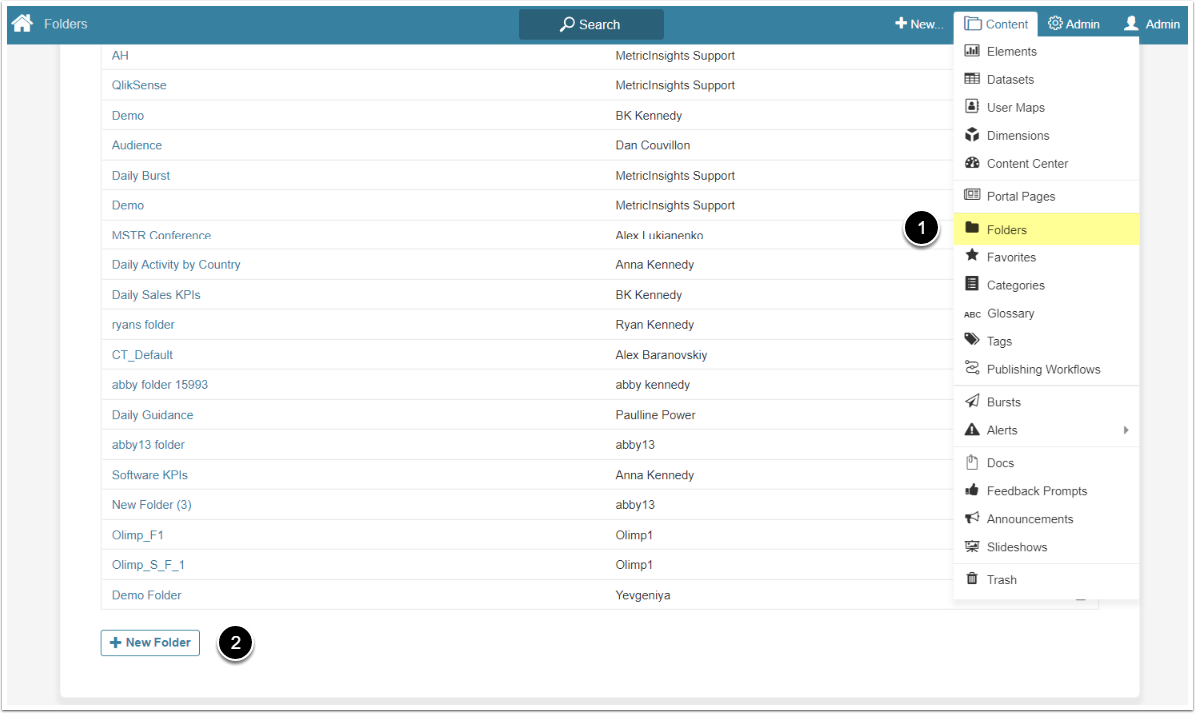
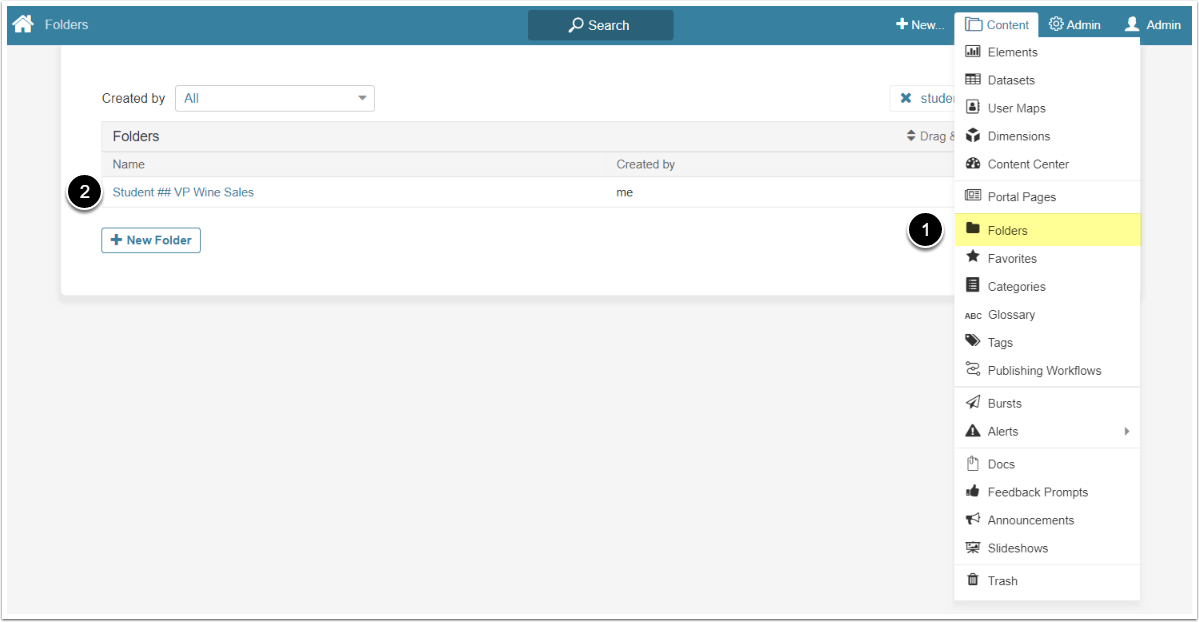
Folder is a section that is used to organize the content on the Homepage. Learn more about Folders from the Understanding Folders article.
A Folder can be created and associated with this External Report for the purposes of convenient workspace organization.
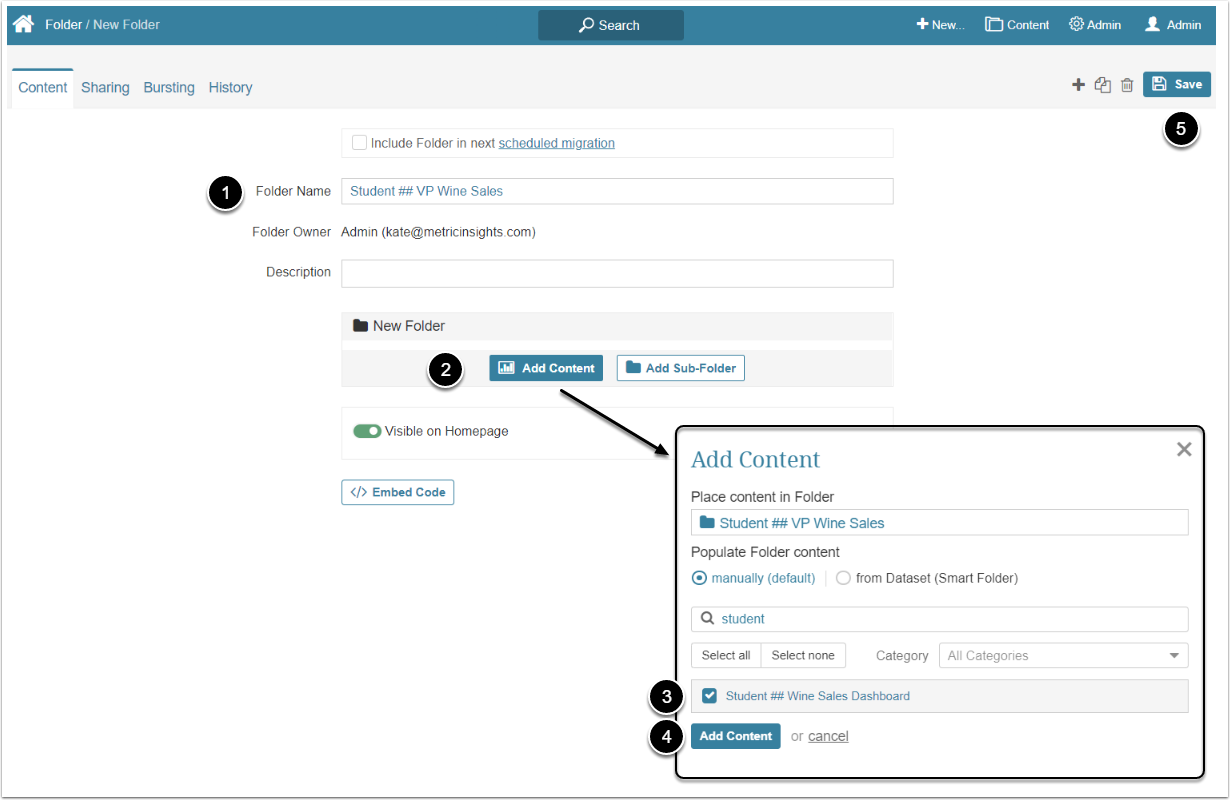
- Name: Name the Folder "<your name> VP Wine Sales". In this use case "Student ##" is used instead of a name
- [Add Content]
- Select the "<your name> Wine Sales Dashboard" Report
- [Add Content]
- [Save]
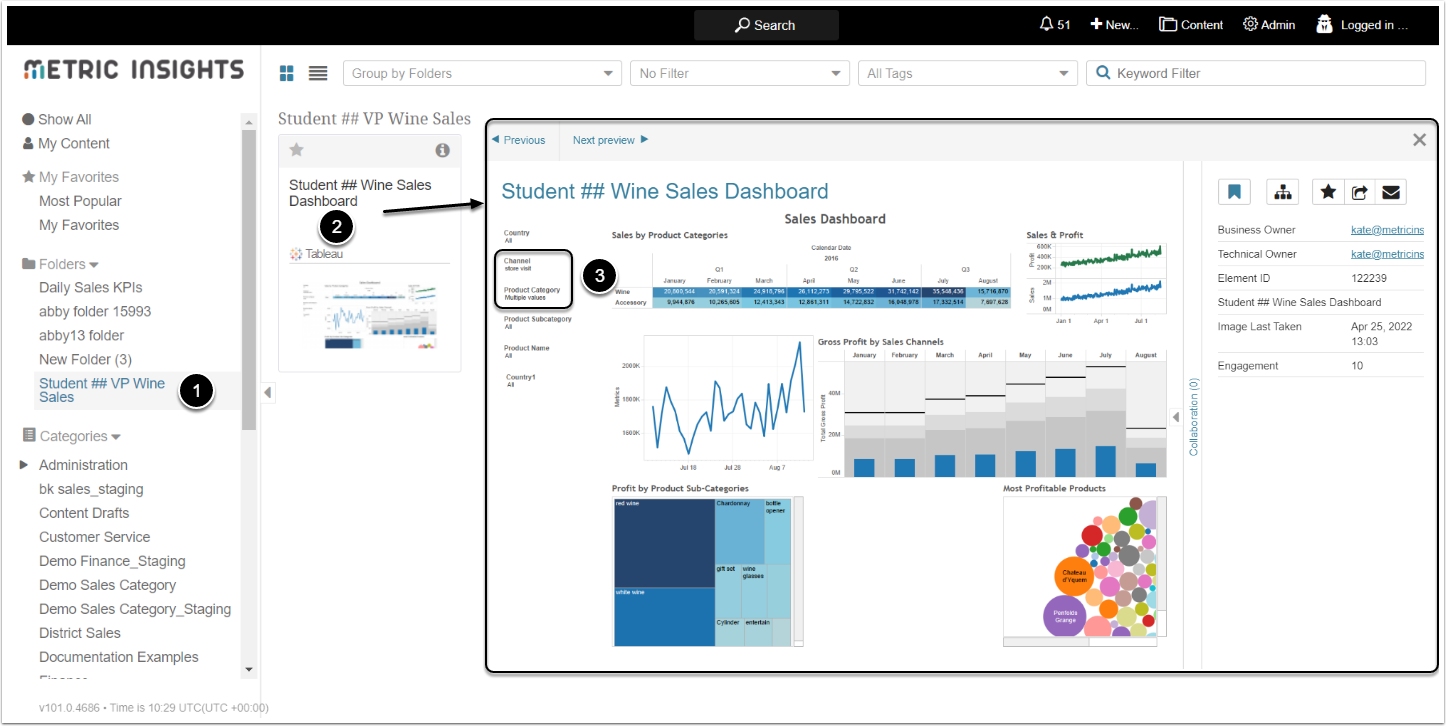
The new Folder will appear in the left sidebar of the Homepage, and the External Report you created will be visible in that Folder.
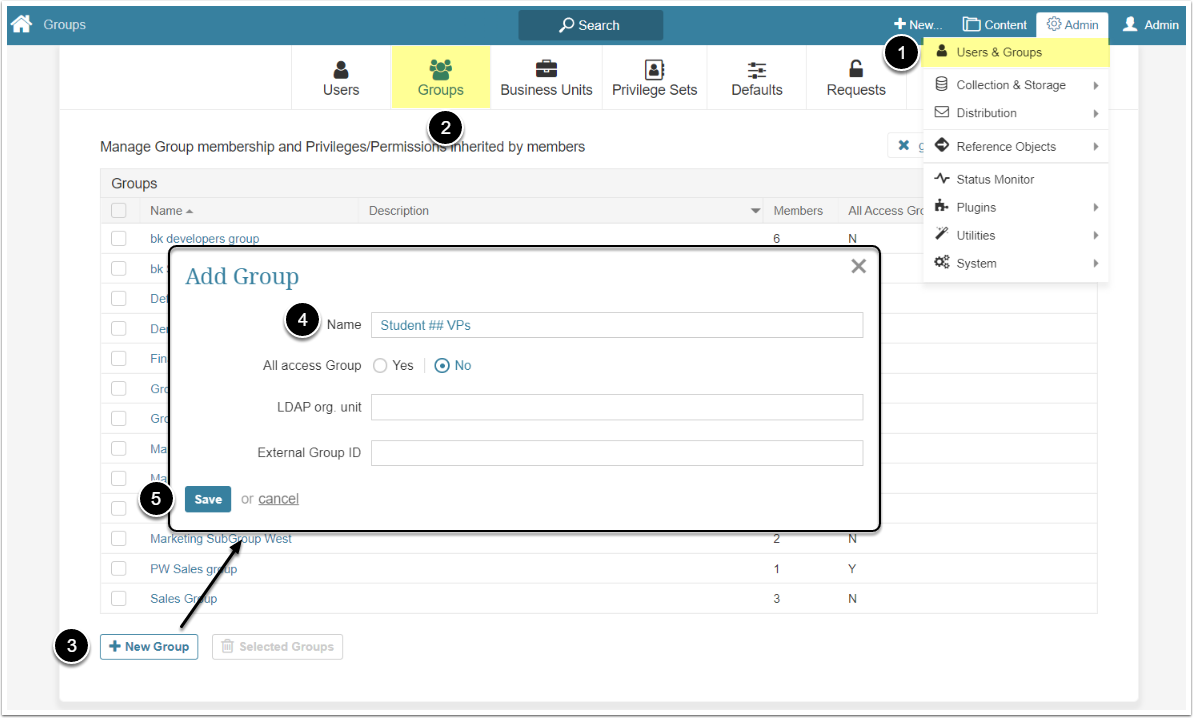
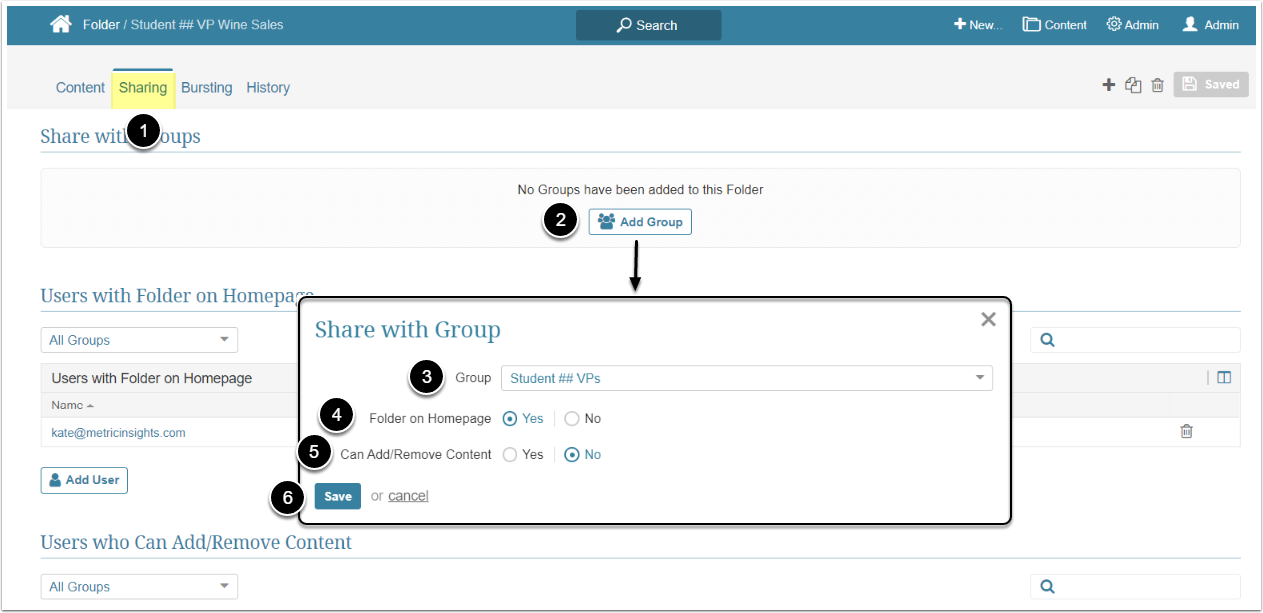
Control Access
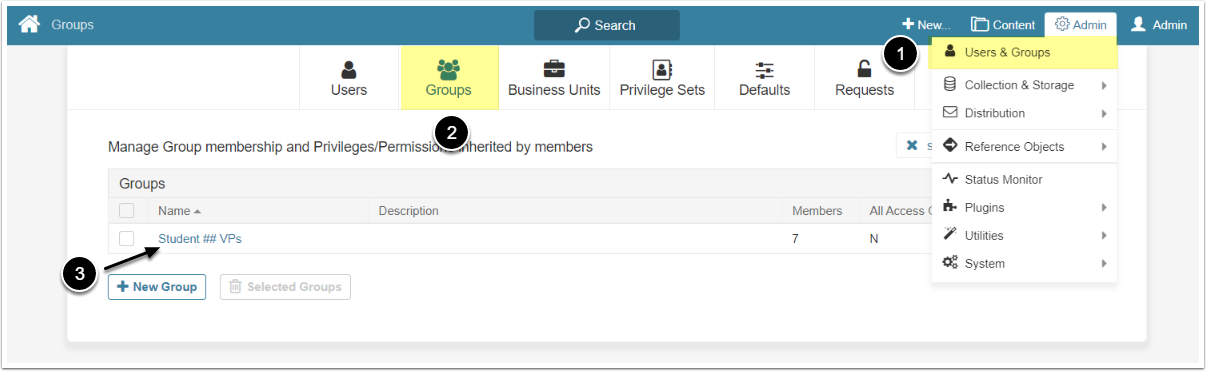
In this section you will create a User Group to control the access to the content you've just created by allowing the Users in the User Group to see that content. It is easier and faster than granting Permissions to each of those Users individually.
Users that are not added to the User Group and weren't granted an individual Permission won't be able to see the content.
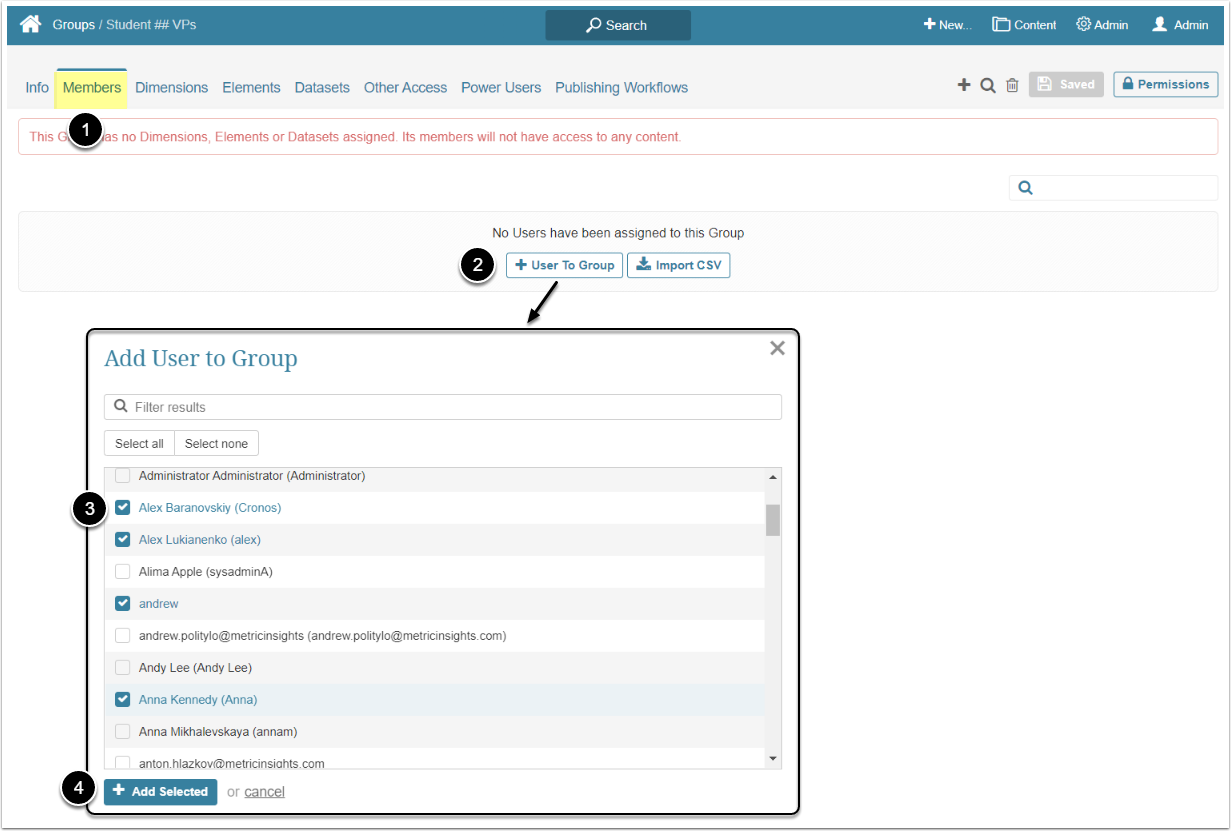
As an Admin, you can log into the accounts of created Users. Try to log in as a User to confirm that your settings work.
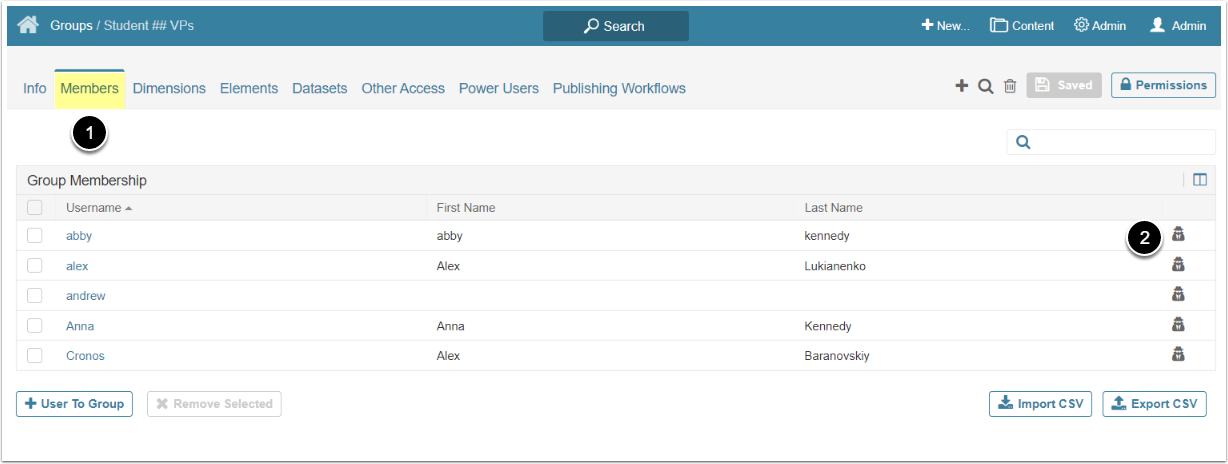
- Open Members tab
- If you are a Power User, than access Admin > Groups, click on the title of the created Group and open the Members tab
- Choose one of the Users added to the Group and click a "Log in as this user" icon in its row
Congratulations! You finished the workflow!