Create a Dataset View

Datasets are designed to serve as pool of data and as Data Sources for new Elements, such as Metrics and Reports. A set of filters applied to the Dataset can be stored as a Dataset View. This articles describes how to create a Dataset View.

This article answers the following questions:

  • How to create a View from the Dataset Viewer?
  • How to define additional rules and conditions by which to filter the data?

PREREQUISITES:

1. Create a New Dataset View

1.1. From the Views List

Access Content > Datasets > open Views tab

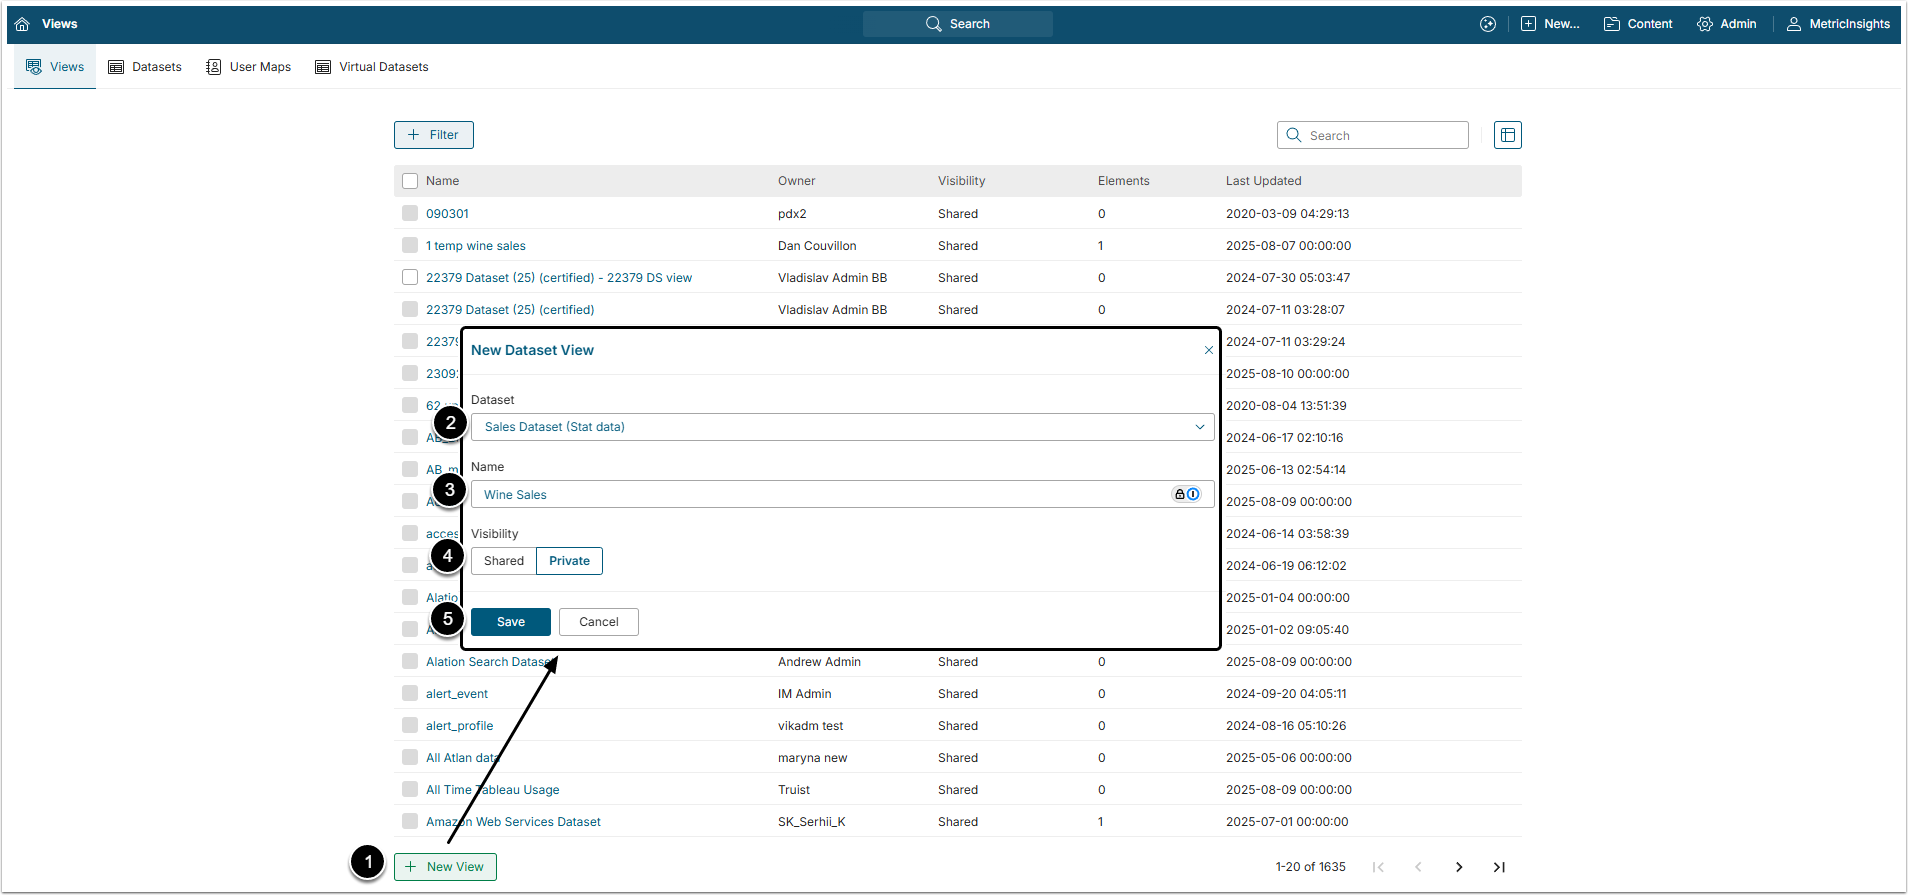
  1. [+New View] to open New Dataset View pop-up window
  2. Dataset: Select a Dataset from the drop-down menu
  3. Name: Give the View a descriptive name
  4. Visibility: Define whether you create this View for your own use or if it can be available for other users with permission to access the Dataset
    • Shared: Can be created by Admins and Power Users with the appropriate Privileges and Permissions (see Understanding Power Users) and accessed by anyone who can view the Dataset
      • Metrics and Reports can be created only from Public Views
    • Private:  Can only be accessed by Admins or the user who created the View
  5. [New Dataset View] to proceed to Viewer

1.2. From the Dataset Viewer

Access Content > Datasets > click the Dataset Active name link

Click [View] to open the Dataset Viewer. After setting the filters you can just click [Save As View] in the right upper corner of the window.

2. Choose Fields for the View

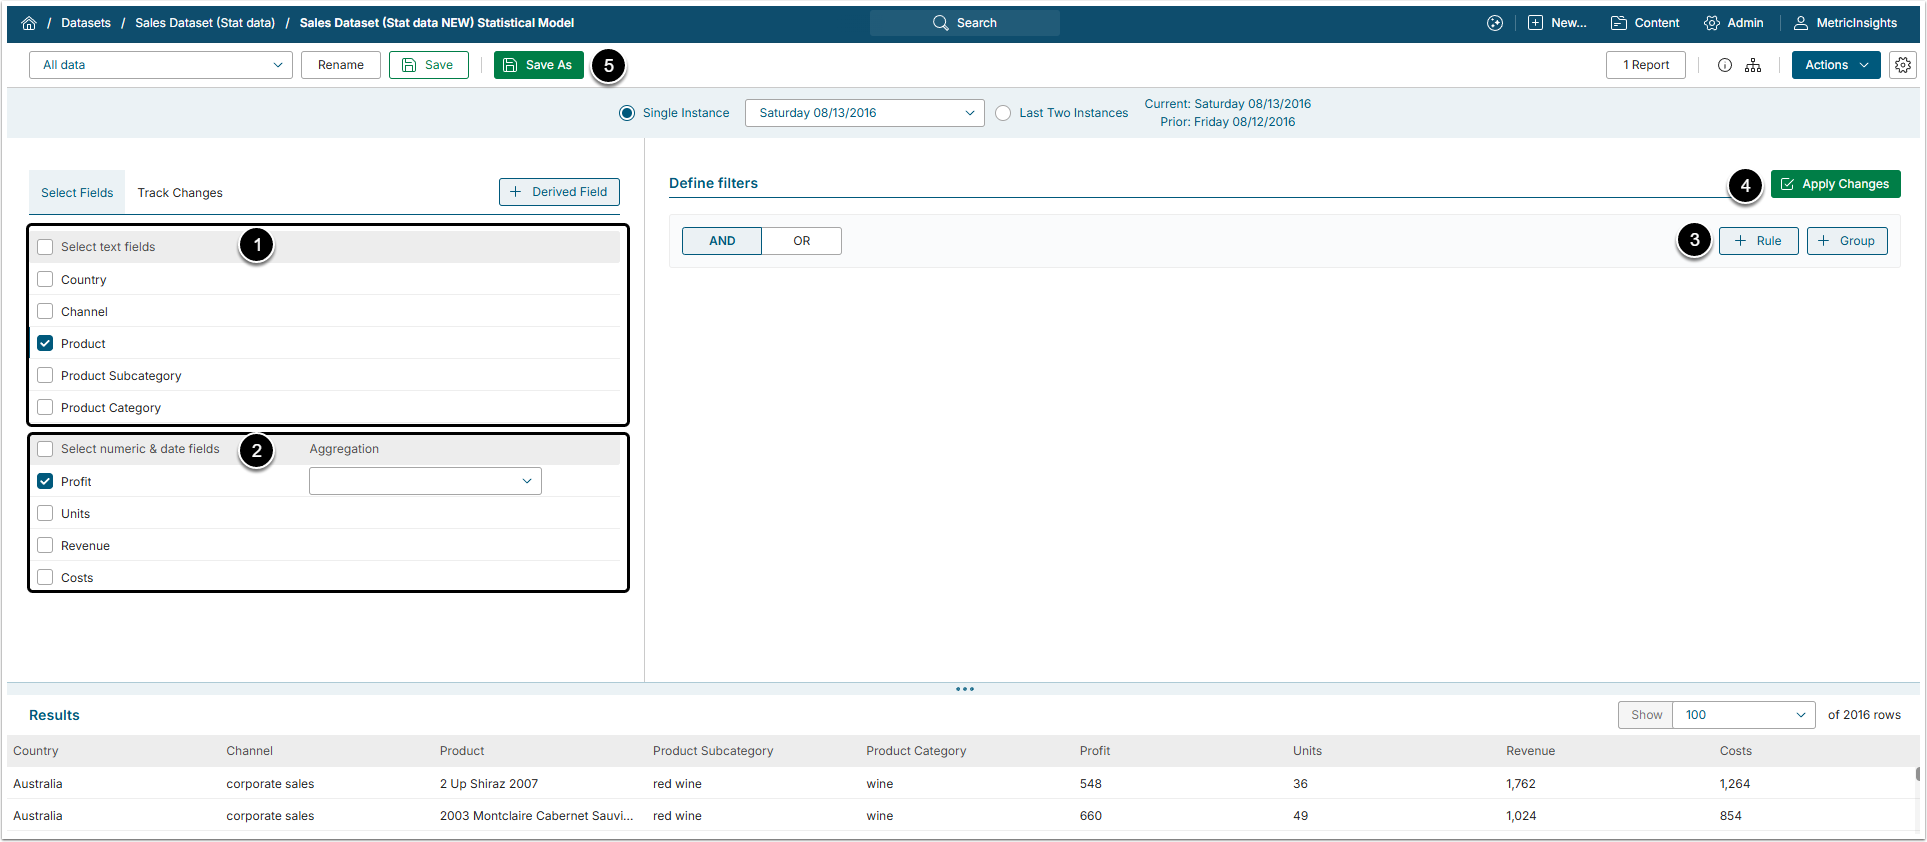
  1. Select text, date and numeric fields that should be included into your View
  2. Choose aggregation method for numeric fields (Sum, Avg, Min, Max, Count)
  3. Define additional Rules
  4. [Apply Changes] to limit the results set to the selected fields
  5. [Save] to see resulting table below
3. Example Rule Sets

Dataset Views allow seeding out the required information using conditional filtering. You may mix several simple or compound AND/OR Rules to focus on a highly specific data slice. The results set will be displayed right on the same page.

Let's review the use cases given below.

3.1. Example of Simple Filter criteria

Use Case: Show any product sales of more than $20,000 in Australia via corporate sales channel. Note that all of the filters are AND filters, since we want to find data matching all of these criteria.

  1. Select the following columns from the dataset for the view: Product Name, Channel, Country, Sales, Units, Sales Per Unit.
  2. Define filters: click [+ Rule] and define criteria for each new rule.
  3. Note that all of the filters are AND filters, since we need to find data matching ALL of these criteria.
  4. Apply Changes to update the Results

You may create a separate View out of this data slice by clicking Save as View at the top of the page.

Simple Filter criteria

3.2. Example of Compound Filter criteria

Use Case: Include any product sales for more than $20,000 in Canada for any channel OR for more than $10,000 in Australia for any channel.

  1. Select the following columns from the Dataset for the view: Product Name, Channel, Country, Sales, Units, Sales Per Unit.
  2. Define filters: Our use case consists of 2 groups of conditions: click [+ Group] and define criteria for the first and second group:
    • [Group 1]: country = Canada AND sales > 20,000
    • [Group 2]: country = Australia AND sales > 10,000
  3. Choose the OR filter to define relations between the Groups
  4. Apply Changes to update the Results set

You may create a separate View out of this data slice by clicking Save as View at the top of the page.

Compound Filter criteria