IMPORTANT:
Creating Power BI Groups to Users Dataset (Step 1) requires the Microsoft Graph Group.Read.All and User.ReadBasic.All permissions:
- for Password authentication – under Delegated permissions.
- for OAuth or Service Principal authentication – under Application permissions.
This article details how to configure the BI Optimizer App for Power BI in Metric Insights.
PREREQUISITES:
- Configure Lineage Collection from Power BI and Log Analytics.
IMPORTANT: Complete ALL steps of this article to set up Power BI Lineage and Log Analytics specifically for use with Metric Insights:- Grant the Tenant.Read.All permission; (Why BI Optimizer Requires Tenant.Read.All Permission?)
- Configure Metric Insights.
- The following files requested from Metric Insights support:
- BI Optimizer Custom Script;
- Run Sync Metadata Custom Script;
- BI Optimizer App Template Assets.
- The DEFAULT_DATASET_TEXT_COLUMN_SIZE System Variable set to "4100";
- Synced Metadata under the Metadata tab for the Power BI Data Source that is to be optimized.
IMPORTANT: Note the Data Source ID for use in Step 6.1. - Existing Notification Schedule.
NOTE: The frequency must be set to at least once per day, but it is recommended to configure it to run every two hours; - Configured External Application for the Custom Script. The Application must have "Application Can Manage Users" enabled.
IMPORTANT: If BI Optimizer is already configured for another Data Source, complete Step 1, Step 2, and Step 6.1, then run the Report Cleanup Custom Script.
1. Create Power BI Datasets for Assets
- Access +New > Dataset > Create New
- Under Data Source, select the name of the Power BI Data Source to be optimized
NOTE: "USAGE, USER_PERMISSIONS" must be listed under the Scope: Types to collect Optional Parameter for the Power BI Data Source for the following objects to be collected.
Create the following Datasets:
It is recommended to use the same naming convention to make the instructions easier to follow.
- Power BI Usage Dataset from System/Usage report;
NOTE:- Use the following statement in the MDX / DAX query Editor:
param usage_date_to_collect = :measurement_time
fields = CreationTime, UserId, ReportId, ReportName, WorkSpaceName
filter = ReportId is not null- Enable Snapshot Dataset? (keep history) for this Dataset;
- Make sure Include current Day is disabled;
- Make sure the DEFAULT_DATASET_TEXT_COLUMN_SIZE System Variable is set to "4100".
- You can collect the last 30 days historical instances. This is useful for BI Ops calculations.
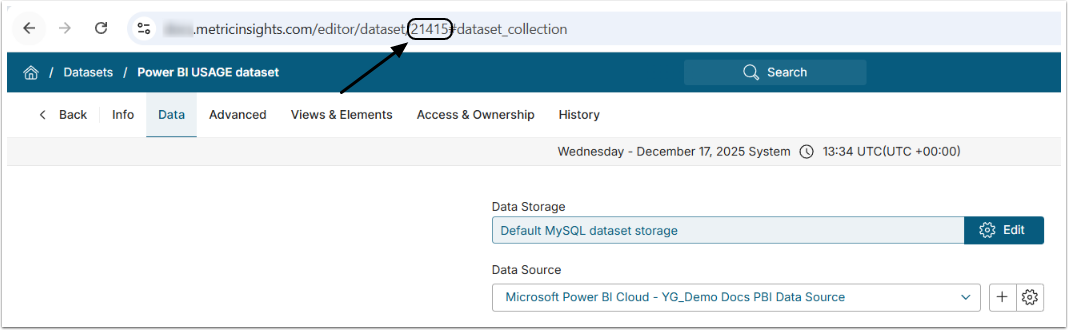
- IMPORTANT: Note the Dataset ID to be used in Step 2.1 and Step 2.2.
2. Power BI User Permissions Dataset from System/Users Permissions report. This Dataset maps Power BI Objects to users and their respective access rights.
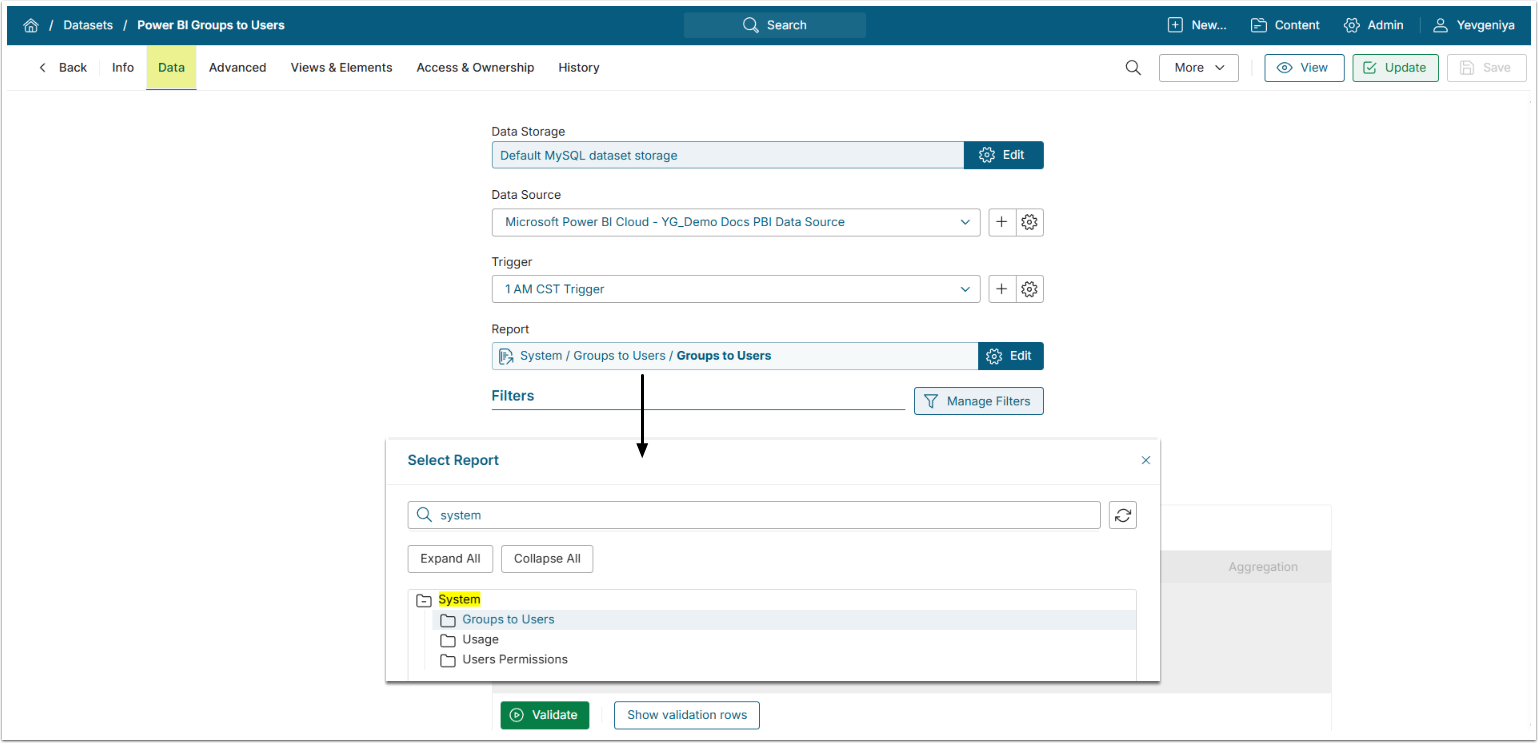
3. Power BI Groups to Users Dataset from System/Groups to Users report. This Dataset maps all users to their Power BI groups. It must include Group ID and User ID columns.
- Make sure Group.Read.All and User.ReadBasic.All permissions are enabled.
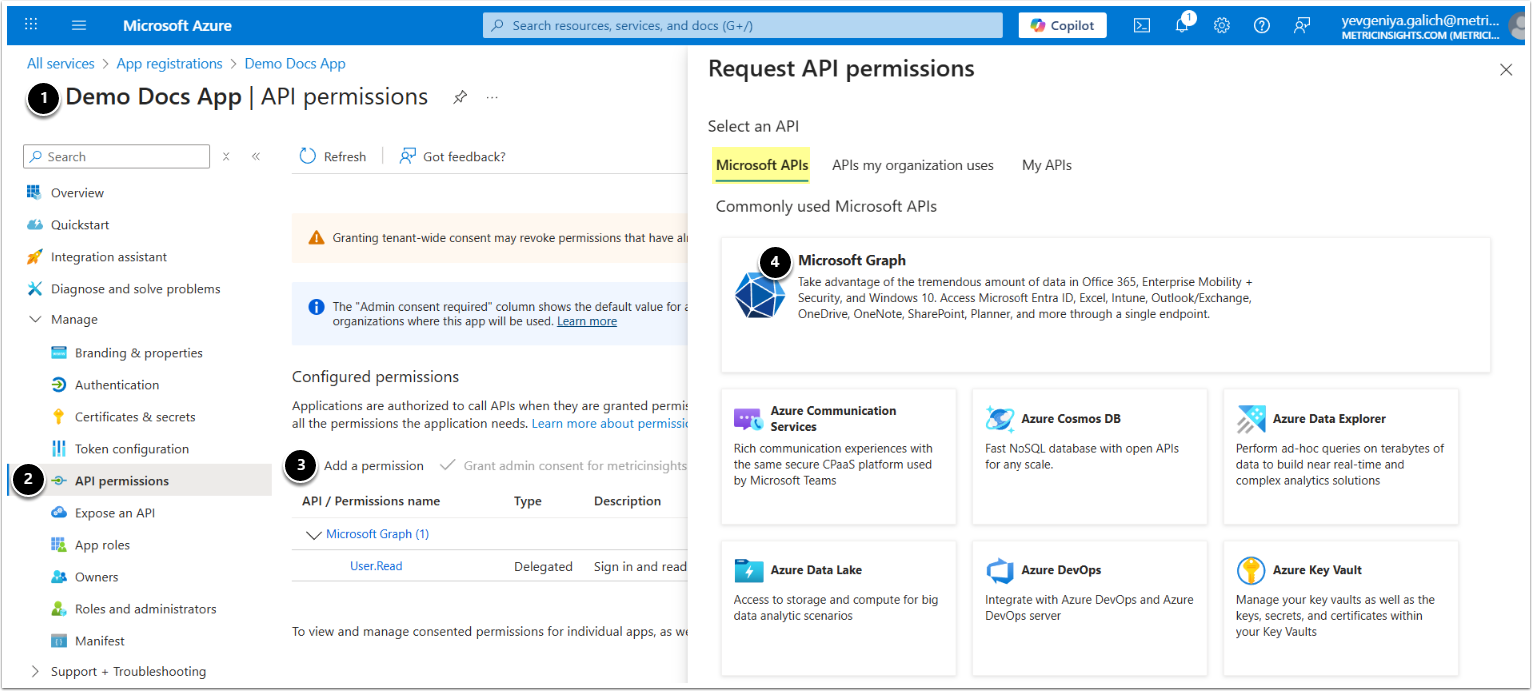
- From Azure portal, access your app.
- Go to API permissions.
- Click +Add a permission.
- Under Microsoft APIs, proceed with Microsoft Graph.
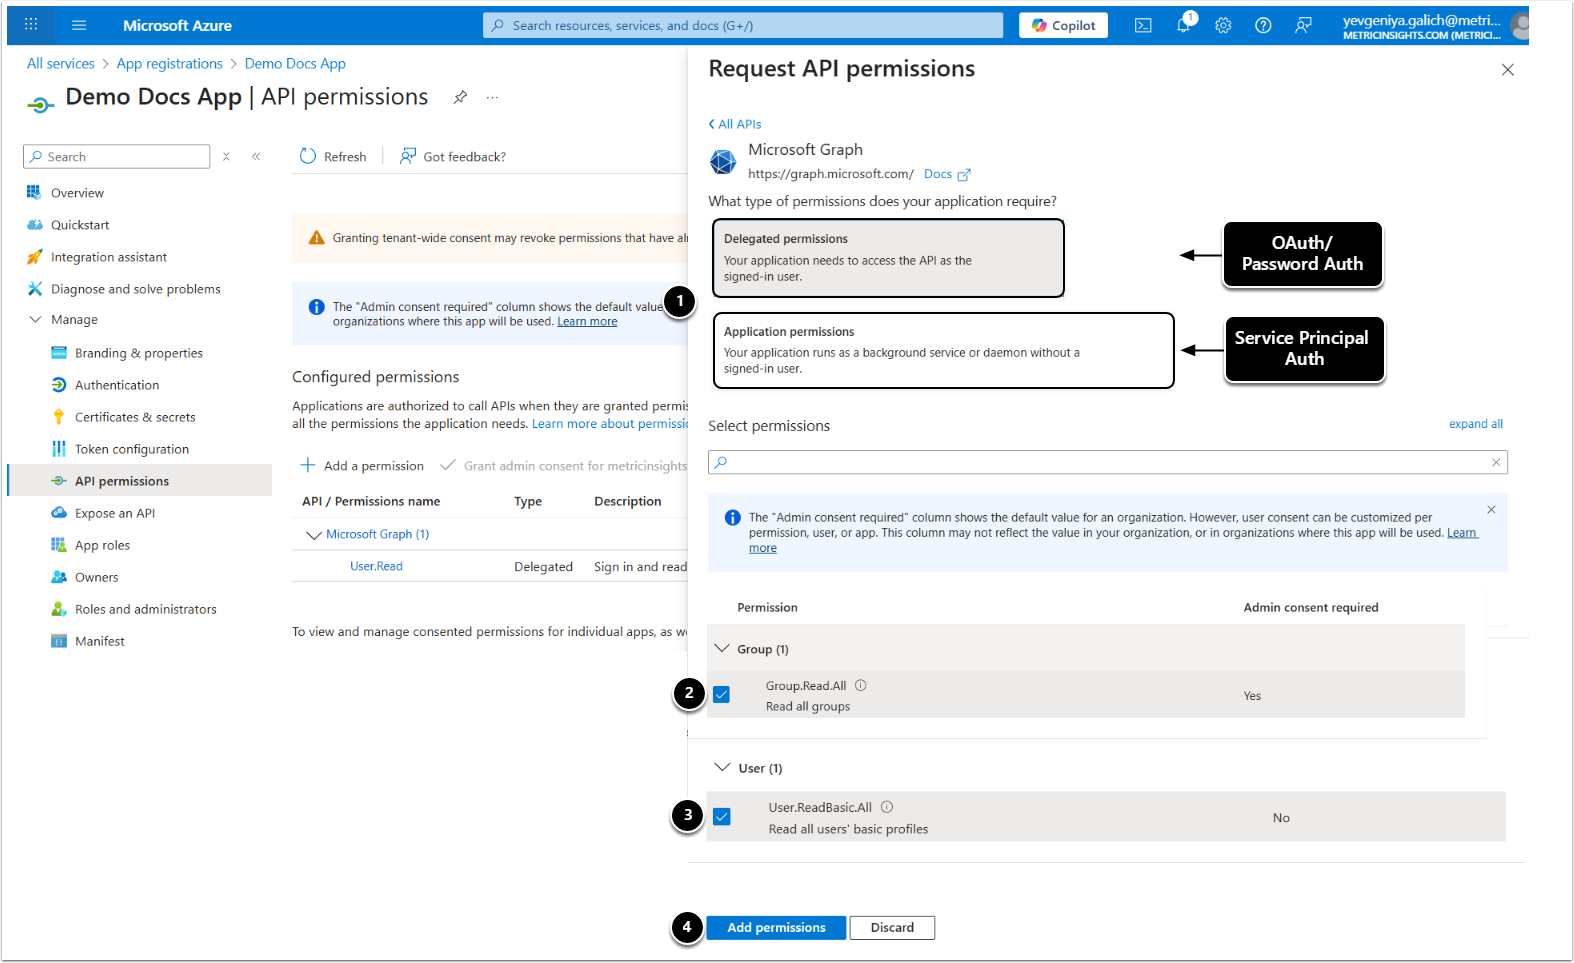
- Depending on your Auth type, select Delegated or Application permissions.
- Add Group.Read.All.
- Add User.ReadBasic.All.
- [Add permissions]
NOTE: If BI Optimizer is already running for another Data Source, proceed to Step 6.1.
For more details on how to create Power BI Datasets, refer to Create a Dataset from Microsoft Power BI Cloud.
2. Create Derived Datasets from Power BI Usage Dataset:
2.1. Usage by Month Dataset
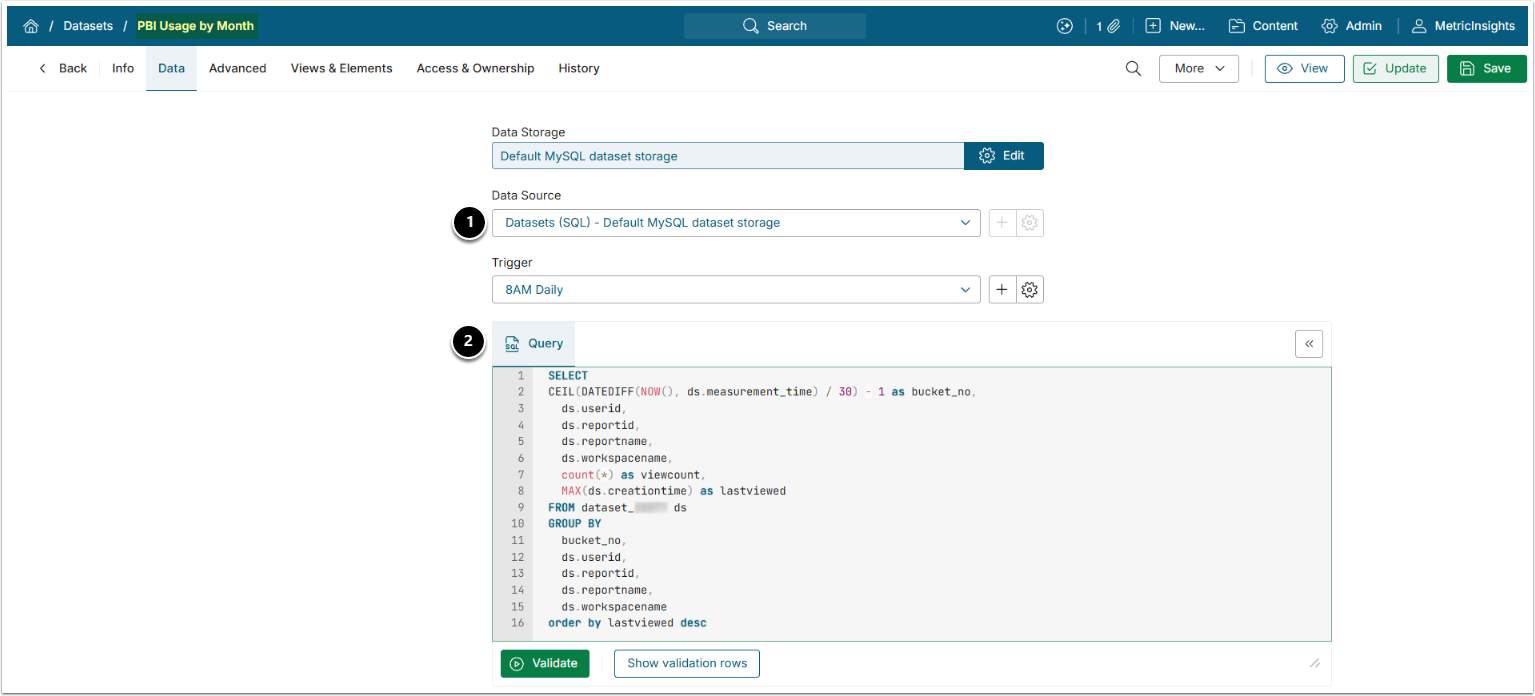
- Select the storage you used to save Power BI Usage Dataset in Step 1 as Dataset Source.
- Use the following Query:
- where
dataset_XXXis Power BI Usage Dataset.
- where
SELECT
CEIL(DATEDIFF(NOW(), ds.measurement_time) / 30) - 1 as bucket_no,
  ds.userid,
  ds.reportid,
  ds.reportname,
  ds.workspacename,
  count(*) as viewcount,
  MAX(ds.creationtime) as lastviewed
FROM dataset_XXX ds
GROUP BY
  bucket_no,
  ds.userid,
  ds.reportid,
  ds.reportname,
  ds.workspacename
order by lastviewed desc
2.2. Power BI Last Viewed by Username Dataset
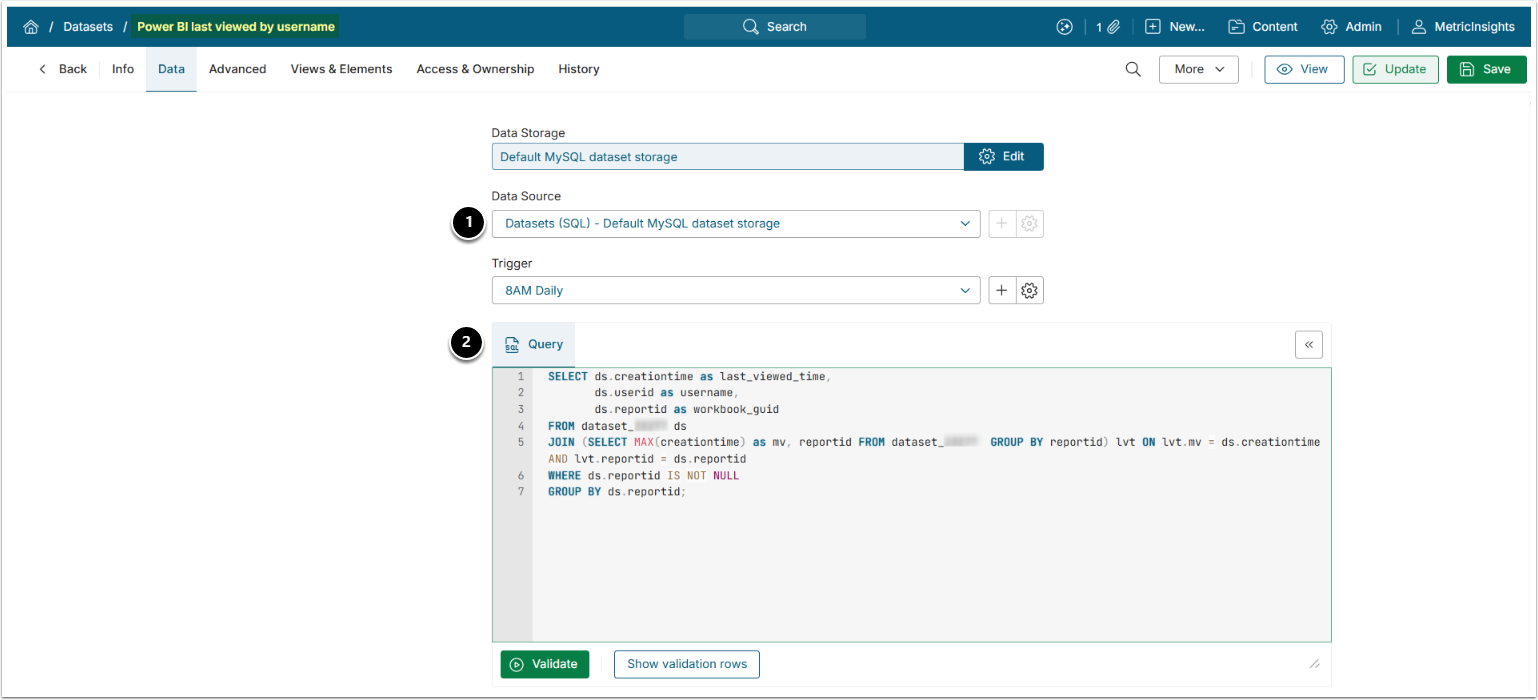
- Select the storage you used to save Power BI Usage Dataset in Step 1 as Dataset Source.
- Use the following Query:
- where
dataset_XXXis Power BI Usage Dataset.
- where
SELECT ds.creationtime as last_viewed_time,
       ds.userid as username,
       ds.reportid as workbook_guid
FROM dataset_XXX ds
JOIN (SELECT MAX(creationtime) as mv, reportid FROM dataset_XXX  GROUP BY reportid) lvt ON lvt.mv = ds.creationtime AND lvt.reportid = ds.reportid
WHERE ds.reportid IS NOT NULL
GROUP BY ds.reportid;
3. Create Empty CSV Datasets for App Template Entities and "Why Similar Storage" Variable
Access +New > Dataset > CSV Dataset
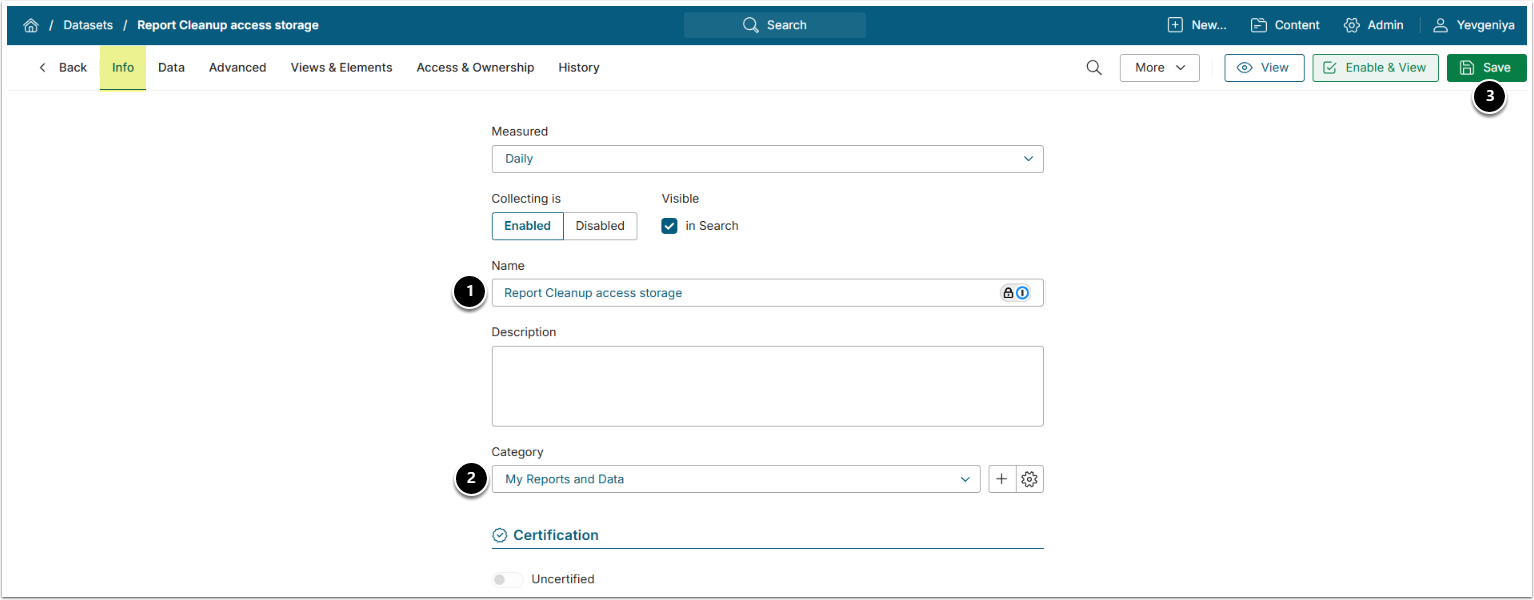
- Provide a descriptive Name. It is recommended to use the same naming convention to make the instructions easier to follow.
- Datasets to be created for App Template Entities:
- Report Cleanup access storage – for the
accessDataEntity; - Report Cleanup excluded storage – for the
excludedRollupsEntity; - Report Cleanup group data storage – for the
groupToUserDataEntity; - Report Cleanup processor storage – for the
processorDataEntity; - Report Cleanup unused storage – for the
unusedInfoEntity.
- Report Cleanup access storage – for the
- Datasets to be created for Why Similar Storage variable:
- Report Cleanup Criteria – for the
criteriaDatasetIdproperty; - Report Cleanup Criteria Hash – for the
reportHashDatasetIdproperty; - Report Cleanup Multipliers – for the
multipliersDatasetIdproperty.- IMPORTANT: Note the Dataset IDs required in Step 5.1.
- Report Cleanup Criteria – for the
- Datasets to be created for App Template Entities:
- Choose a Category for the Dataset.
- [Save]
4. Create CSV Dataset for Custom Script
Access +New > Dataset > CSV Dataset
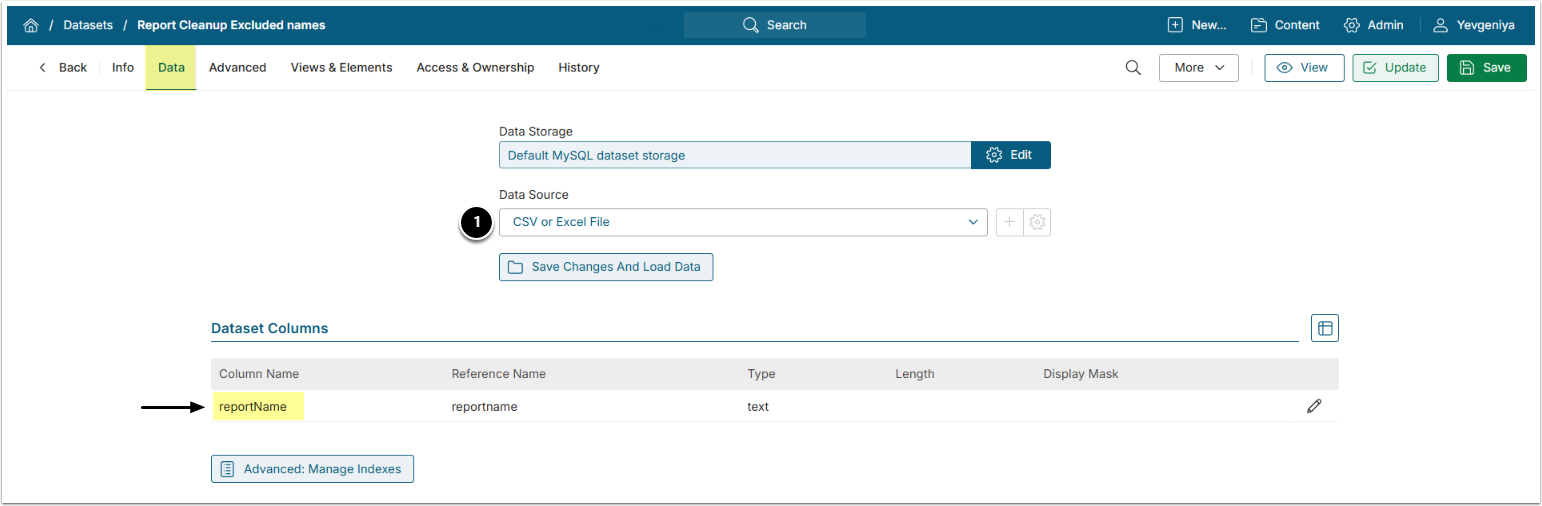
- Create a CSV Dataset by uploading a CSV file with one column,
reportName. This Dataset is only needed if you want to exclude specific Reports from the optimization. If you use it, make sure to include at least one Report Name.- As a Dataset Name, it is recommended to use Report Cleanup Excluded names to make the instructions easier to follow.
- NOTE: Names are not case sensitive. For example, "sales report" will exclude both "sales report" and "Sales Report".
- IMPORTANT: Note the Dataset ID for use in Step 6.2. If you don't need to exclude any Reports, the Parameter can be left blank.
For more details on how to create CSV Datasets, refer to Create a Dataset from CSV File.
5. Create App Template
Access Content > Apps > Templates tab > [+New Template]
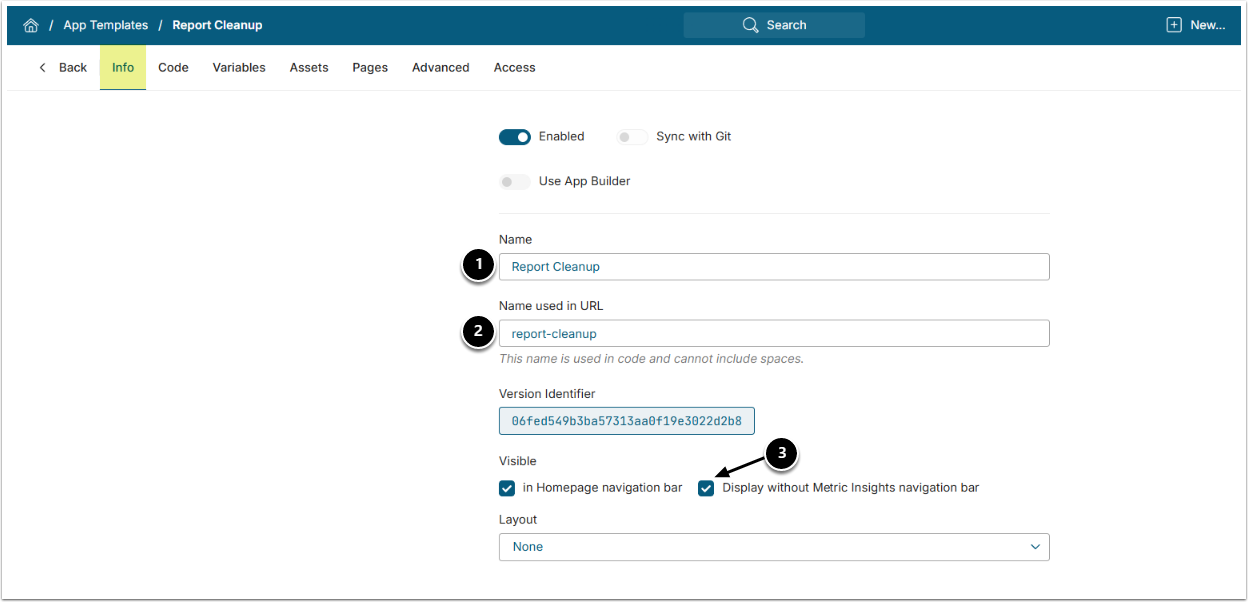
- Provide a descriptive Name such as "Report Cleanup".
- Name used in URL must be set to "report-cleanup".
- Display without Metric Insights navigation bar must be checked.
5.1. Upload Assets
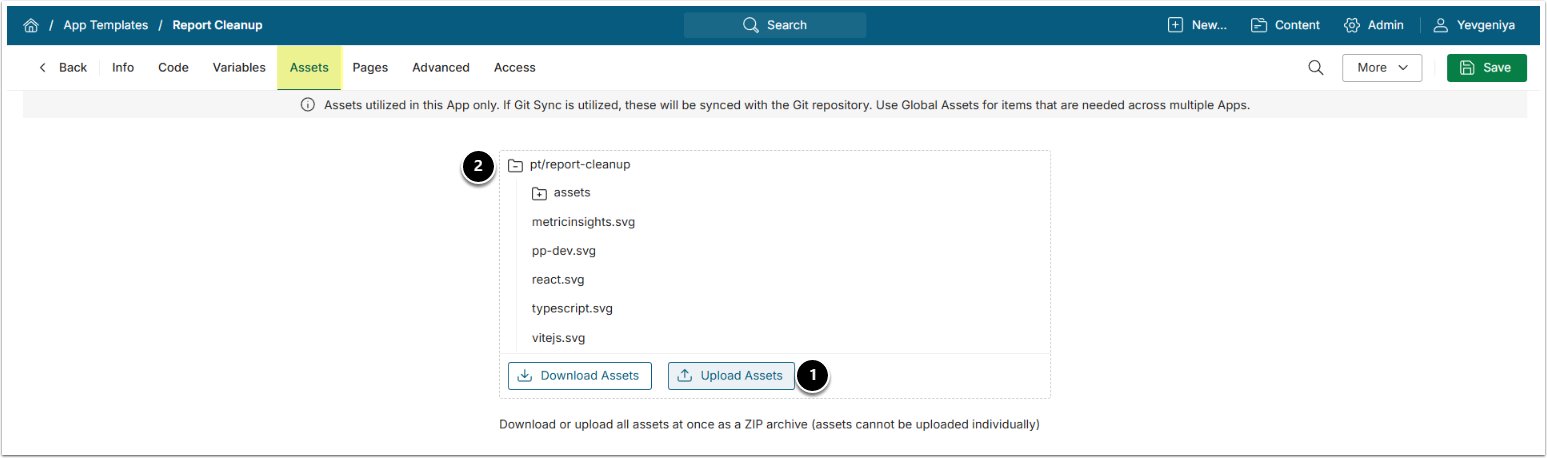
- From the Assets tab, upload the Assets requested from Metric Insights Support as part of the prerequisites.
- The uploaded Assets will appear as a list.
6. Create App Based on this Template
Access Content > Apps > [+New App]
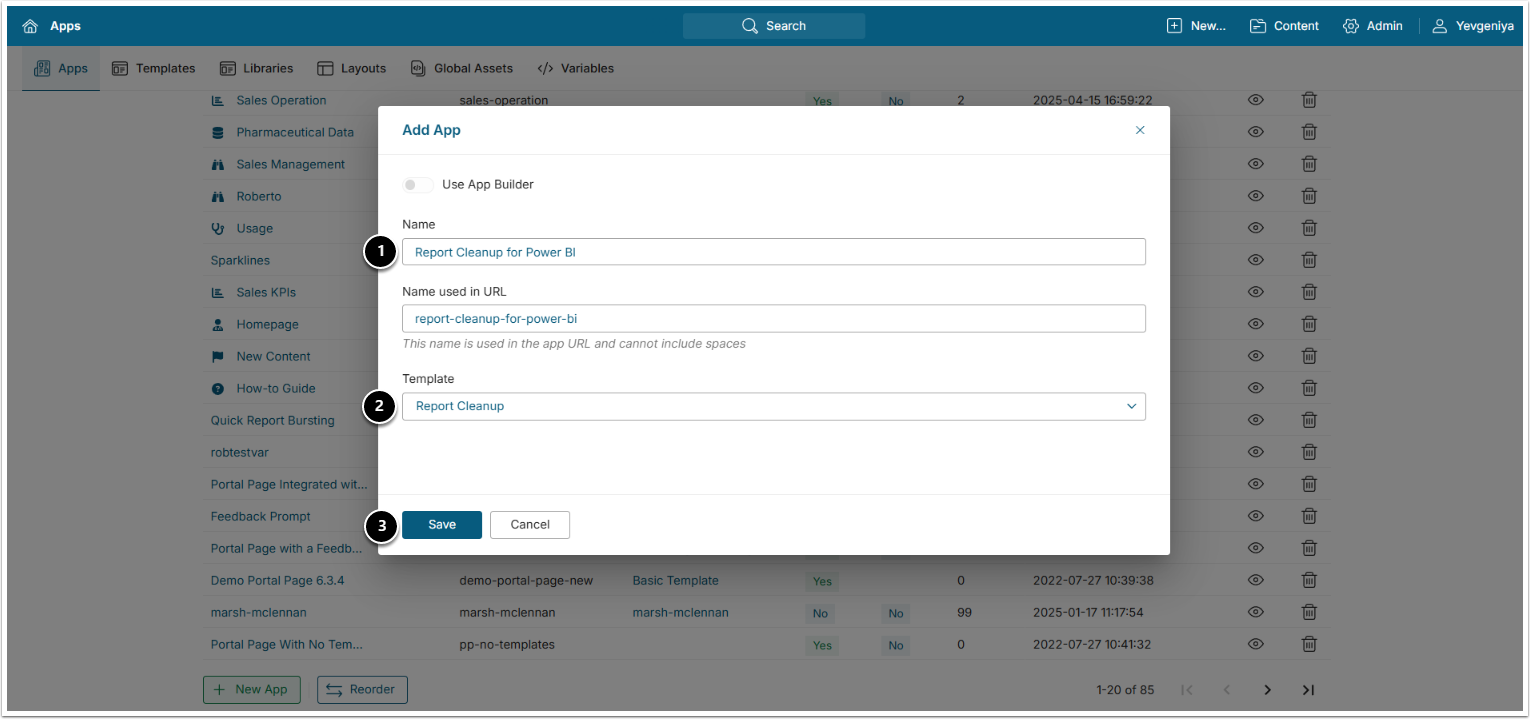
- Provide a descriptive Name.
- Choose the Template created at Step 5.
- [Save]
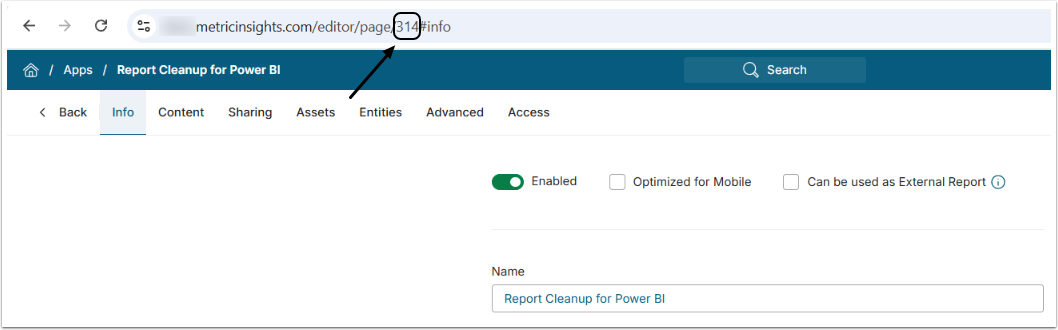
- IMPORTANT: Note the App ID to be used in Steps 7.2 and 8.2. See below.
6.1. Add Variables
Access the Content tab
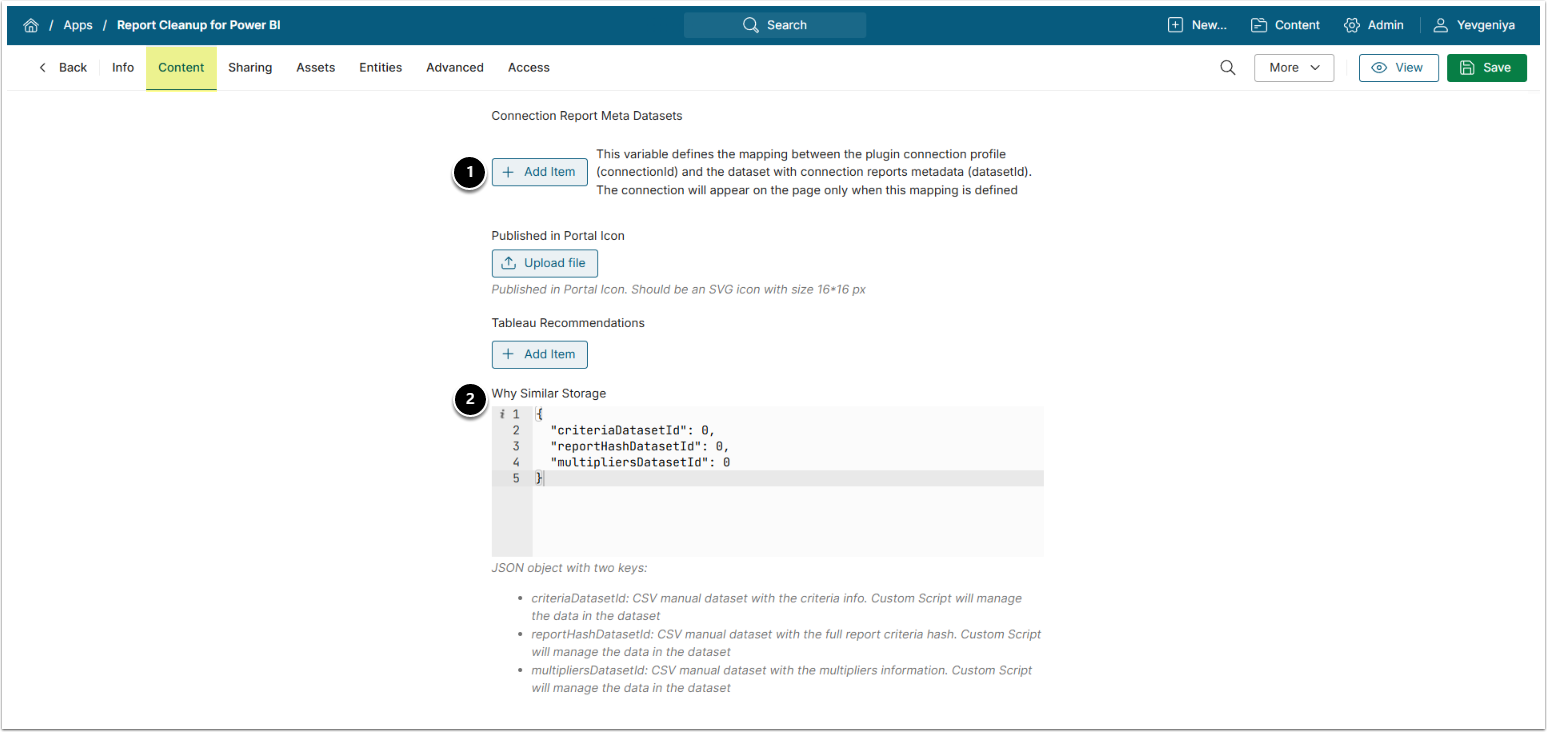
- [+Add Item], then fill in the following fields where needed:
| Property | Description | Value |
|---|---|---|
connectionId | The ID of the Power BI data source to be optimized | |
datasetId | PBI Usage by Month (see Step 2.1) | |
workbookLuidKey | Column name for the Workbook LUID key from the datasetID (above) | default: ReportId |
rollupNameKey | Column name for the Rollup name key from the datasetID (above) | default: WorkSpaceName |
reportNameKey | Column name for the Report name key from the datasetID (above) | default: ReportName |
accessListDatasetId | Power BI User Permissions Dataset (see Step 1) | |
accessListKeysMapping | Mapping of the Access List Dataset keys to the connection report metadata Dataset keys. The mapping should be in JSON formatting. The keys in the object must be the keys (column names) from the The value must be one of the following: For help with this variable, contact Metric Insights support. | Copy / Paste from the accessListKeysMapping code block below. |
groupToUserDatasetId | Power BI Groups to Users Dataset (see Step 1) | |
groupToUserKeysMapping | Mapping of the group to user Dataset keys to the connection report metadata Dataset keys. The mapping should be in JSON formatting. The keys in the object must be the keys (column names) from the The value must be one of the following: See the example on the right for reference: | |
lastViewedDatasetId | Power BI last viewed by username (see Step 2.2) | |
lastViewedKeysMapping |
|
{
  "Email Address": "username",
  "Display Name":
  [
    {
      "name": "groupName",
      "$value":
      {
        "type": "ternary",
        "condition":
        {
          "left":
          {
            "type": "field",
            "name": "Principal Type"
          },
          "operator": "==",
          "right":
          {
            "type": "value",
            "value": "Group"
          }
        },
        "ifTrue":
        {
          "type": "field",
          "name": "Display Name"
        },
        "ifFalse": ""
      }
    },
    {
      "name": "fullName",
      "$value":
      {
        "type": "ternary",
        "condition":
        {
          "left":
          {
            "type": "field",
            "name": "Principal Type"
          },
          "operator": "==",
          "right":
          {
            "type": "value",
            "value": "User"
          }
        },
        "ifTrue":
        {
          "type": "field",
          "name": "Display Name"
        },
        "ifFalse": ""
      }
    }
  ],
  "project": "rollupNameKey",
  "workbook": "reportNameKey",
  "Access Right":
  {
    "name": "permission",
    "value":
    {
      "[DEFAULT]": true
    }
  },
  "Report ID": "guid"
}2. "Why Similar Storage" variable, fill in the IDs for the Datasets created in Step 3, strictly following JSON formatting:
criteriaDatasetId– Report Cleanup Criteria Dataset ID;reportHashDatasetId– Report Cleanup Criteria Hash Dataset ID;multipliersDatasetId– Report Cleanup Multipliers Dataset ID.
3. [Save]
6.2. Add Entities
Access the Entities tab
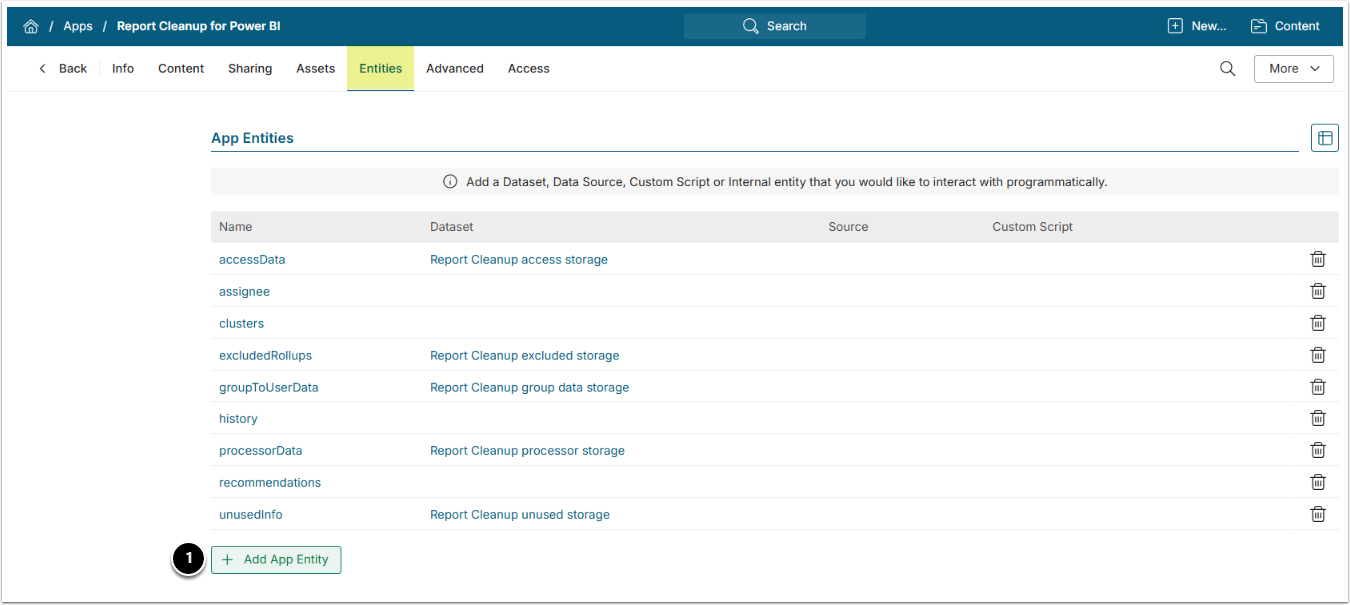
- [+Add App Entity], then the following Entities and configure them accordingly.
| Entity Name | "Type" | "Access Type" | "App Dataset" | Dataset |
|---|---|---|---|---|
accessData |
Internal | Public | Y | Report Cleanup access storage |
assignee |
Internal | Public | ||
clusters |
Internal | Public | ||
excludedRollups |
Internal | Public | Y | Report Cleanup excluded storage |
groupToUserData |
Internal | Public | Y | Report Cleanup group data storage |
history |
Internal | Public | ||
processorData |
Internal | Public | Y | Report Cleanup processor storage |
recommendations |
Internal | Public | ||
unusedInfo |
Internal | Public | Y | Report Cleanup unused storage |
NOTE: If BI Optimizer is already running, test-run the Custom Script.
7. Create Run Sync Metadata Custom Script
Metadata refresh does not run automatically and does not depend on other refresh triggers. To run metadata refresh automatically, you must configure the Run Sync Metadata Custom Script and associate it with a daily Notification Schedule. This section explains how to do that.
Access Admin > System > Custom Scripts > [+New Custom Script]
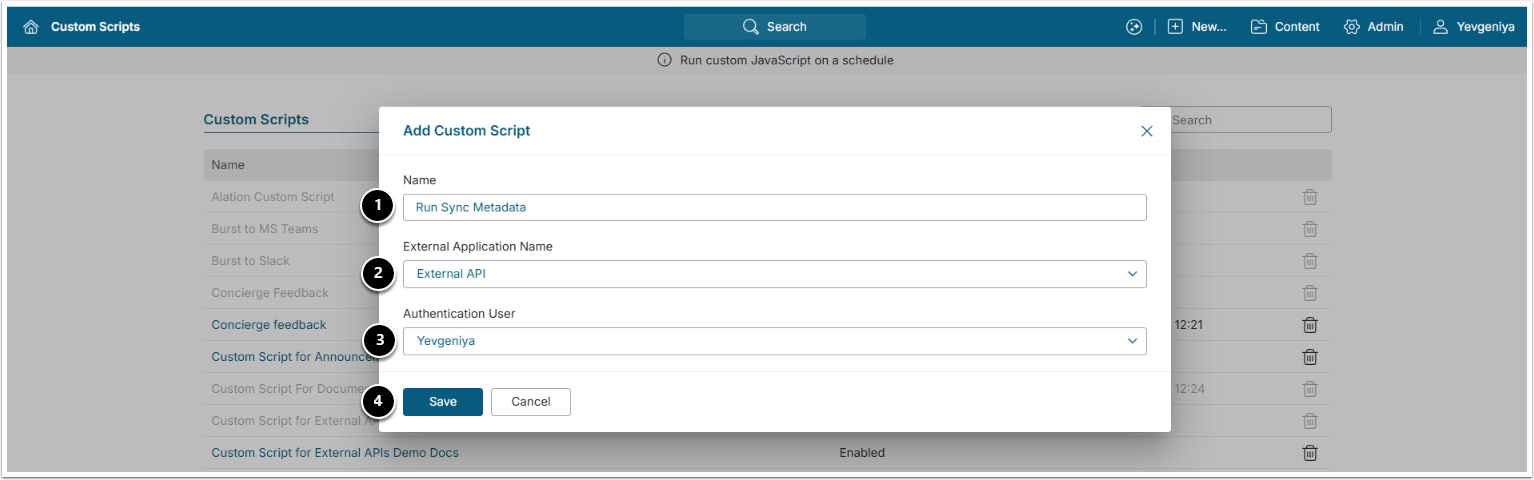
- Provide a descriptive Name such as Run Sync Metadata.
- Choose an External Application (See prerequisites above).
- Specify an Authentication User (Admin or System Admin).
- [Save]
7.1. Add Parameters
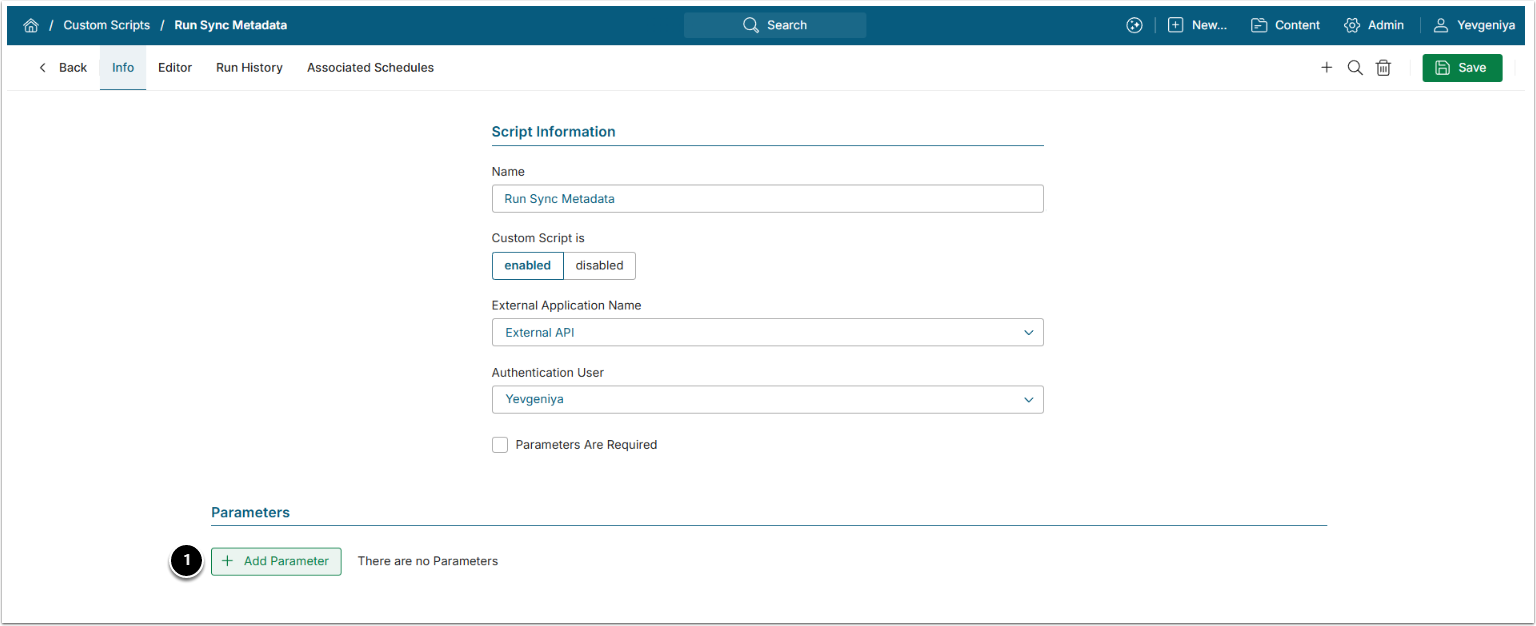
- From the Info tab, [+Add Parameters], then add the following Parameters and configure them accordingly.
| Name | Type | Required | Default | Available Values |
logLevel | String | Y | info | debug,info,warn,error,emergency,silent |
pageId | Number | Y | ||
scriptTimeout | Number | Y | 600000 |
7.2. Add Parameter Set
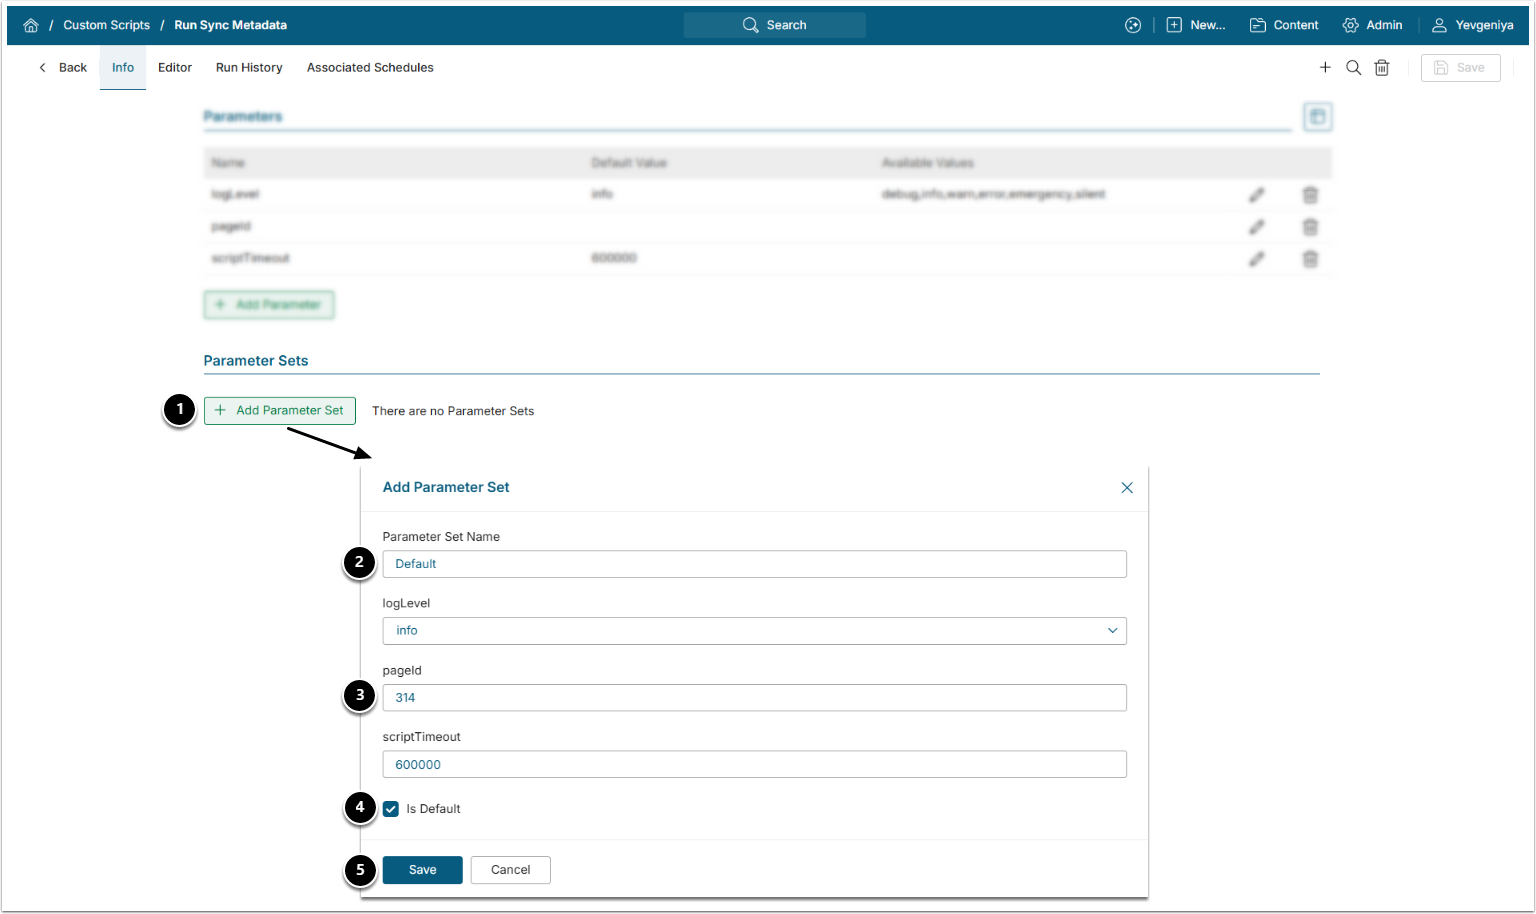
- [+Add Parameters Set]
- Provide a descriptive Name like Default.
- Provide the ID of the App configured at Step 6.
- Enable Is Default.
- [Save]
- If you have any questions, contact our support at support@metricinsights.com.
7.3. Add Custom Script Code and Run Script
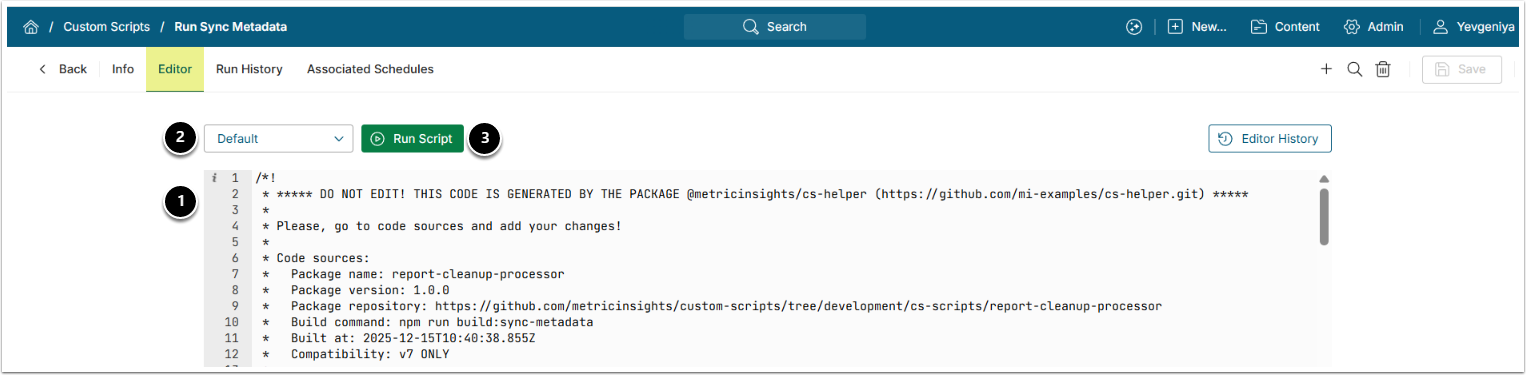
- Under the Editor tab, copy and paste the code from the Run Sync Metadata Custom Script file requested from our support team.
- Select the Parameter Set.
- [Run Script]
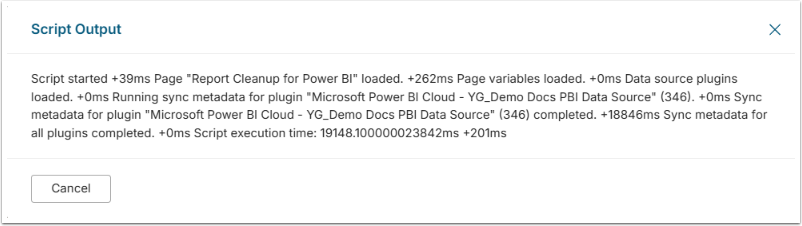
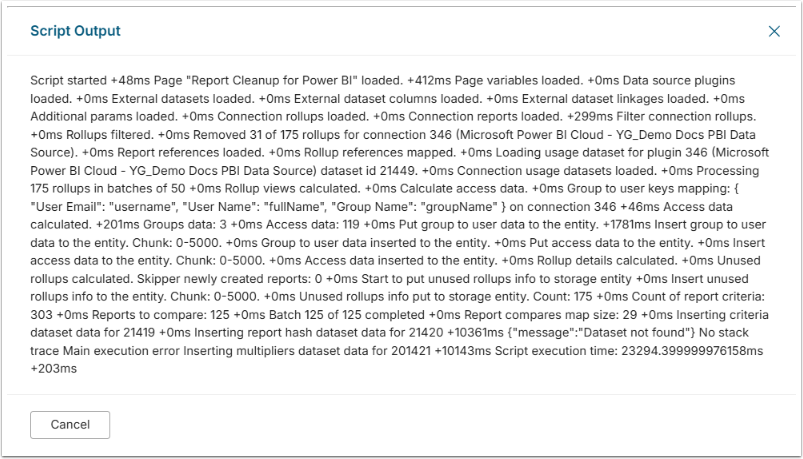
- See the example output below.
7.4. Associate Notification Schedule With Run Sync Metadata Script
- Access Admin > Distribution > Notification Schedules
- Select the Notification Schedule determined in the Prerequisite steps.
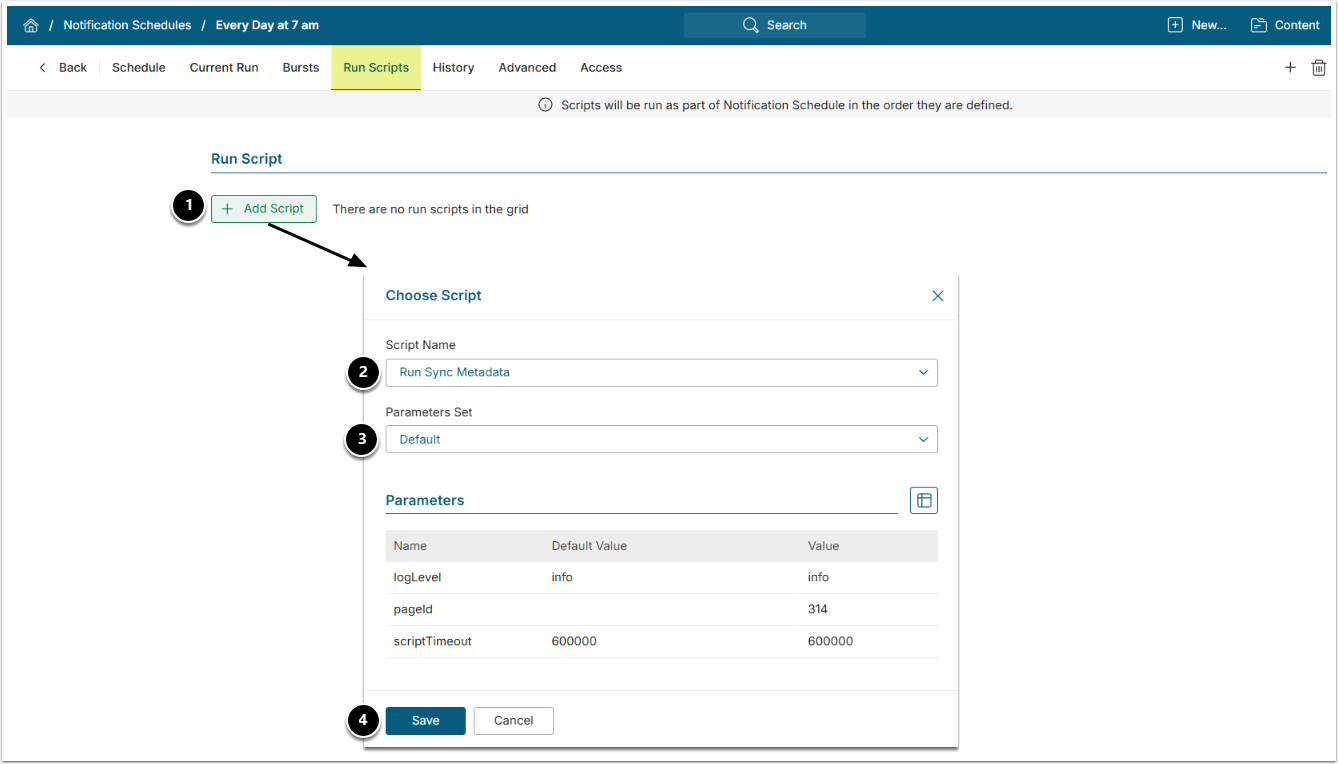
NOTE: The Script must run at least once per day. Configure the Notification Schedule accordingly.
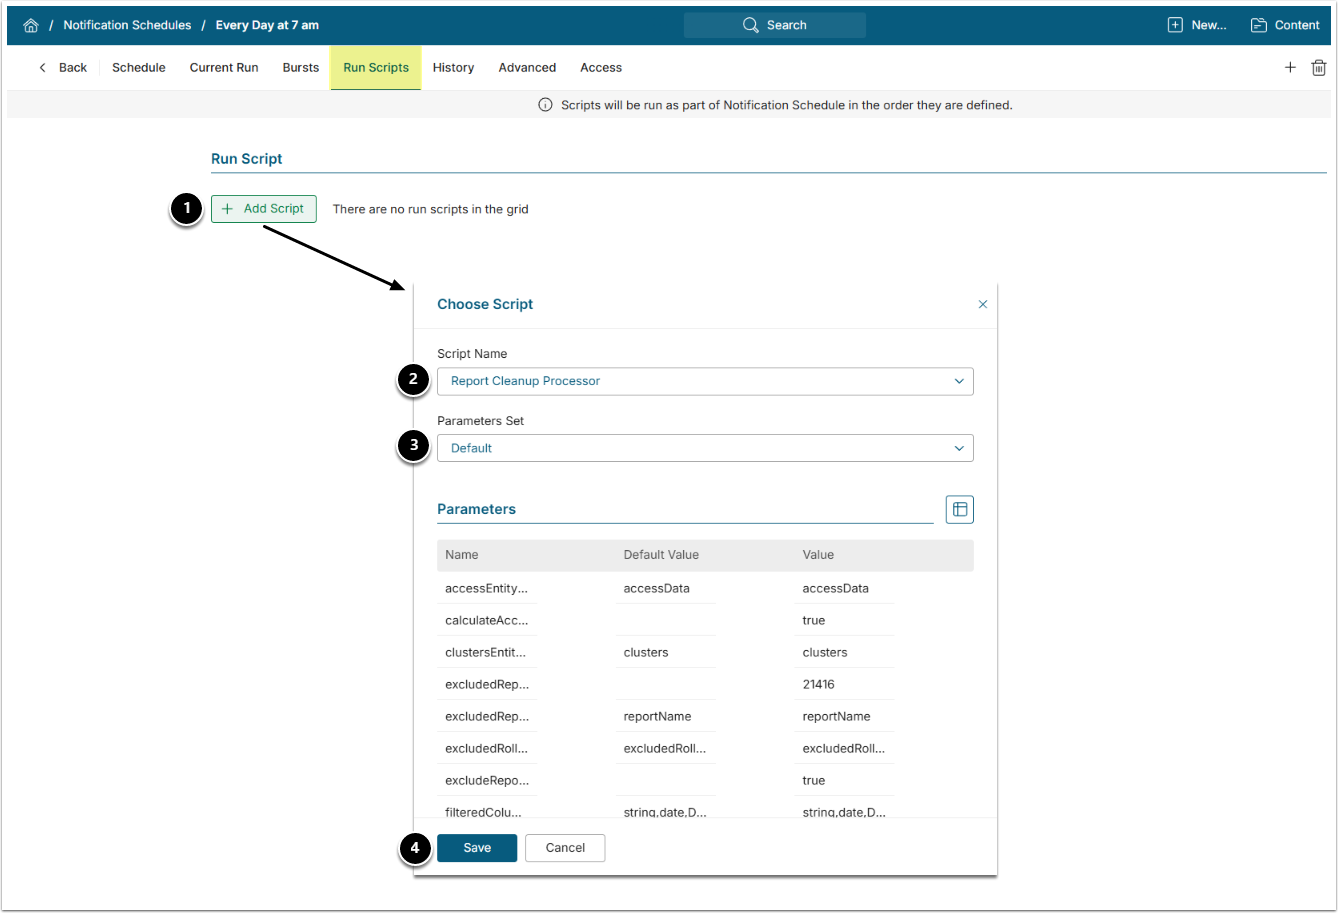
- Under the Run Scripts tab, [+Add Script].
- Choose the Custom Scrip created in Step 7.
- Choose the Parameter Set.
- [Save]
8. Create Report Cleanup Custom Script
Access Admin > System > Custom Scripts > [+New Custom Script]
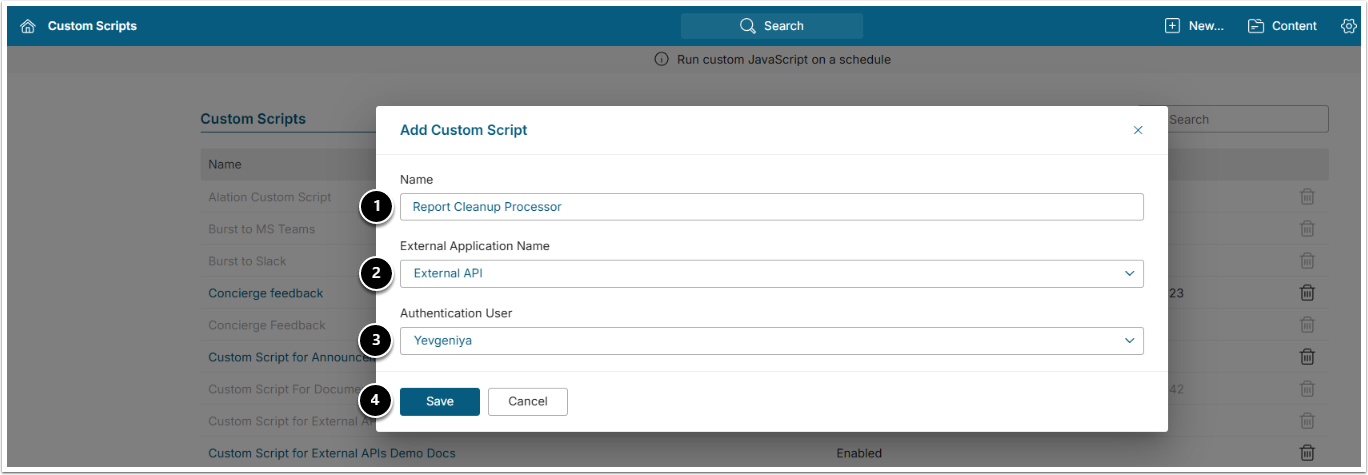
- Provide a descriptive Name such as Report Cleanup Processor.
- Choose an External Application (See prerequisites above).
- Specify an Authentication User (Admin or System Admin).
- [Save]
8.1. Add Parameters
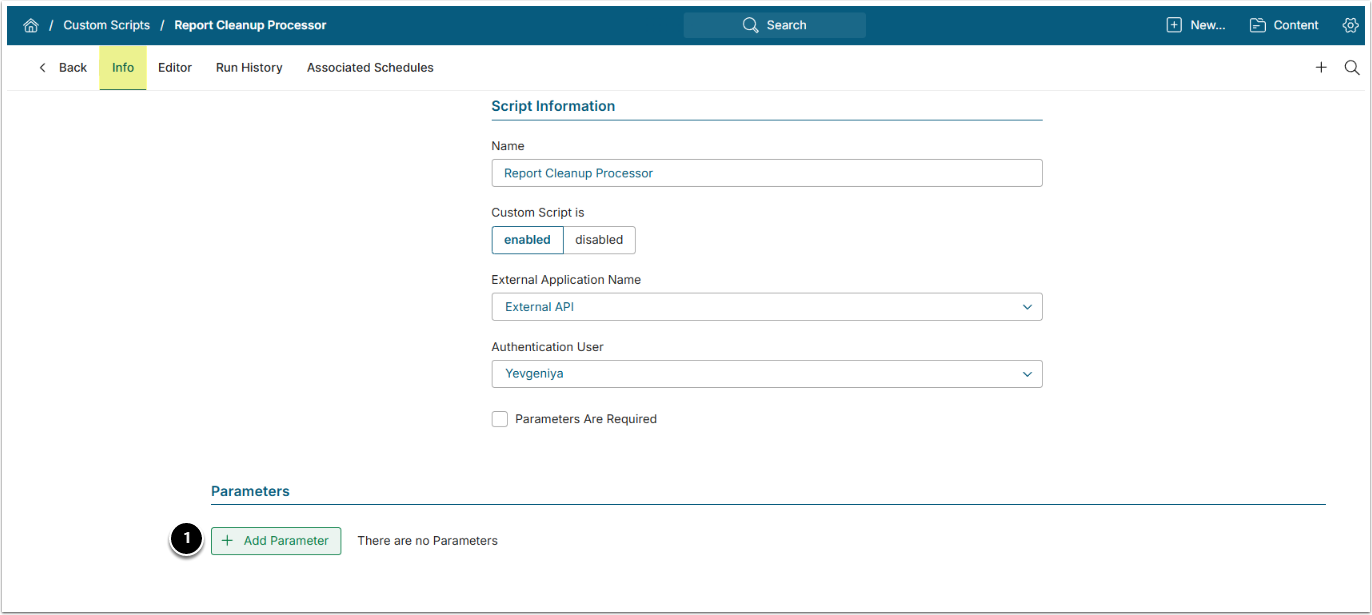
- From the Info tab, [+Add Parameters], then add the following Parameters and configure them accordingly.
| Name | Type | Required | Default | Available Values |
pageId |
String | Y | ||
storageEntityName |
String | processorData | ||
unusedForMonths |
Number | 6 | 1,2,3,4,5,6 | |
scriptTimeout |
Number | 600000 | ||
logLevel |
String | info | debug,info,warn,error, emergency,silent |
|
reportColumnsMatchCaseSensitive |
String | true | ,true | |
minColumnCountDuplicates |
Number | 2 | ||
worksheetNameMultiplier |
Number | 0.1 | ||
tableMultiplier |
Number | 1 | ||
tableColumnMultiplier |
Number | 1 | ||
reportColumnMultiplier |
Number | 1 | ||
tagMultiplier |
Number | 1 | ||
minOverlapInCluster |
Number | 0.2 | ||
filteredColumnTypes |
String | Y | string,date,DateTime | |
clustersEntityName |
String | Y | clusters | |
excludedRollupsEntityName |
String | excludedRollups | ||
thresholdReportsToBeUsed |
Number | 0 | ||
skipUnusedCheckForCreatedInDays |
Number | 15 | ||
unusedInfoEntityName |
String | unusedInfo | ||
removeUnusedFromClusters |
String | ,true | ||
accessEntityName |
String | accessData | ||
groupToUserEntityName |
String | groupToUserData | ||
calculateAccess |
String | ,true | ||
excludedReportNamesDatasetId |
Number | |||
excludedReportNamesObjectKey |
String | reportName | ||
minItemsCount |
Number | 8 | ||
excludeReportDashboards |
String | ,true |
8.2. Add Parameter Set
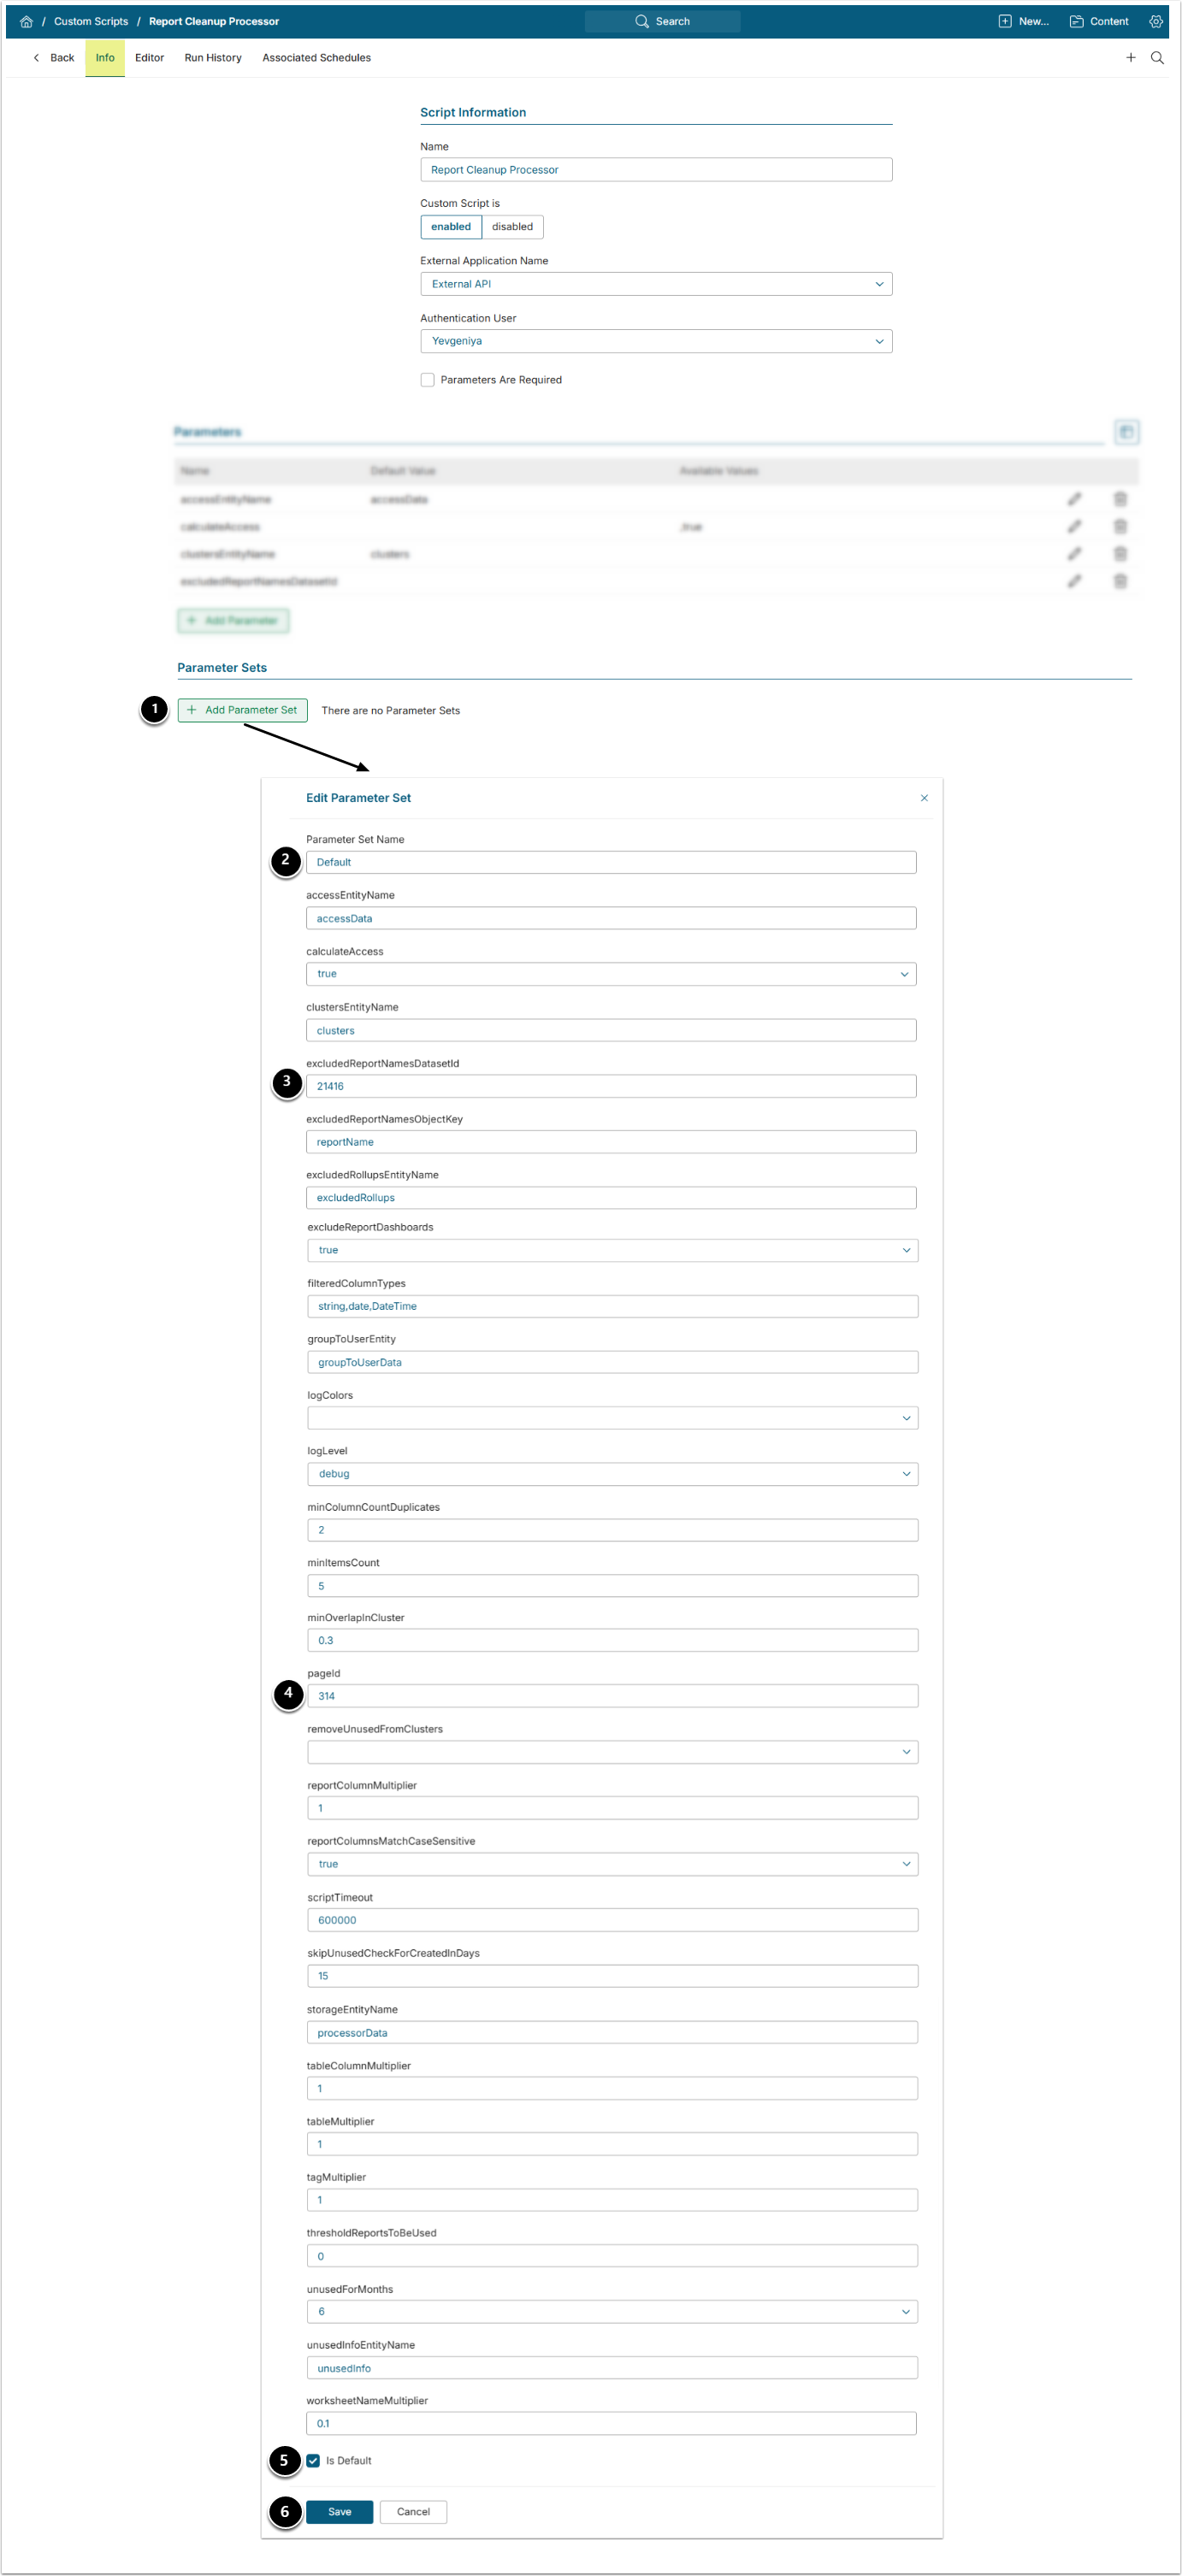
- [+Add Parameters Set]
- Provide a descriptive Name like Default.
- Include the Report Cleanup Excluded names CSV Dataset ID if you are using one. Otherwise this can be left blank.
- Provide the ID of the App configured at Step 6.
- Enable Is Default.
- Fill in the rest of the fields based on the list below and [Save].
- If you have any questions, contact our support at support@metricinsights.com.
Parameter Description:
pageId: The ID of the App created in Step 6 above.storageEntityName: The name of the storage entity where the script will store its data. (See Step 6.2) The default is processorData.unusedForMonths: The number of months without activity after which a report is marked as unused. The default is 6.scriptTimeout: The timeout for the script in milliseconds. The default is 600000 (10 minutes).logLevel: The log level for the script. Values can be debug, info, warn, error, emergency, or silent. The default is info.logColors: Specify whether to log colors in the console. The default is blank.reportColumnsMatchCaseSensitive: Specify whether the report columns are case-sensitive. The default is true.minColumnCountDuplicates: The minimum number of columns to consider for duplicates. The default is 2.worksheetNameMultiplier: The multiplier for the worksheet name. The default is 0.1.tableMultiplier: The multiplier for the table name. The default is 1.tableColumnMultiplier: The multiplier for the table column name. The default is 1.reportColumnMultiplier: The multiplier for the report column name. The default is 1.tagMultiplier: The multiplier for the tag name. The default is 1.minOverlapInCluster: The threshold percentage of similarity between two reports in a cluster, specified as a decimal. A report cluster will be included in the match results when the similarity percentage between any two reports in the cluster exceeds this threshold. Acceptable values range from 0 to 1 (e.g. 0.2, 0.35, 0.5), where 0 represents 0% similarity and 1 represents 100%. The default is 0.2 (20%).filteredColumnTypes: The column types to be filtered out as a comma-separated list of types with no spaces. The default is string,date,DateTime.clustersEntityName: The name of the clusters entity. (See Step 6.2) The default is clusters.excludedRollupsEntityName: The name of the excluded rollups entity. (See Step 6.2) The default is excludedRollups.thresholdReportsToBeUsed: The minimum number of views to consider a report as used. The default is 0.skipUnusedCheckForCreatedInDays: The number of days after the report was created to skip the unused check. The default is 15.unusedInfoEntityName: The name of the unused info entity. (See Step 6.2) The default is unusedInfo.removeUnusedFromClusters: Specify whether to remove unused reports from clusters. The default is blank.accessEntityName: The name of the access entity. (See Step 6.2) The default is accessData.groupToUserEntityName: The name of the group-to-user entity. (See Step 6.2) The default is groupToUserData.calculateAccess: Specify whether to calculate access information. The default is blank.excludedReportNamesDatasetId: The ID of Report Cleanup Excluded names Dataset. (See Step 4) If not used, this can be left blank.excludedReportNamesObjectKey: If using excludedReportNamesDatasetId, the column name from the dataset that contains the excluded report names. The default is reportName.minItemsCount: The minimum number of items required in the report for processing to begin. The default is 8.excludeReportDashboards: Specify whether the BI Optimizer should exclude Power BI dashboards from duplicate-detection when those dashboards only contain (or represent) the same report included within them. Use when a dashboard embeds a single underlying report and is flagged as a duplicate of that report. Acceptable values: blank(default): dashboards and reports are evaluated normally; true: skip similarity flagging between a dashboard and its included reports.
9. Add Custom Script Code and Run Script
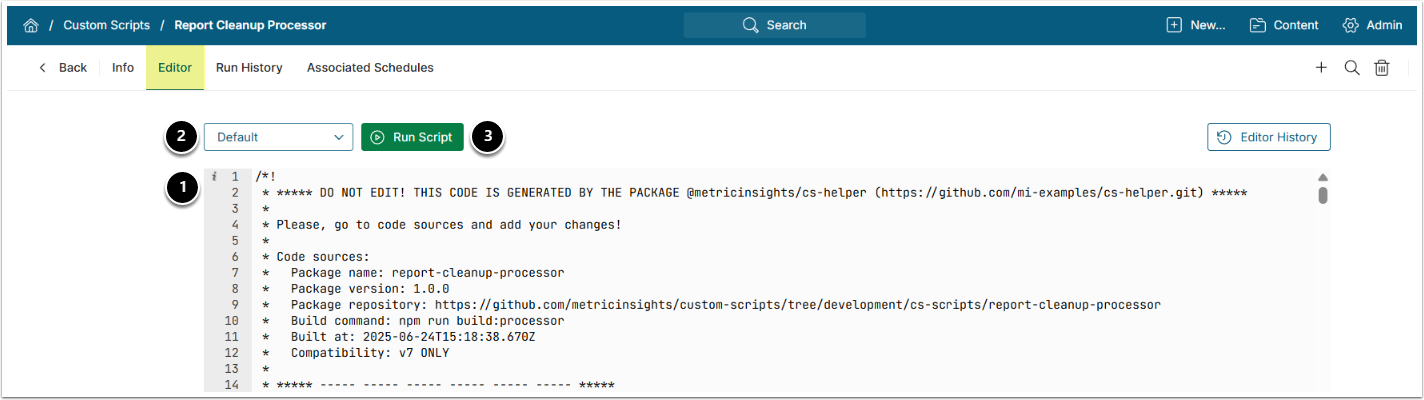
- Under the Editor tab, copy and paste the code from the BI Optimizer Custom Script file requested from our support team.
- Select the Parameter Set.
- [Run Script]
- See the example output below.
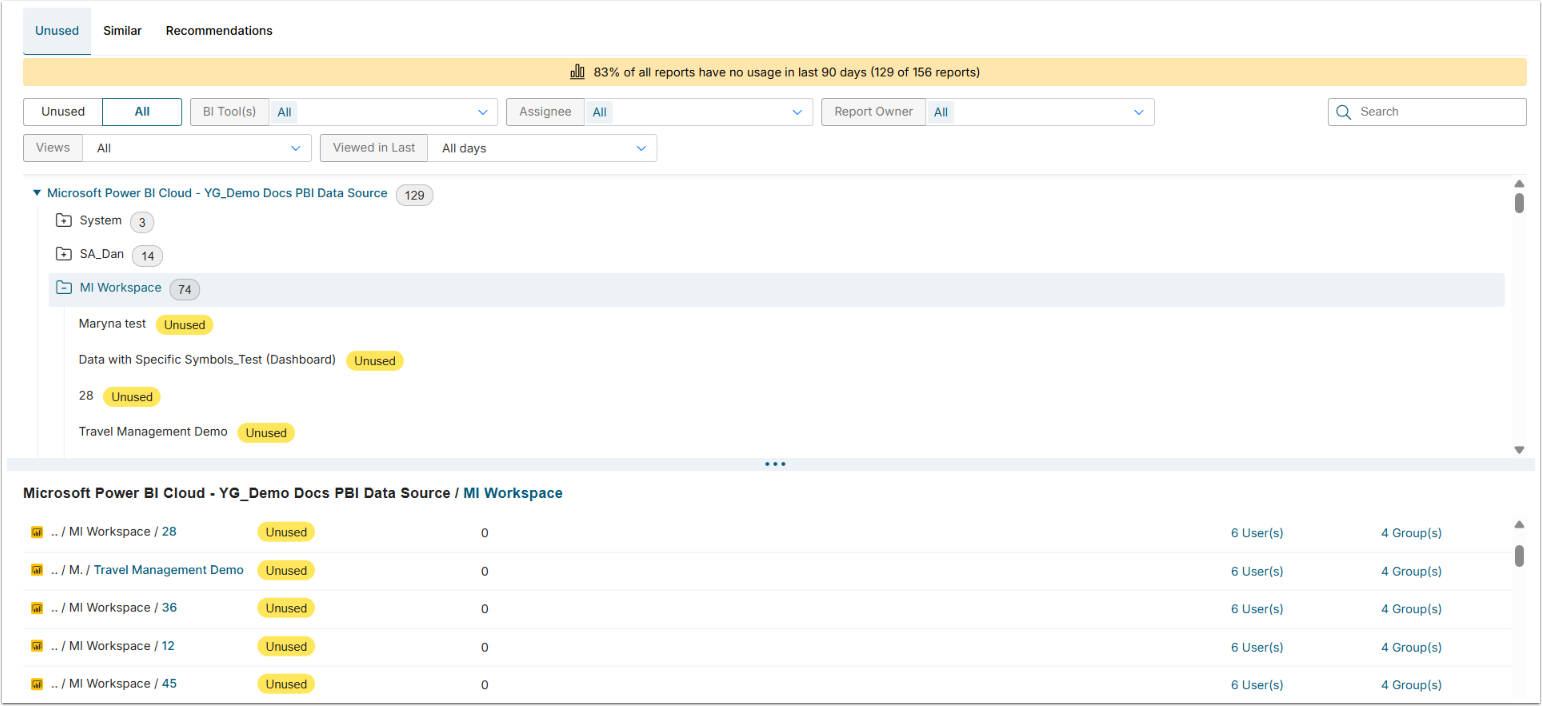
10. Verify Result
Access Content > Apps > Report Cleanup Processor> [View]
11. Associate Notification Schedule with Report Cleanup Custom Script
- Access Admin > Distribution > Notification Schedules
- Select the Notification Schedule determined in the Prerequisite steps.
NOTE: The Script must run at least once per day, but it is recommended to run it once every two hours. Configure the Notification Schedule accordingly.
- Under the Run Scripts tab, [+Add Script].
- Choose the Custom Scrip created in Step 9.
- Choose the Parameter Set.
- [Save]