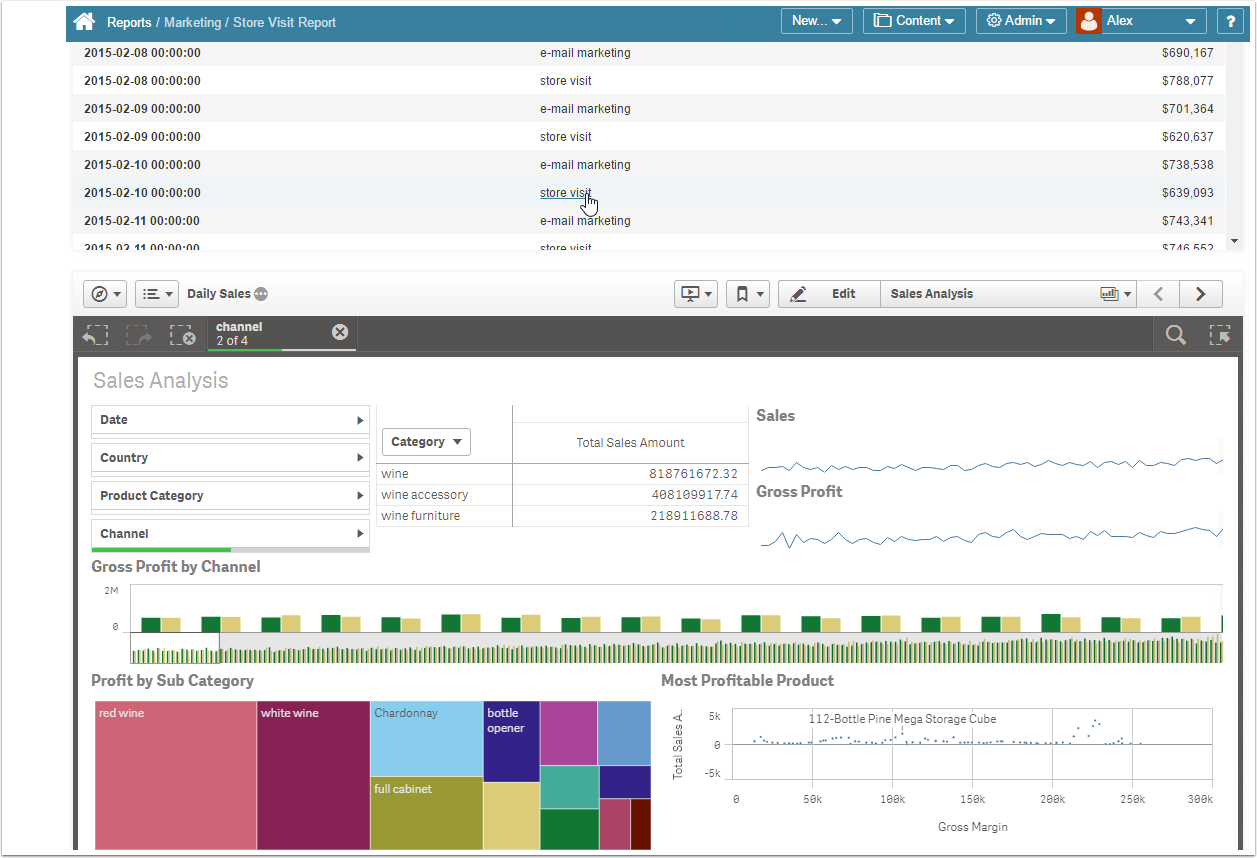
This feature allows combining internal Report and External Visualization in ONE Viewer regardless of their Data Source. For example, the internal report may be sourced from SQL or some BI tool and Visualization is going to be sourced from Qlik Sense.
PREREQUISITES:
- Create an External report from Qlik Sense
- Apply filters to the external Report sourced from Qlik Sense
- Create a Regular Report that is going to serve as a basis for embedding Visualization
Adding Visualization to a Report has been greatly simplified by the use of Dataset Reporting. For more information, see Dataset Reports Overview. The example below applies to Versions prior to v5.3.
1. Access Report Editor > Report Content tab
- Open an existing regular Report or create a new one as described in this article: Create a Simple (Undimensioned) Report
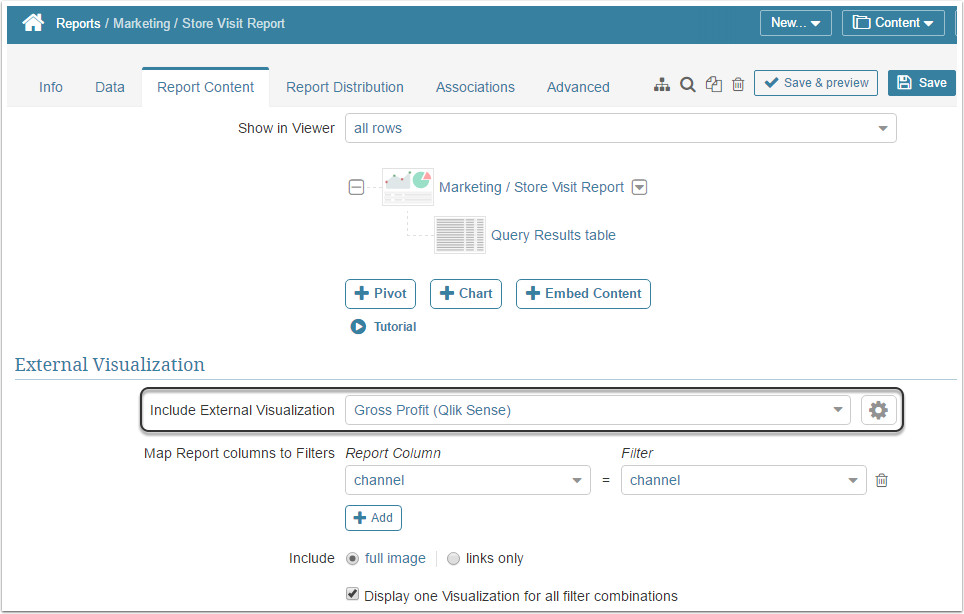
- Find the External Visualization section; the Include External Visualization field is set to 'None' by default. Select the external Report that you have created as a Prerequisite to including Visualization to the Report. This page is dynamic, so additional fields are going to be shown after you select an External Report from the drop-down list.
2. Map Report Columns to Qlik Sense filters applied to the External Report
To learn how to add Qlik Sense filters to Metric Insights, refer to: Pre-filtering Qlik Sense data
3. Define Visualization settings
-
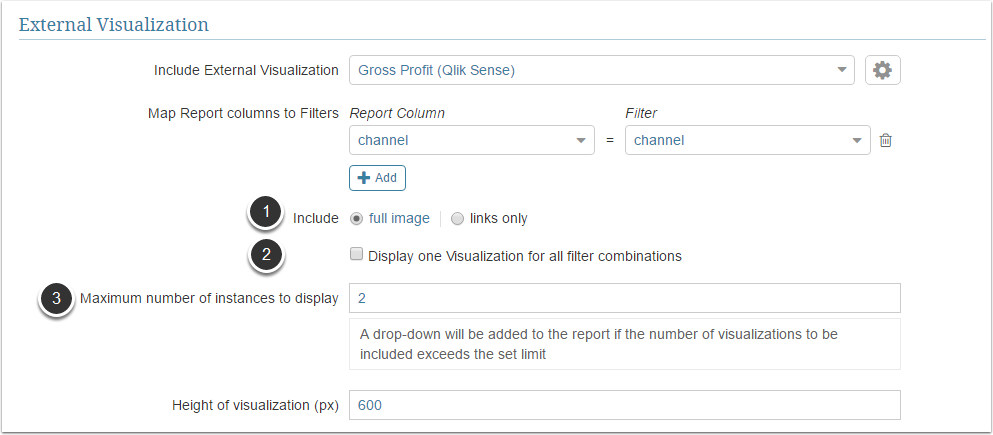
Include:
- 'full image': If this setting is selected, the Tableau visualization is going to be embedded below the Report table and Charts (if any). NOTE: Qlik Sense credentials are required to see the embedded Visualization.
- 'links only': values in the internal report become clickable and link to the External report source page (in this example to the Qlik Sense site)
-
Is applicable if 'full image' is chosen in the field above. Display one Visualization for all filter combinations:
- checked: If this box is checked, values of the internal Report Table are going to be clickable and by clicking on them a user will be redirect to the Qlik Sense Visualization embedded at the bottom of the same Viewer.
- clear: if the data in the internal report matches data in the Qlik Sense Visualization, each matching value is going to have its own Visualization. For example, if there are 2 Values in the internal report matching values in Qlik Sense, there are going to be 2 Visualizations.
- Is applicable if multiple Visualizations are enabled. Maximum number of instances to display: You can limit the number of Visualizations shown on the page at once. If the number of values from the internal Report matching values from Tableau Visualization is less or equal (<=) to the number defined in this field, all of them are going to be shown in the Viewer one after another; if the number of matching Values exceeds the number defined in this field, Visualizations are going to be shown in the drop-down list, but will function in the same way.


