This article outlines the process of creating a Dimensioned Metric.
Dimensioned Metrics should be used when you want to show a given Measure charted over time with a Dimension drop-down list. In this example, you'll see the process of building a Dimensioned Monthly Metric that measures sales by Sales Channel. This example uses the Metric Editor to build the new Metric in order to have access to advanced options.
PREREQUISITES:
- Define the Dimension. For more information on creating and collecting data for a Dimension, see Create a Simple Dimension article.
- Construct a data fetch command that will return a data set with three columns:
- The Dimension Key Value;
- The Measurement date/time;
- A measurement value corresponding to the specific Dimension Value and Measurement date/time.
1. Start Creating a New Metric
Access + New > Metric > Create New
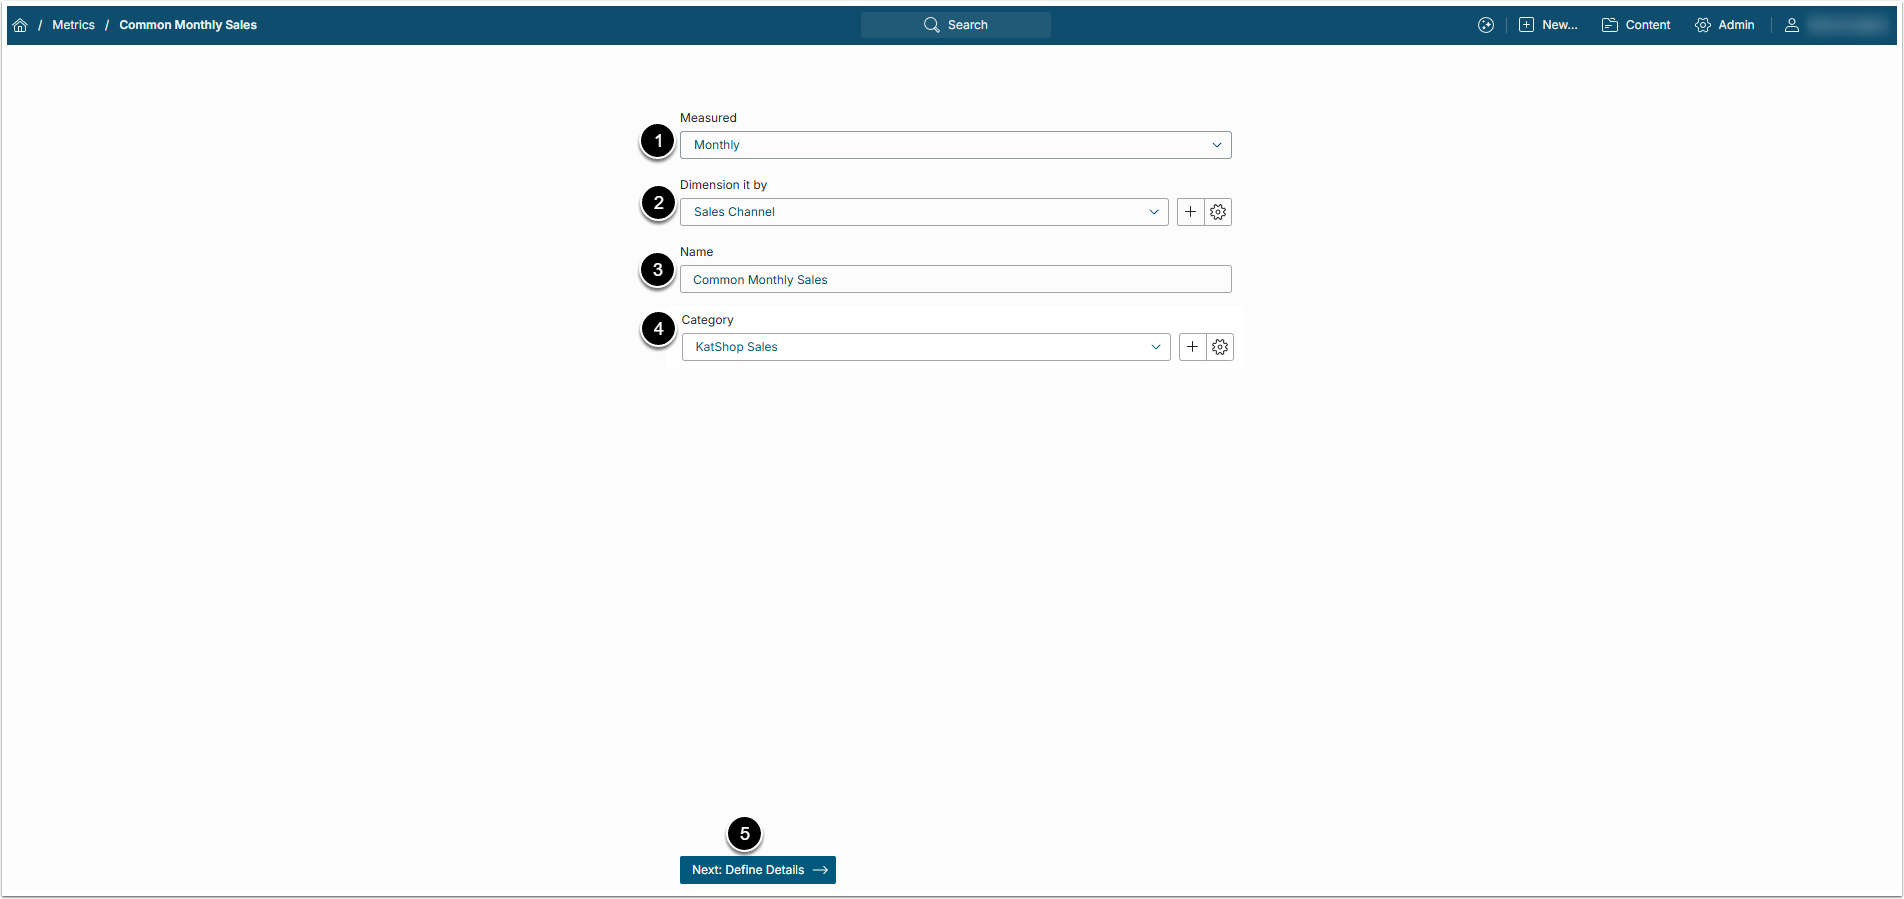
- Measured: Select the measurement interval that applies to the level of aggregation that you want in your result set.
- Dimension it by: Since we are creating a dimensioned Metric select Dimension from the drop-down list below.
- Name: The system automatically generates name based on the values selected in the fields above, however, you can change it to a unique descriptive name of your choice.
- Category: Select the Category where the new Metric will be placed.
- [Next: Define Details] to open Metric Editor.
1.1. Set Additional Fields
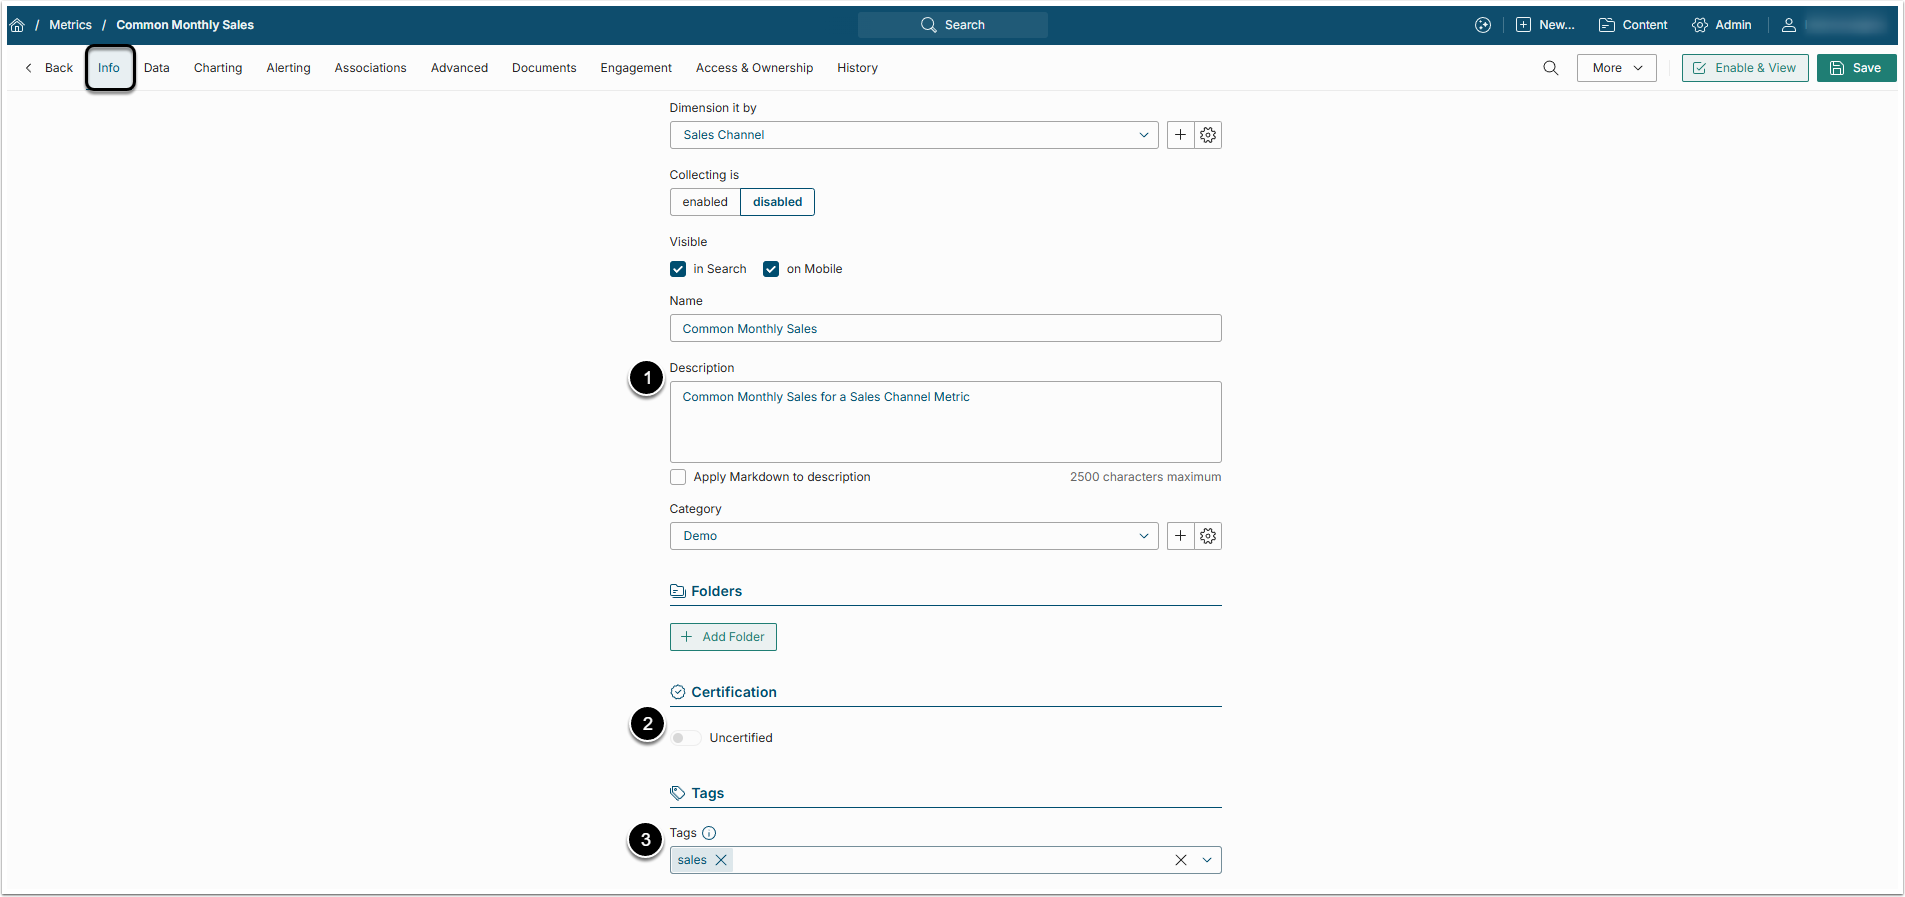
- Description: This field defaults from the Name, but if this is not sufficiently descriptive, you may change it.
- Certified: Certification is a means for Admin and Power Users to identify Elements that have been approved as being valid and accurate. For details, refer to Certifying an Element article.
- Tags: Tags are used to relate Elements to each other for identifying purposes. For details, refer to Create a Tag article.
2. Define Data Collection Parameters
-
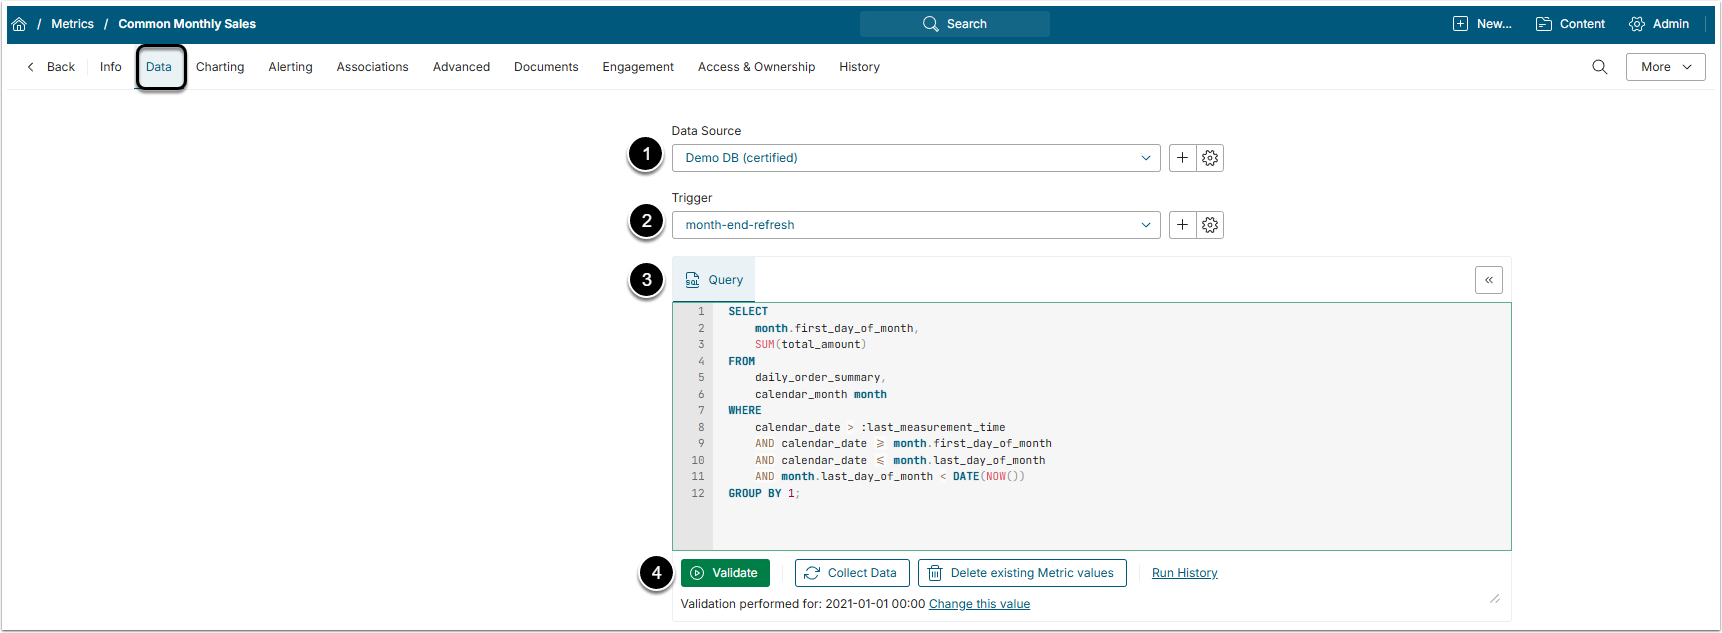
Data Source: Select the repository which contains necessary data. SQL Database is used for this example.
- For more info on Data Sources, refer to Understanding Data Sources article.
- Trigger: Select a Data Collection Trigger that will initiate Metric data collection process.
-
Query: Enter an SQL query.
- For more details, see Write a SQL Statement for a Dimensioned Metric article.
- [Validate] to verify that the SQL statement is valid.
2.1. Enter Last Measurement Time Value for Validation
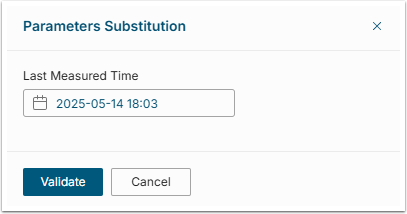
NOTE: This pop-up only appears if you included ':last_measurement_time' in the SQL Statement field.
3. Collect Data
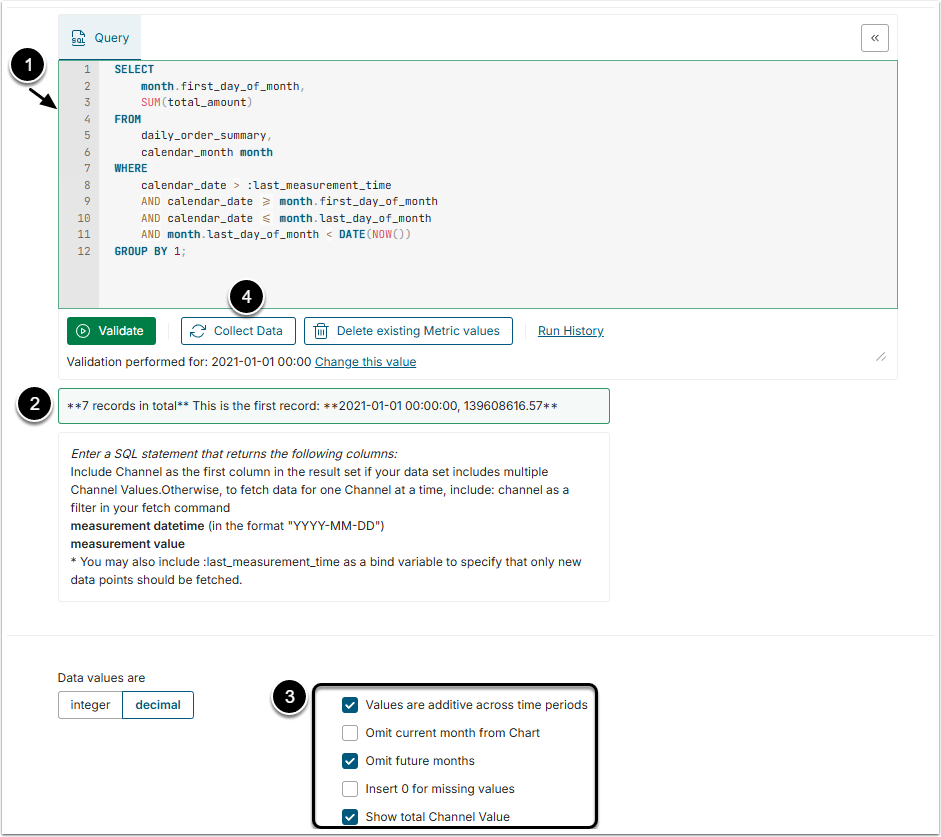
- If your statement is valid, the query box color is green; if there are any errors, the box is colored in red and errors are explained below the query box.
- The total number of found records and an example of first one are displayed below the query box.
- Specify data collection advanced options.
- To proceed with fetching data, click [Collect data].
3.1. Parameters Substitution
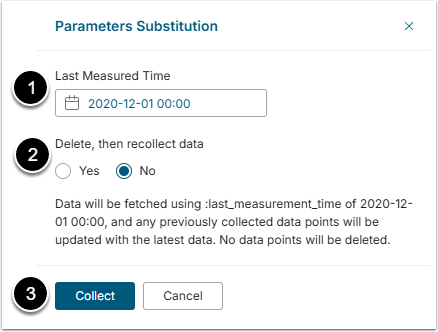
- Last Measured Time: Select how far back to collect the data.
- Delete, then recollect data: Define if the previously collected data should be deleted or just updated.
- [Collect]
4. Modify Charting Tab
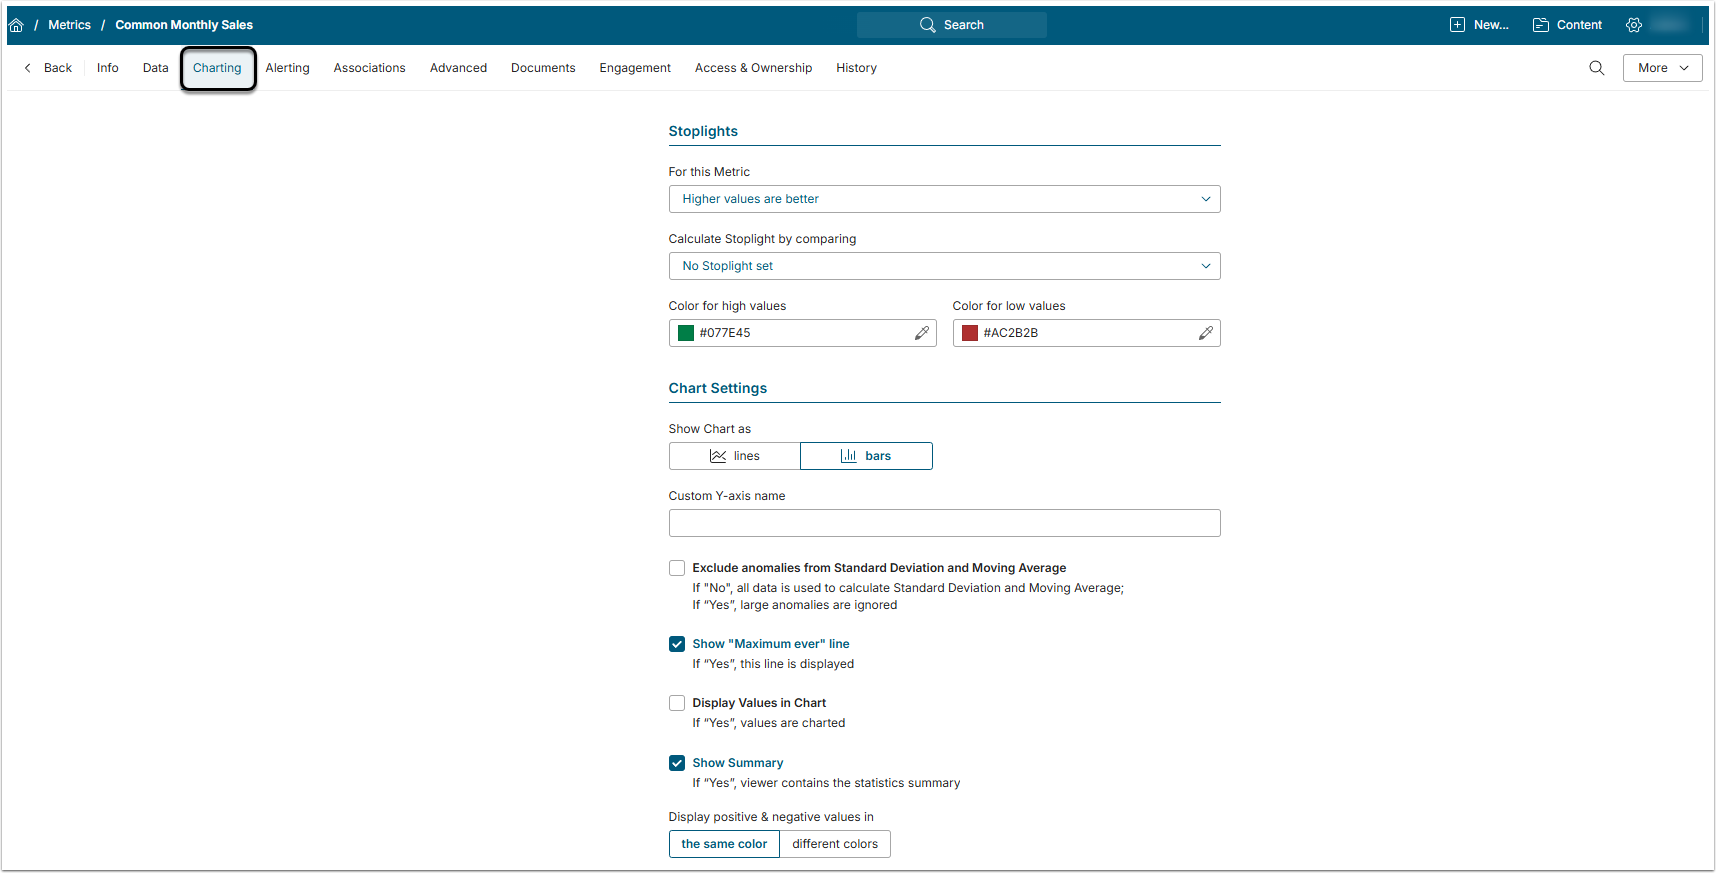
In this tab the User can change how the Metric's chart will look like.
For a more detailed Charting tab overview, check the Metric Editor Overview article.
5. Enable & View Metric
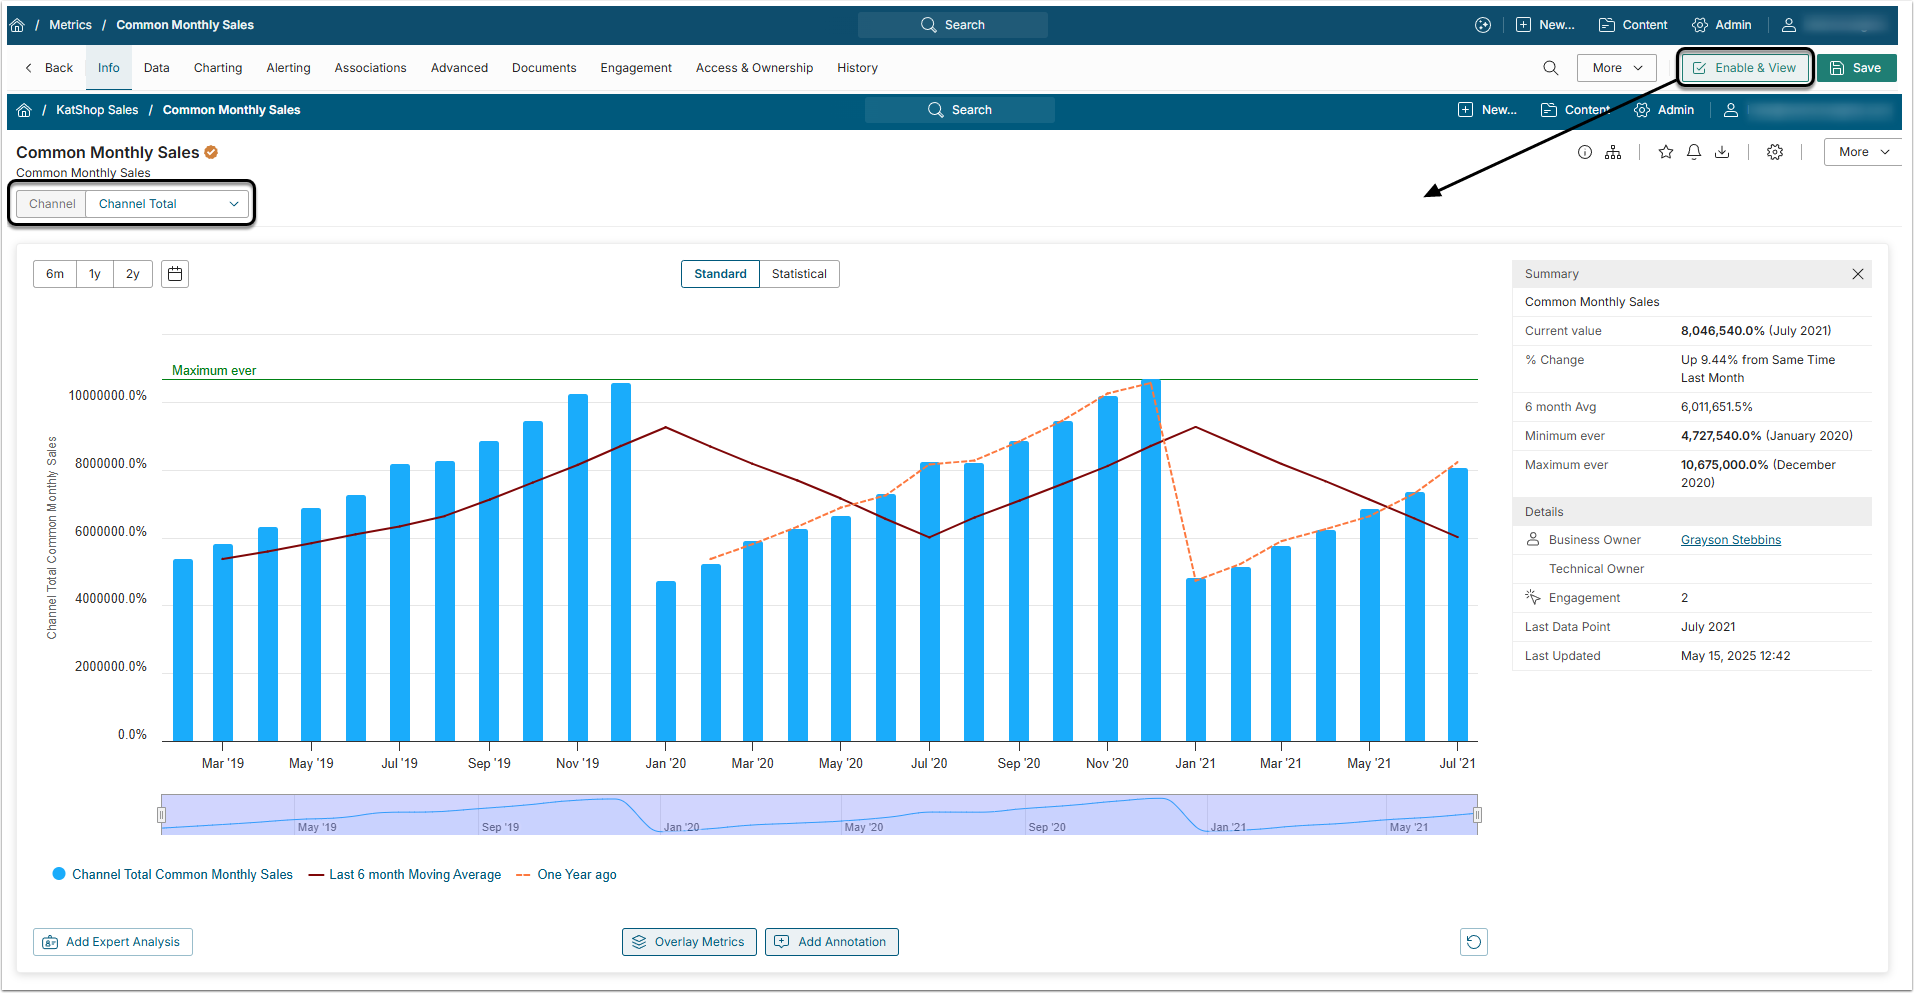
[Enable & View] to view the Metric in the Viewer.
By selecting different Dimension Values (in this case channels), the User can change the displayed Metric.
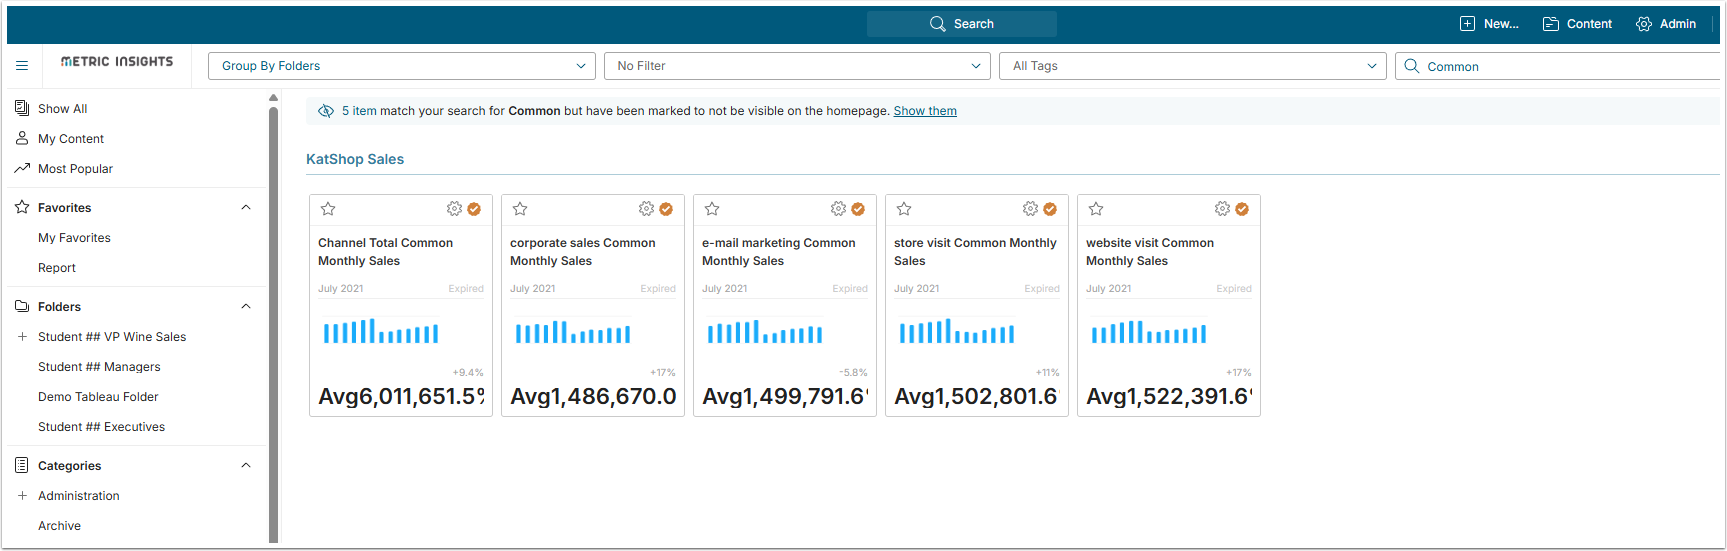
And Tiles of a Dimensioned Metric will look like this: