Dimensions are used to divide the data to pieces that are easier to understand and organize. Several Dimension Values can be combined into one in two ways. The first one is to create a Subtotal Dimension Value and the second is to combine data that would otherwise made several Dimension Values into one.
This article describes how to create a combined Dimension Value that can be used in External Report filtering.
NOTE: Combined Dimension Values can only be created for Plugin Data Sources that support Filters.
1. Configure a Plugin Data Source to Support Multiple Values
Access Admin > Collection & Storage > Data Sources and click the Data Source Active Name link to open the Data Source Editor
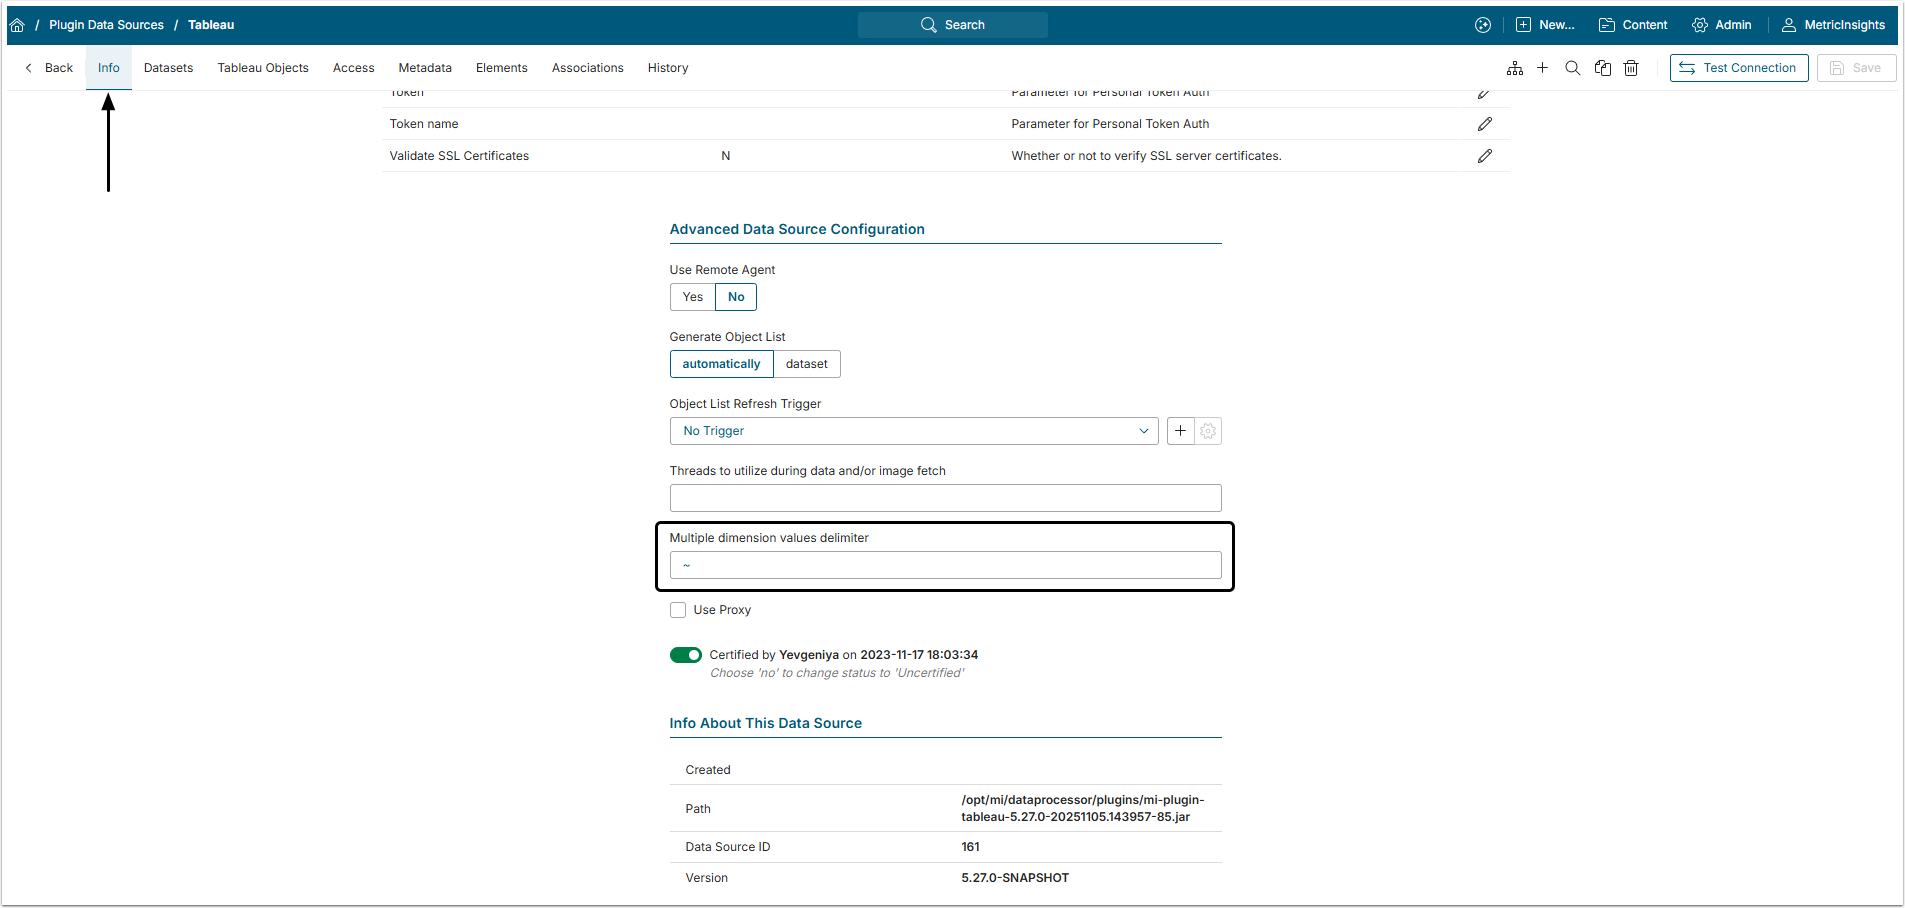
Open the Info tab, scroll the page to the Advanced Data Source Configuration section and specify the Multiple dimension values delimiter symbol.
2. Create Combined Dimension
Create a new Dimension or access an existing one.
For details on creating Dimensions, you can refer to:
- Create a Dimension with Manually Entered Values;
- Create a Dimension with Automatically Collected Values.
In the Info tab and scroll the page to Dimension Values section.
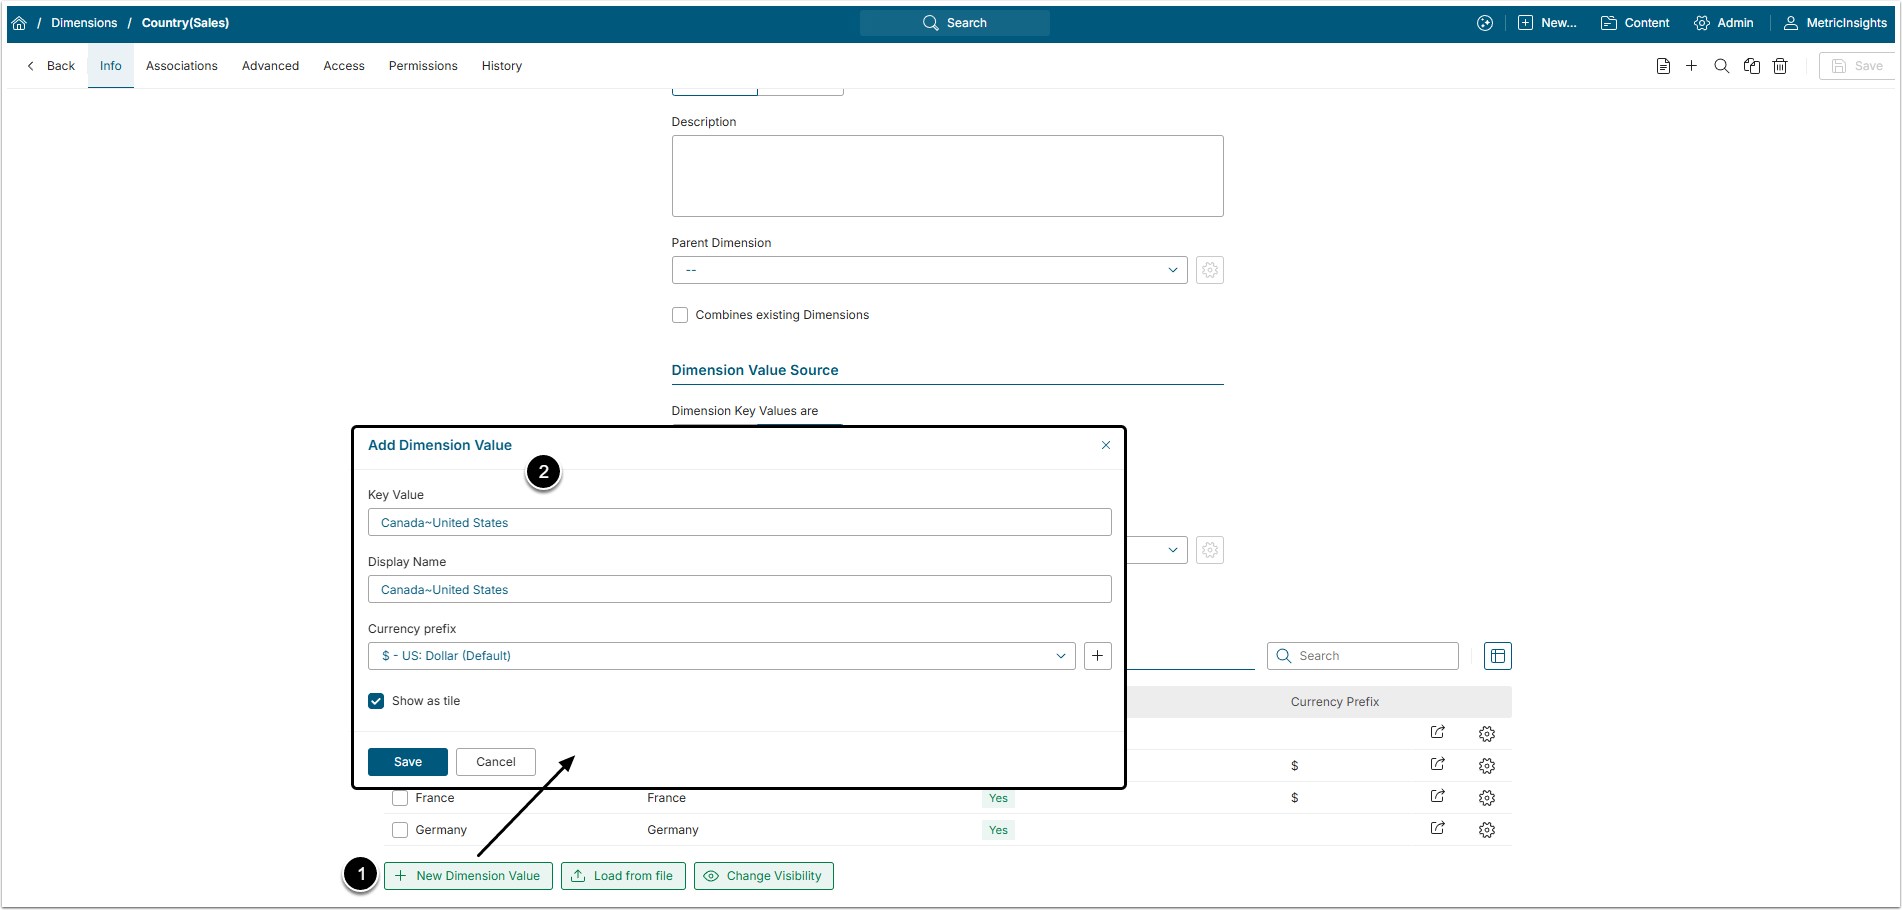
- [+ New Dimension Value]
- Create combined Value that collects several measurements.
- If you have sales data for Canada and United States, you can collect aggregate data and build a View for North America.
NOTE:
- Optionally, you can build Dimensions having only combined (aggregate) Values.
- Combined Values must be named using Delimiters.
- Only the tilde (~), underscore (_) and hyphen (-) Delimiter symbols are supported.
3. Map an External Filter to this Dimension
3.1. Start Creating Filter
Access Content > Elements and find the External Report created from the Data Source that supports Filters and combined Values. Click its Active Name link to open the External Report Editor.
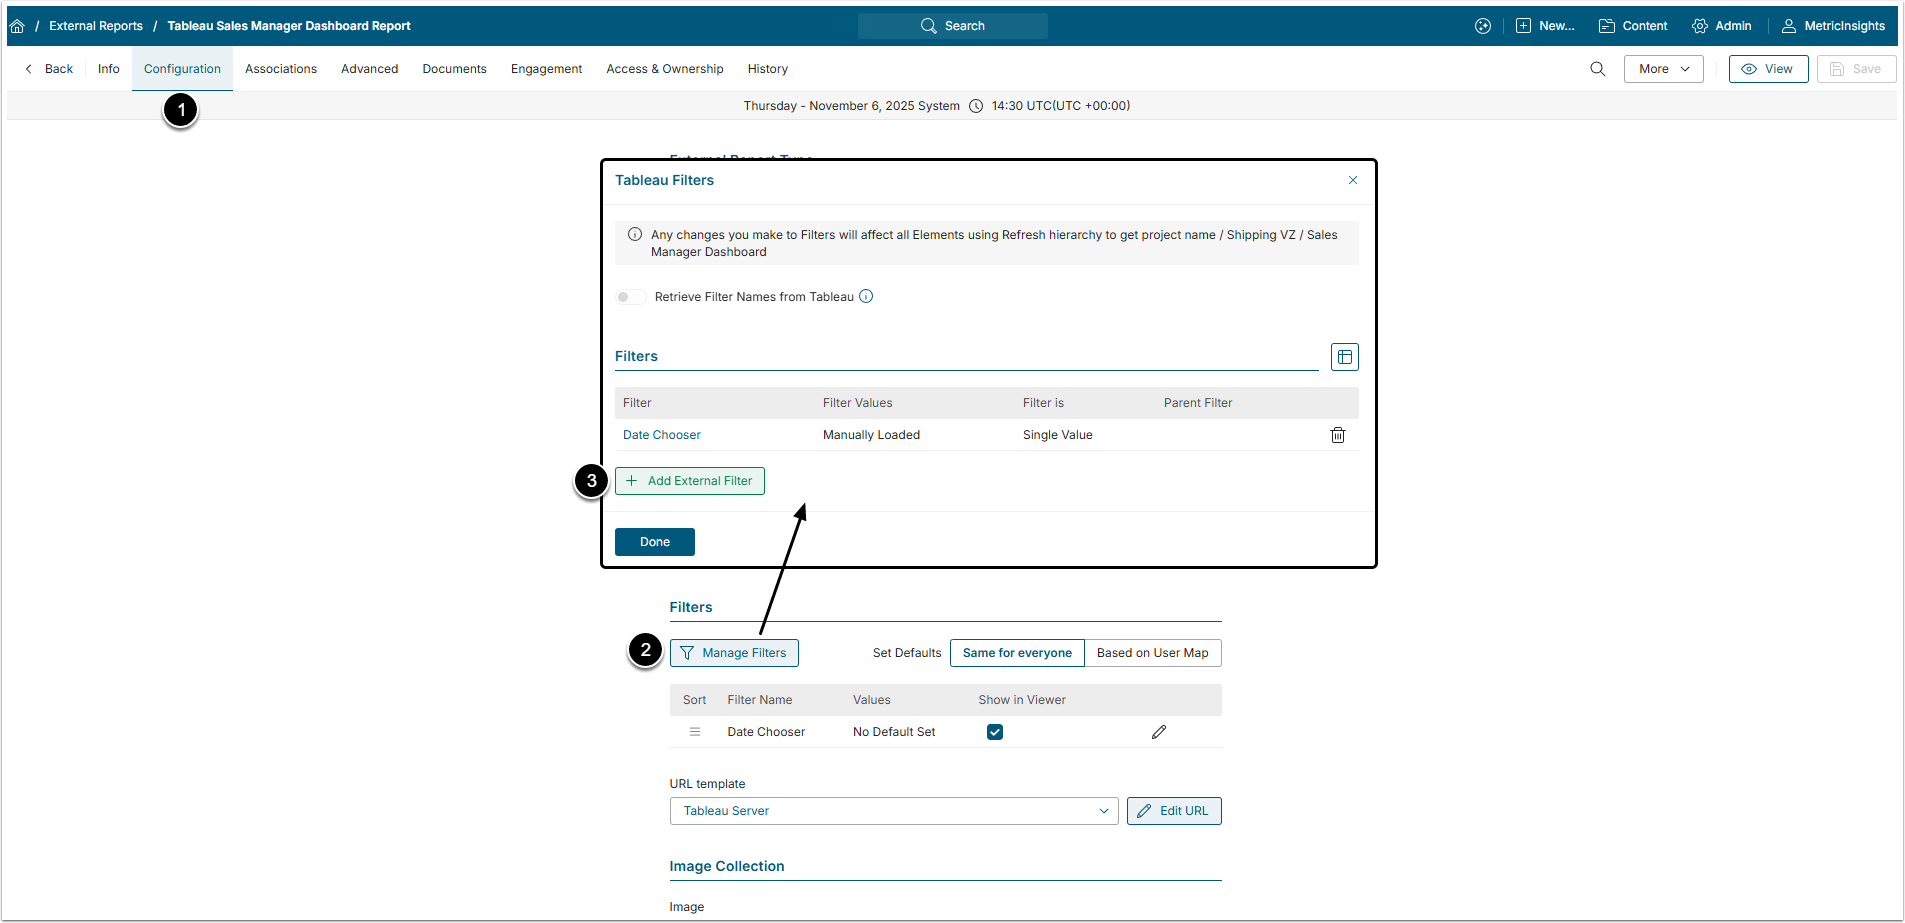
- Open Configuration tab.
- [Manage Filters]
- [+Add External Filter]
3.2. Configure Filter
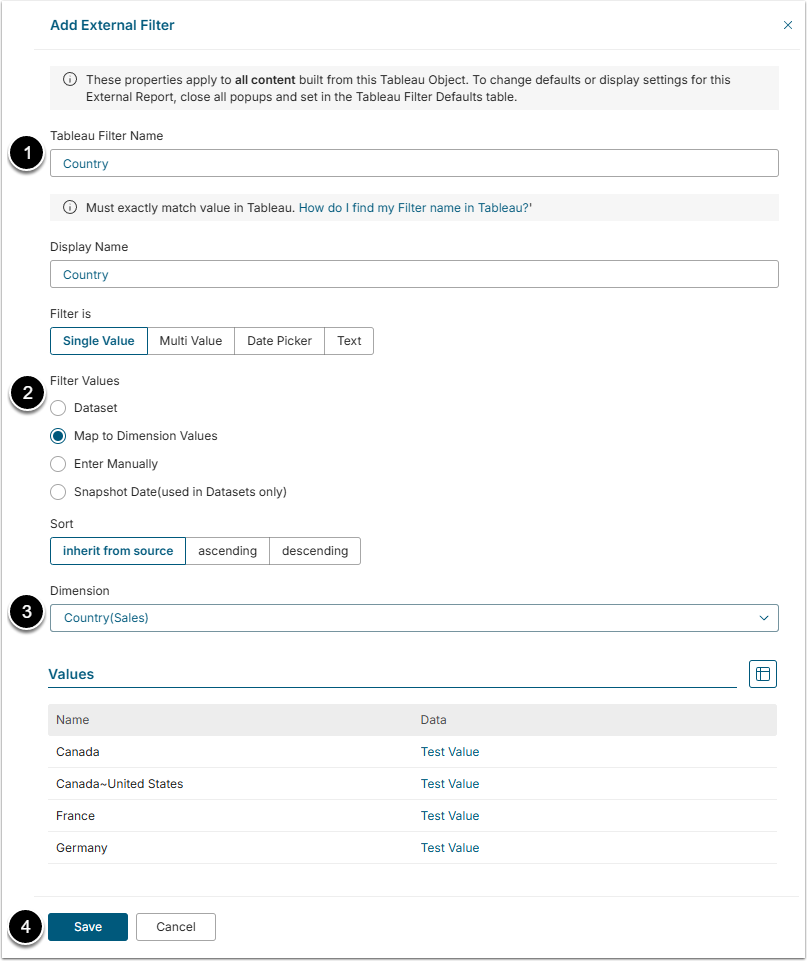
- Filter Name: Give the Filter a descriptive name.
- Filter Values: Select "Map to Dimension Values" option.
- Dimension: Select the Dimension with Multiple Values from the dropdown menu.
- External Report must be Dimensioned by the same Dimension (which is specified in the Info tab).
- For more information on Dimensioned External Reports, refer to Create a Dimensioned External Report from Tableau.
- [Save]
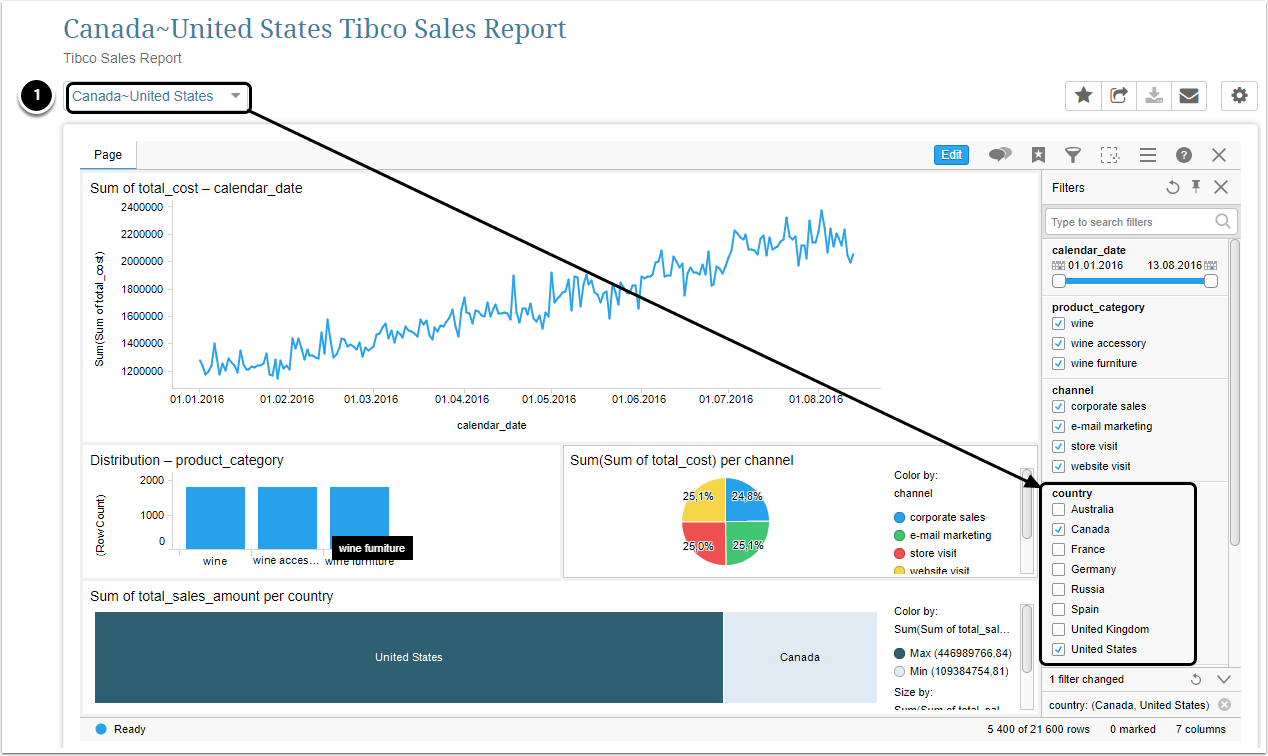
After you Enable & Publish your Report, you will be able to access visualizations with aggregate data.
4. Display Visualizations for Multiple Values
Provided the above configuration steps were performed correctly, you will be able to access visualizations built for combined Dimension Values.