Events communicate insights as to what might have caused results for a specific data point(s) to be unusually high or low. For instance, a bad snow storm on a Saturday might cause greatly reduced in-store sales for that day, but may also result in an increased volume of phone orders.
Events are organized into Event Calendars that are associated with one or more Metrics. Events may be added to an Event Calendar in advance for scheduled items such as system maintenance or sales promotions. Alternatively, Events may be entered after the fact for occurrences, such as storms or system outages. The Events feature is structured into three parts:
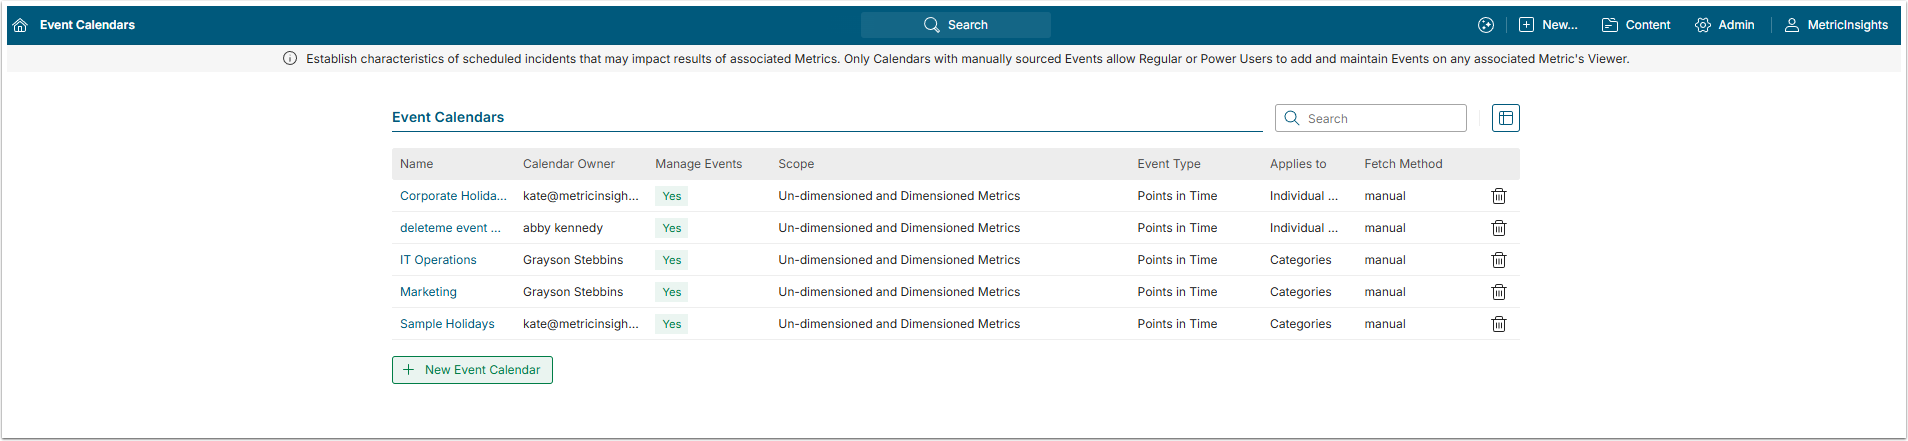
- Event Calendars: Provide the framework and rules that govern the application and display format of Events to Elements.
- Events: One or more individual occurrences associated with the specific Event Calendar. Events will display on Viewers of those Metrics for which the Event is determined to be "Impacting", for example: If the value(s) for a date or range of dates are "Statistically Significant"; (outside of the Standard Deviation settings), the Event is considered to have impacted the result.
- Display of Events on Metric Charts: Events are not automatically removed from a Chart until the Chart is refreshed as a result of one of the following:
- A Data Collection process being executed.
- Clicking [Update Live Chart] to re-generate the chart.
NOTE: For details about Event Calendar Security, see Event Calendar Security.
1. Open an Event Calendar
Access Admin > Referent Objects > Event Calendars and select an item from the list or create a new one. For more details about how to create Event Calendars see Create an Event Calendar article.
For more information on collecting Events see:
1.1. Find Impacting Events
Click the Event's Active Name Link to open the Event Editor and go to Events tab
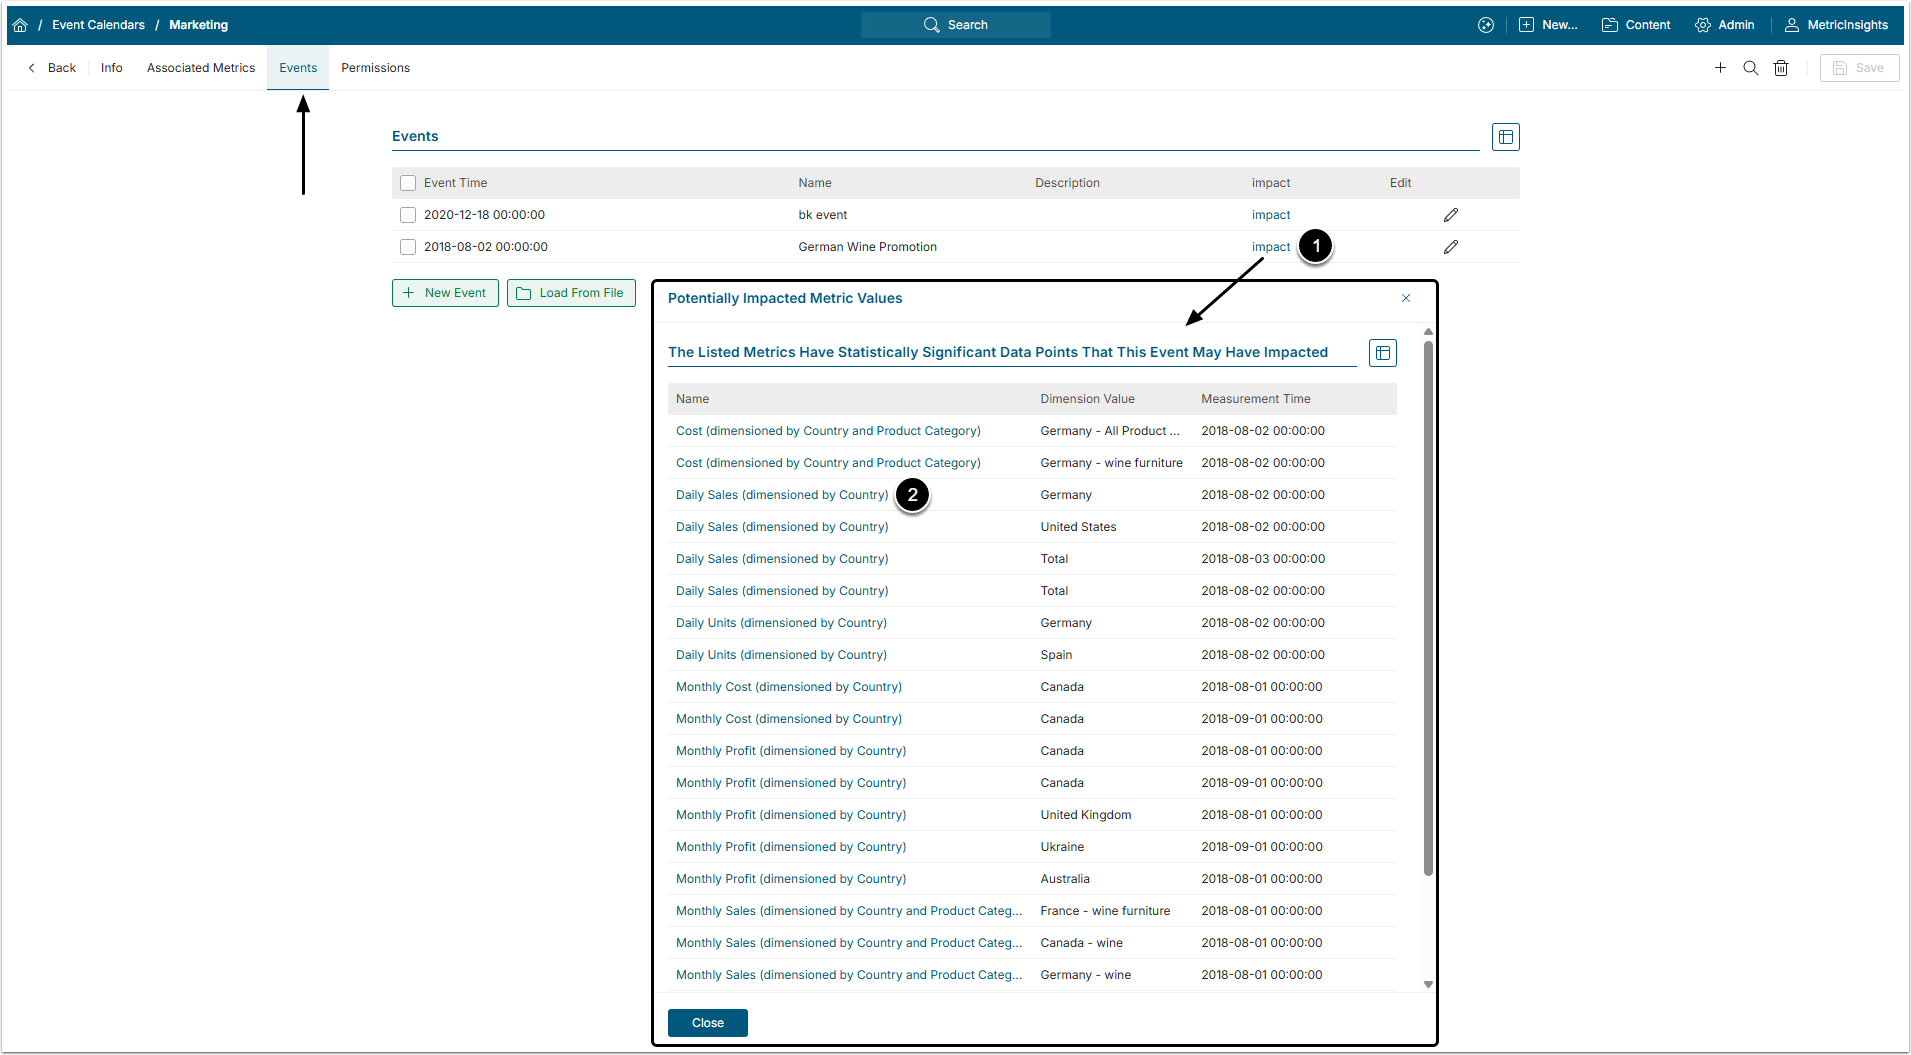
- Select an Event from the list and click Impact to see the Impacted Metric Values (if any):
- Event Impact: is automatically calculated by the allowed standard deviation in the Statistical View. Standard Deviation is assigned in the Metric Viewer > Charting tab > Set Statistical view field. When the data point falls outside the statistically acceptable threshold, system interprets it as an Alert. If such Alert date coincides with the date in the Event Calendar, this Event becomes impacted and current date and the following date are added to the Potentially Impacted Metric Values list.
- Click the Metric Name to review the Element Chart.
2. Events on the Element's Chart
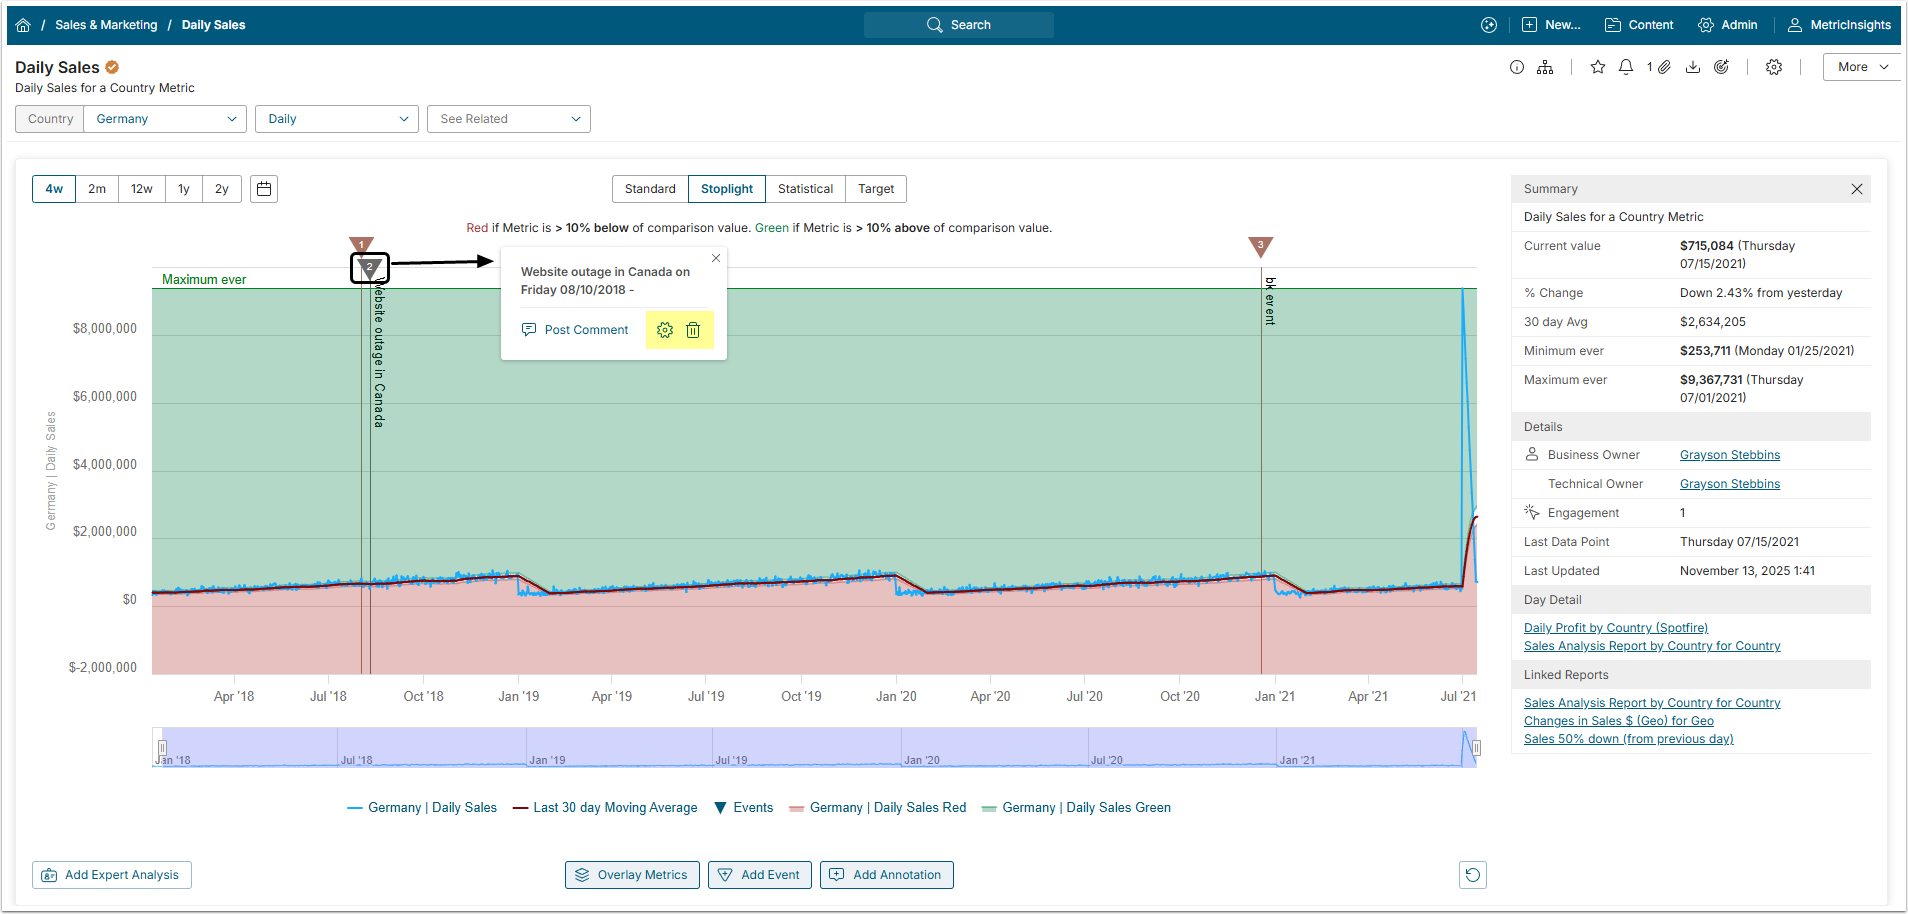
Click the Event's icon to see more information including Event's date and title. Depending upon your permissions, you may see Edit and/or Delete Event options.