If you are an Administrator or an Owner of the Event Calendar, you can add an Event to the selected Data Point directly from the Chart Viewer. This allows you to share information about the circumstances or occurrence that may have affected results on the date or range of dates that span the selected Data Point.
When you add an Event to an Event Calendar, it appears on Metric Charts that are associated with that Event Calendar according to Impacting or Key Event rules. For more information, see Understanding Events.
1. Initiate Event
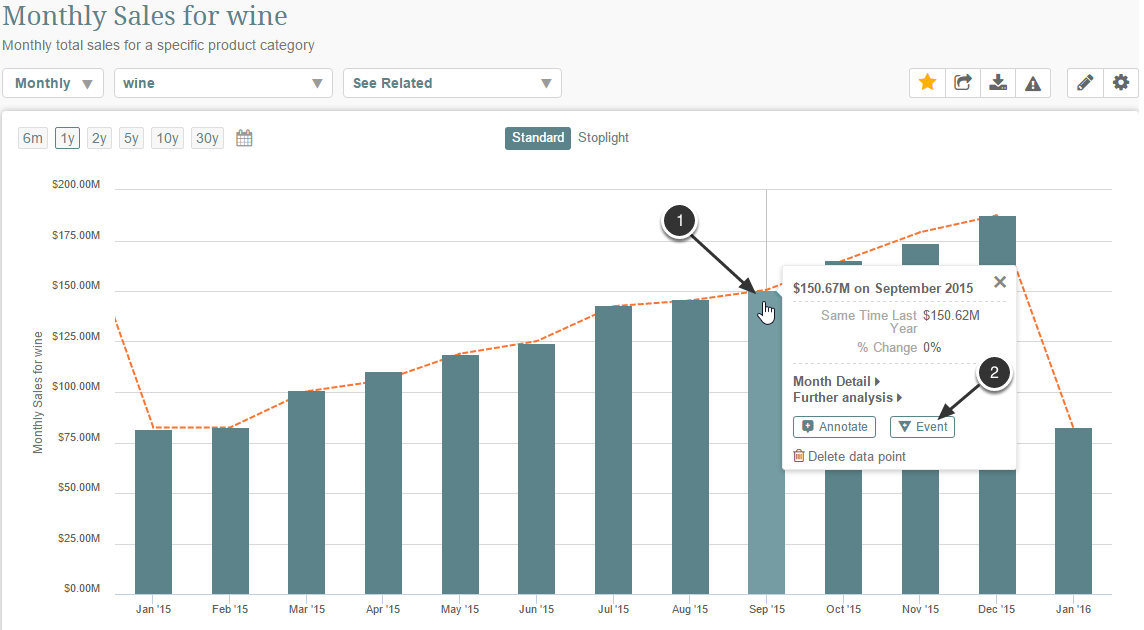
- Hover over a Data Point to open its Data Point Mouse-over Display and click to freeze display
- Click the Event button
The Add Event pop-up opens
2. Provide Information Required to Create New Event
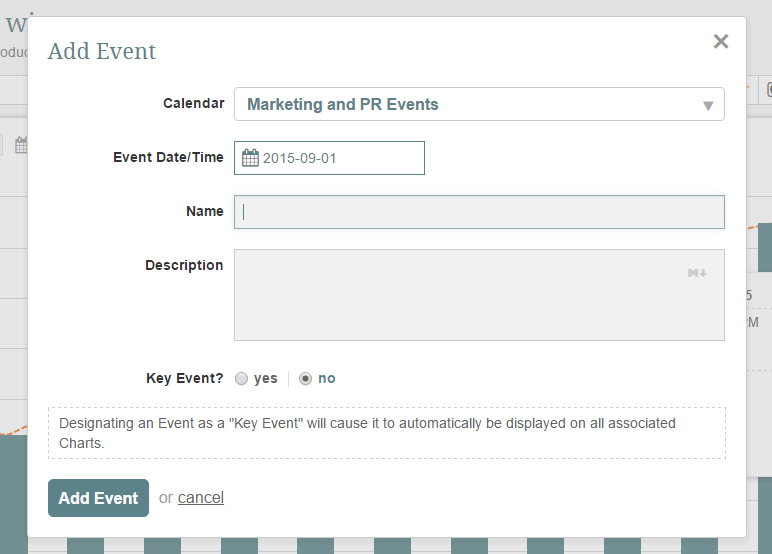
For more details, follow the instructions in Entering an Event