Annotations allow Users to share insights on a Metric or Report with other Users. Metric Insights allows applying an Annotation to a single date point or to a range of dates. It is possible to easily apply Anotation to a broad set of Elements.
Table of contents:
NOTE: To be able to create Annotations, Power Users must have either View or Edit Access to Element as well as the Add Annotation Privilege.
1. Access Metric Viewer
Open the Metric Viewer by opening the Metric Editor and clicking [View].
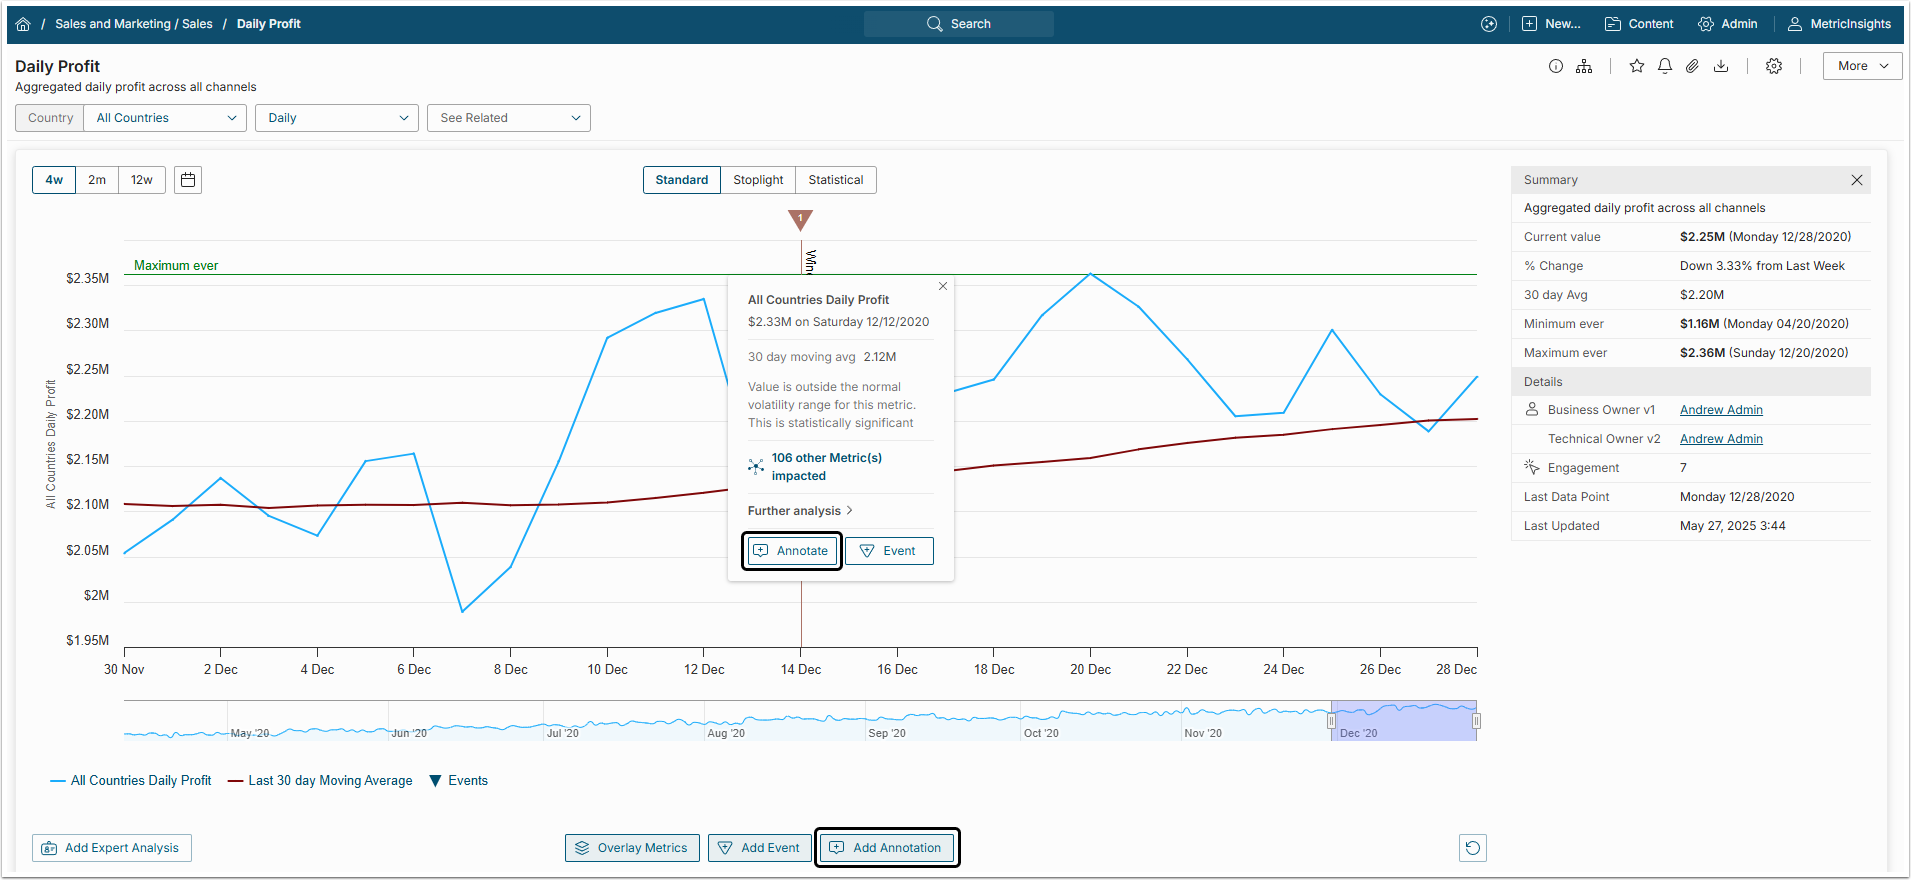
Access the Add Annotation pop-up by either:
1. Clicking on an existing Datapoint and clicking [Annotate];
2. Or clicking [Add Annotaion].
2. Define Annotation Settings
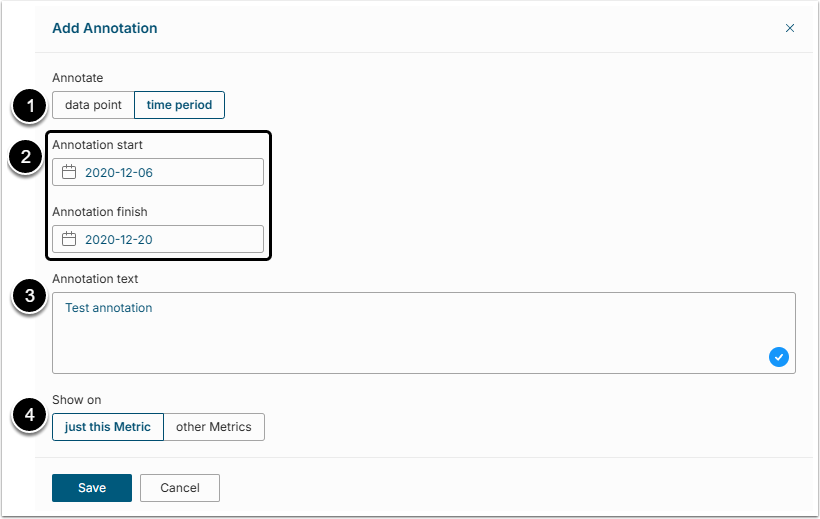
- Annotate: Select either to annotate a single data point or a whole time period.
- Annotation start and Annotation finish: Use the Calendar icons to select the dates.
-
Annotation text: Add the text.
- NOTE: To change text formatting or add a link, you need to use Markdown.
- Show on: Define either to add this Annotation only to the current Metric or to other Metrics as well.
2.1. Choose Other Affected Metrics
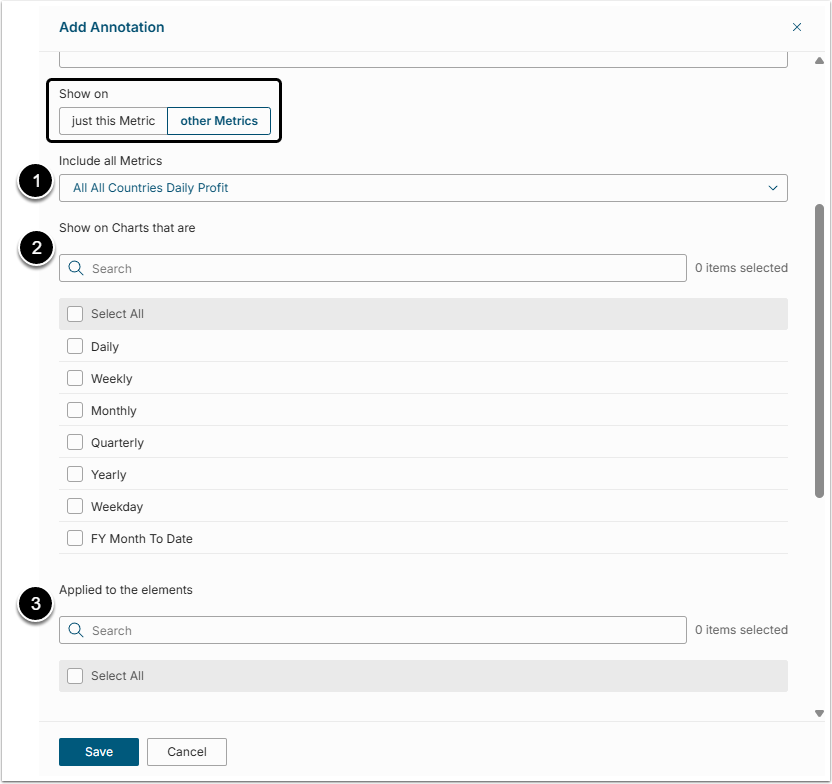
- Include all Metrics: This drop-down allows the User to select related Metrics based on various criteria (e.g. Measure of, Topic, Category).
- Show on Charts that are: It is possible to restrict Element choices based on Measurement Interval.
- Applied to elements: Check and un-check Elements to add the same annotation to their charts.
3. View the Annotation
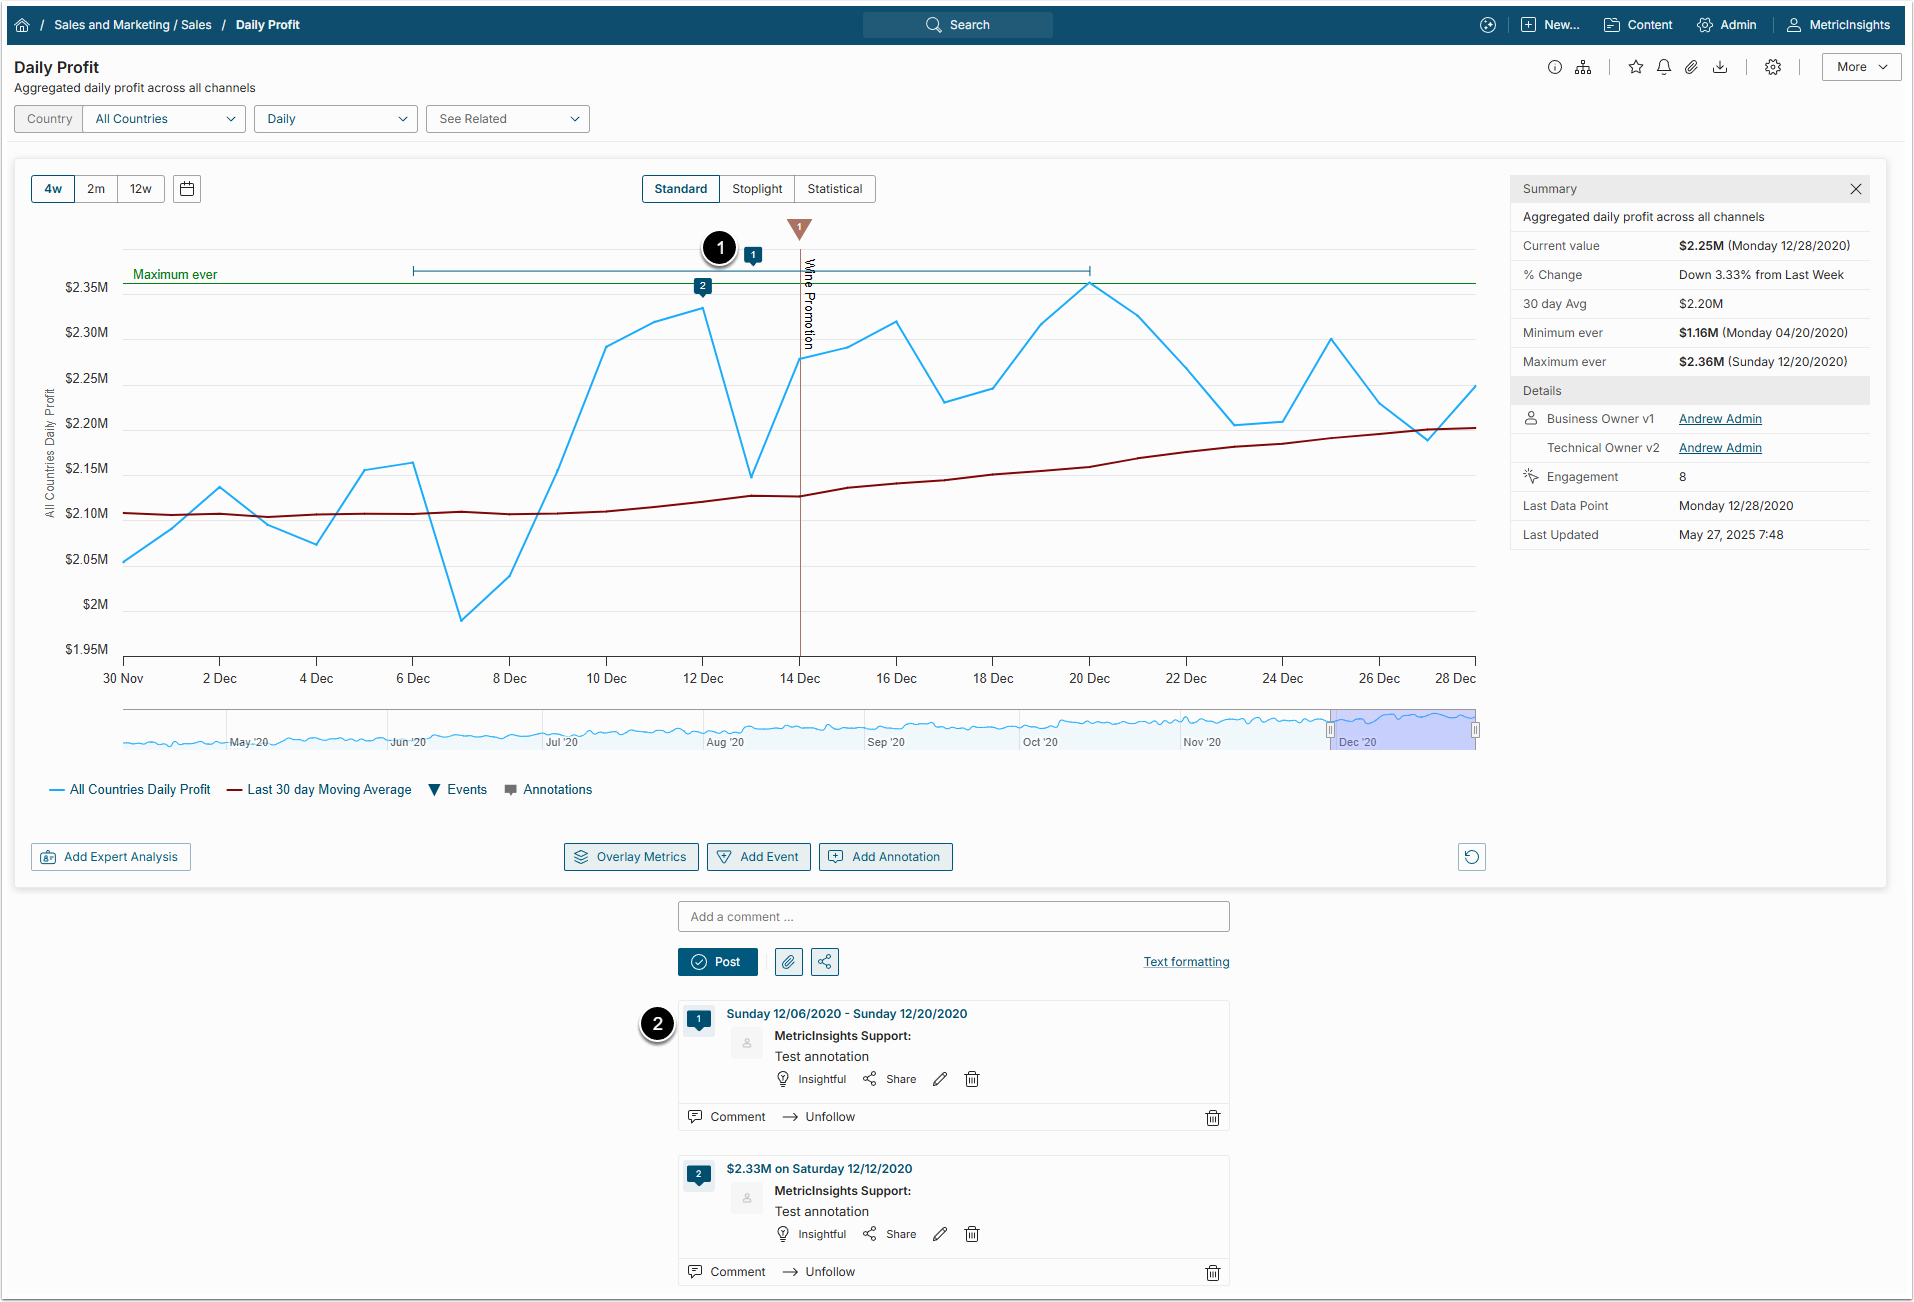
- Annotation range is indicated on Chart.
- Details on Annotation appear below the chart allowing others to comment on the Annotation.
NOTE: If existing Metric values are deleted, any data associated with the original Metric values such as Annotations will be discarded, even if the value of the data point(s) remains the same after data is recollected. For Annotations on a range of data points, if the first point in the date range is deleted and recollected, the Annotation will be deleted.
4. Adding Annotations for Future Dates
Users can easily add Annotations for a Metric's data points for which data has not been collected yet. This is helpful when a User knows something will be happening during the current or future period. The Annotation will appear on the Chart and can be viewed on the Metric Viewer below the actual chart as show below.
NOTE: Display of Future Annotations is controlled based on the last data point collected, regardless of how old that data is.