A Pivot Table is a Report editing tool that summarizes and reorganizes selected columns and rows in a Dataset table to view the data from different perspectives. This article describes how to create and customize a Pivot Table in a Dataset Report.
1. Create Pivot Table
Open the Report Editor and go to Content tab.
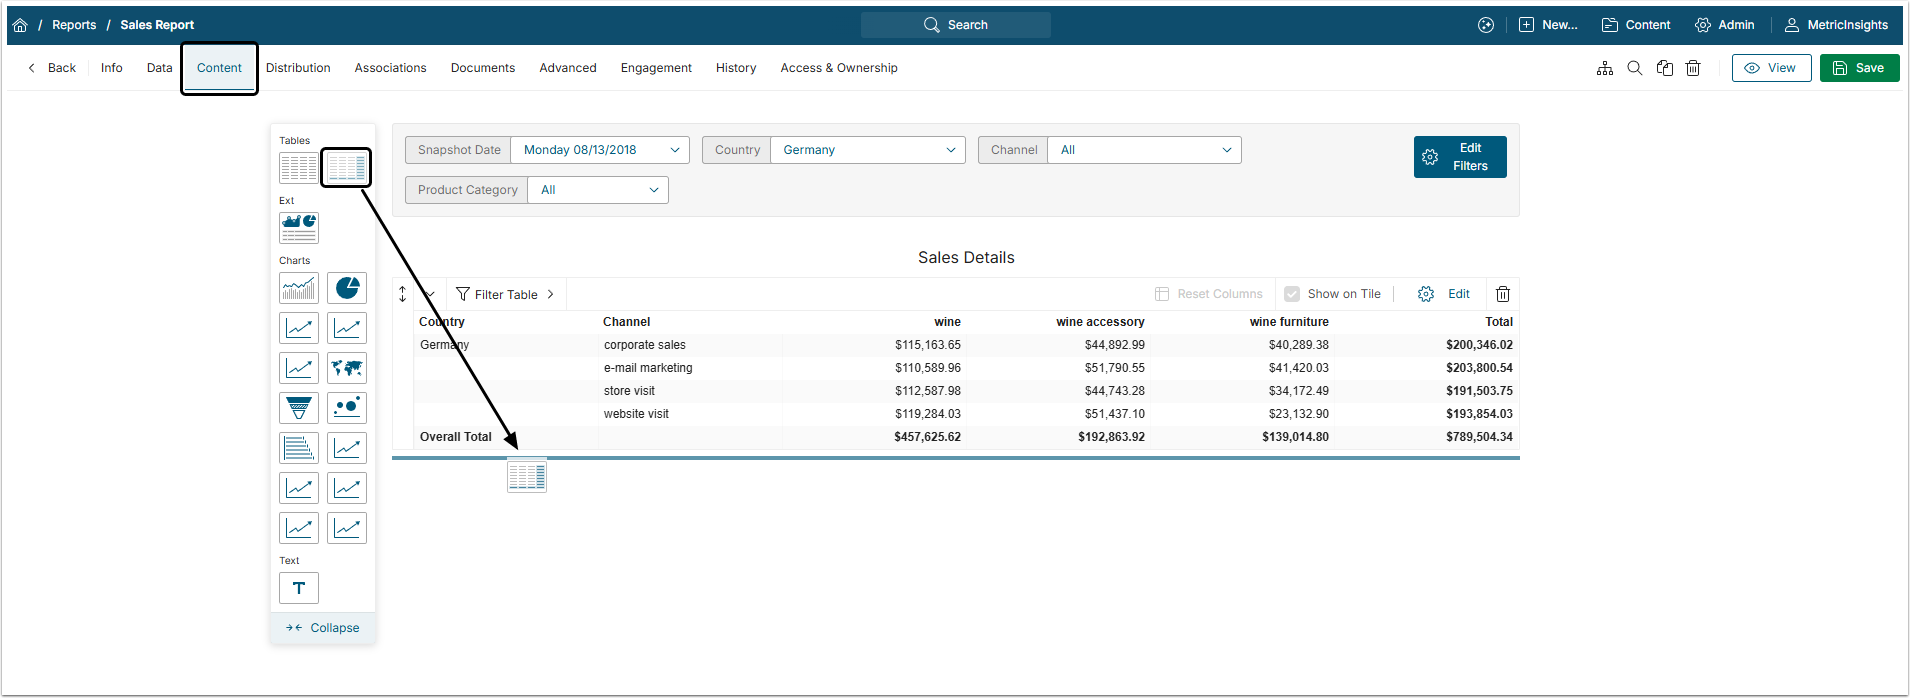
Drag the Pivot Table icon and drop it on the page. Pivot Table editor will slide out from the right.
2. Customize Pivot Table
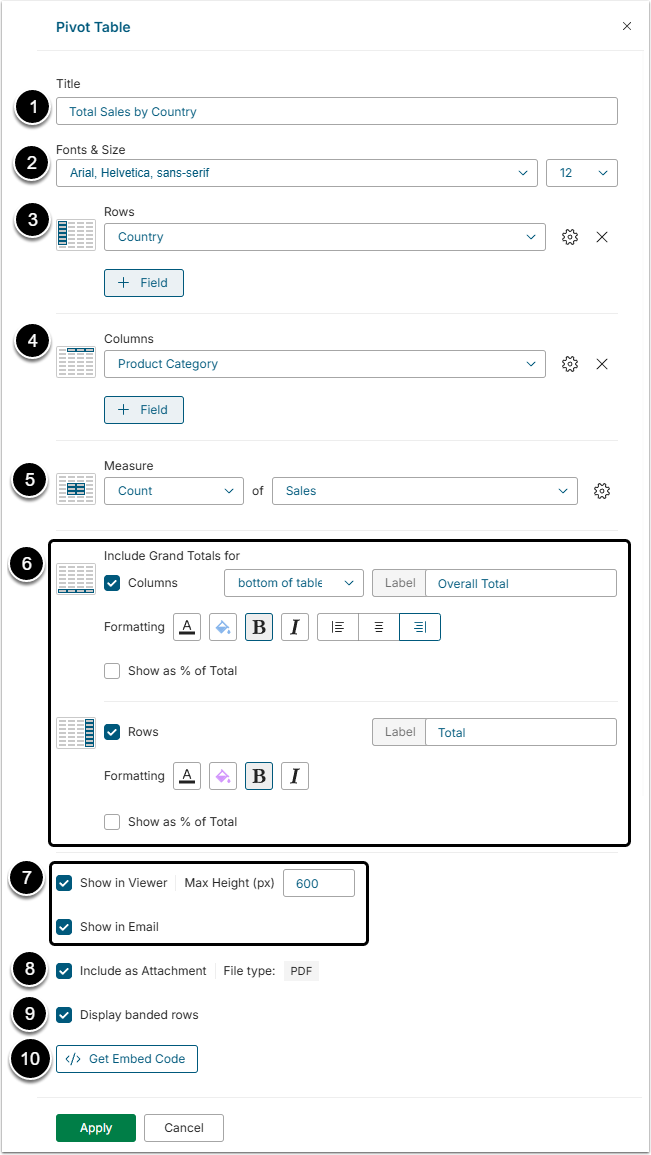
- Title: Give the table a descriptive name.
- Fonts & Size: Choose styling features for the Title.
- Rows: Select one or several values to emphasize as rows in the table.
- Columns: Select one or several values to emphasize as columns in the table.
- Measure: Choose the aggregation method and a value you want to measure.
-
Include Grand Totals for: Define if your Report should include any Grand Totals:
- Select checkboxes to add Grand Totals for either or both Columns and Rows.
- Choose location for the Grand Totals and the Label to be used.
- Select formatting features for Rows and Columns.
- Show in: Define if the pivot table will be shown in Viewer and Emails.
- Include as Attachment: Define whether the table is added as attachment to the Email.
- Display banded rows: If this checkbox is selected, the uneven table rows has slightly different gray coloring that helps to distinguish rows from each other.
- [Get Embed Code] to obtain a code that allows embedding the table to other websites.
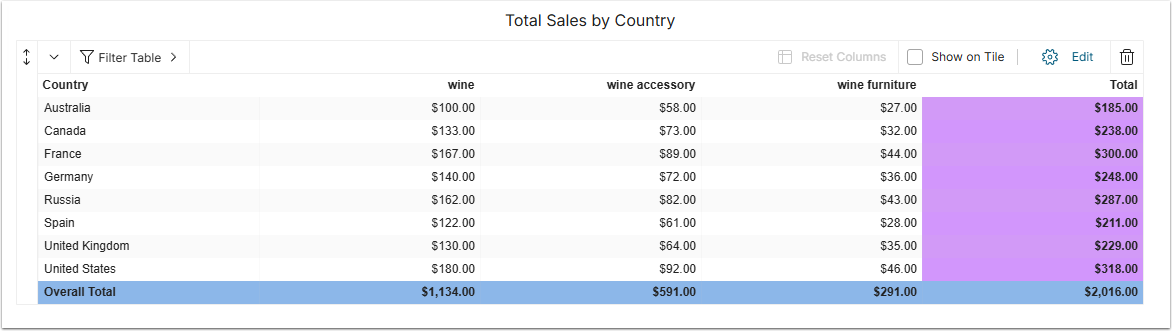
Resulting Pivot Table appearance:
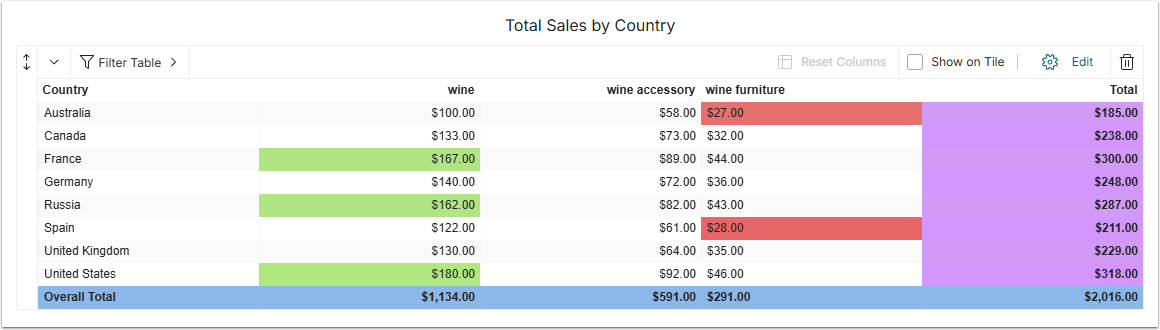
3. Add Conditional Formatting to Pinpoint Anomalies
Conditional formatting menu of the column allows to highlight some crucial values so they are easy to spot.
3.1. Open the Column Editing Menu
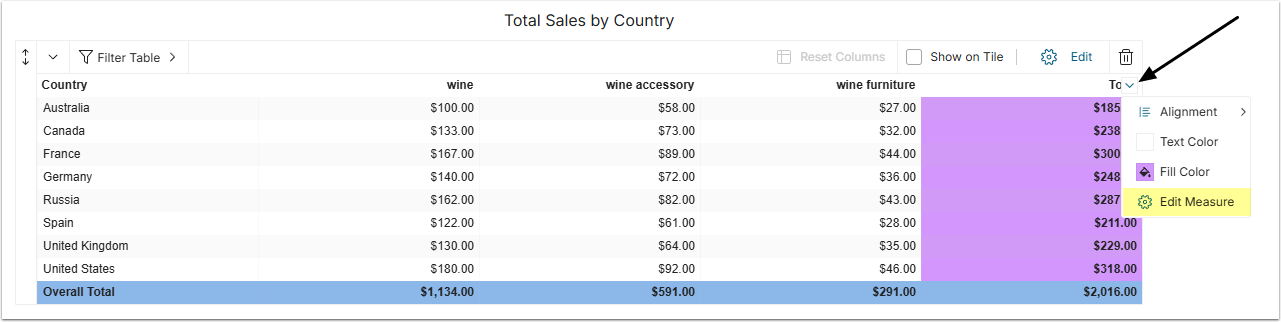
Open the Total column dropdown menu and click Edit Measure.
3.2. Add Formatting Rules
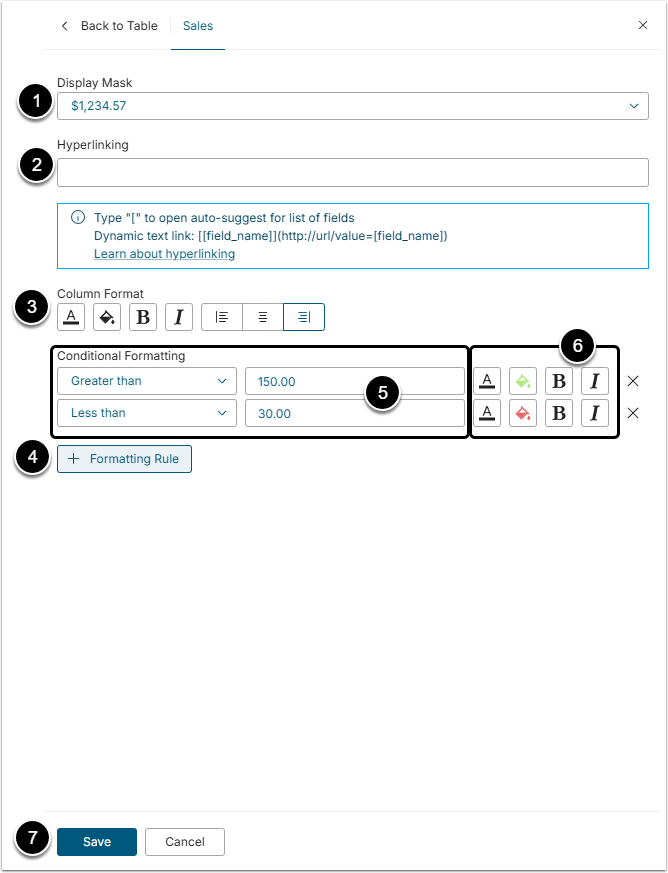
- Display Mask: Select the mask for the measured values from the dropdown menu.
- Hyperlinking: Add a link to the individual reports if needed.
- Column Format: Define the formatting of the measured values cells.
- [+Formatting Rule] to unfold the Conditional Formatting section.
- Conditional Formatting: Select the condition(s) you wish to draw attention to.
- Define formatting for the highlighted cells.
- [Save] to apply changes and view results.