Metric Insights provide Users with several ways to enhance a Report's appearance. This article describes how to apply Sections and Groupings to the Report tables.
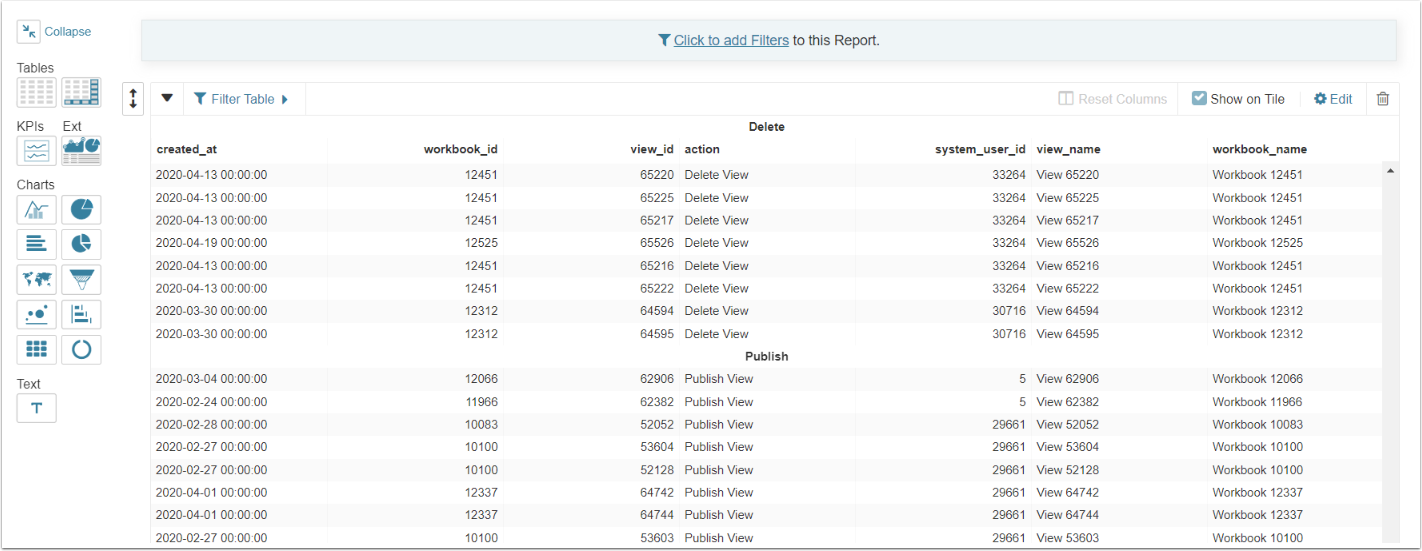
Sections provide the ability to specify an external break column (sections) for a report grid so that tables can be shown one per value of the column. Grouping provides the ability to specify that a column should group values. When set, the column values that are repeated are instead shown as blank.
1. Open the Table Editing Window
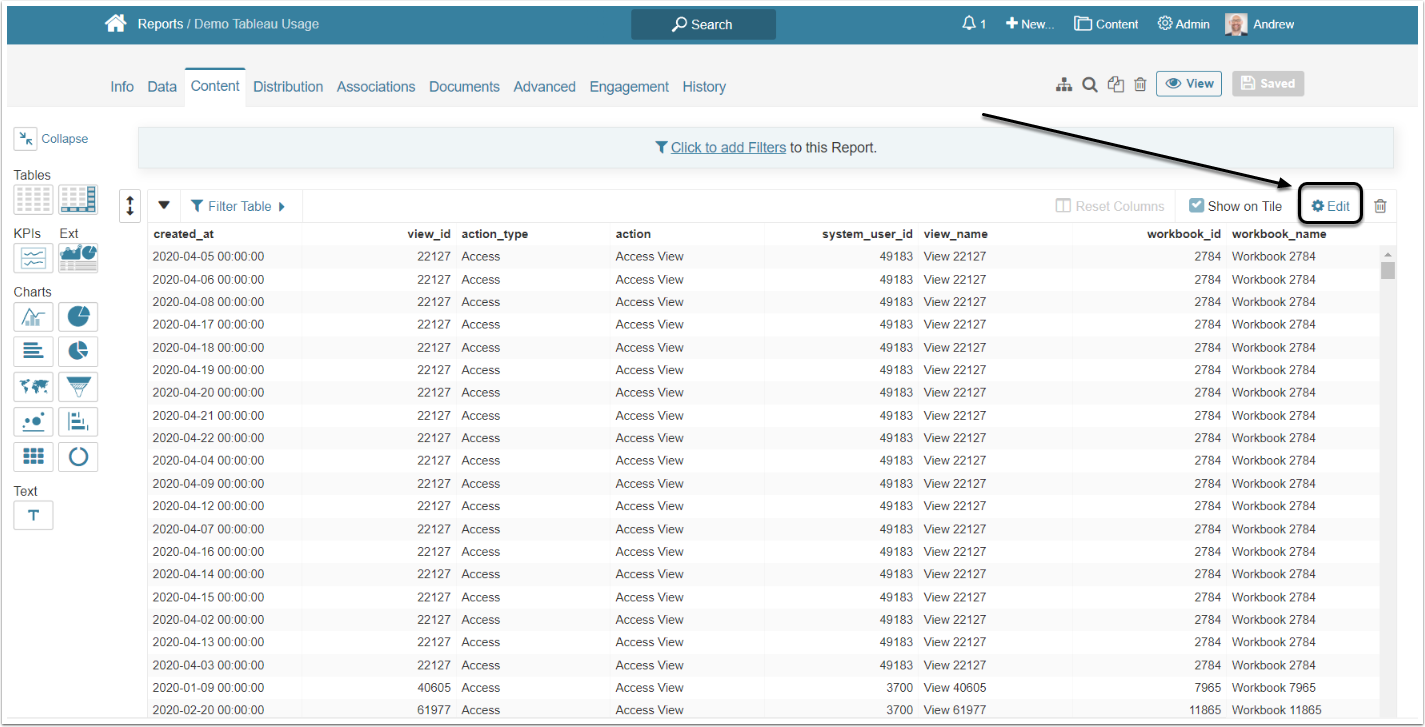
Access the Report Editor
Click Edit to open the Table Editor window
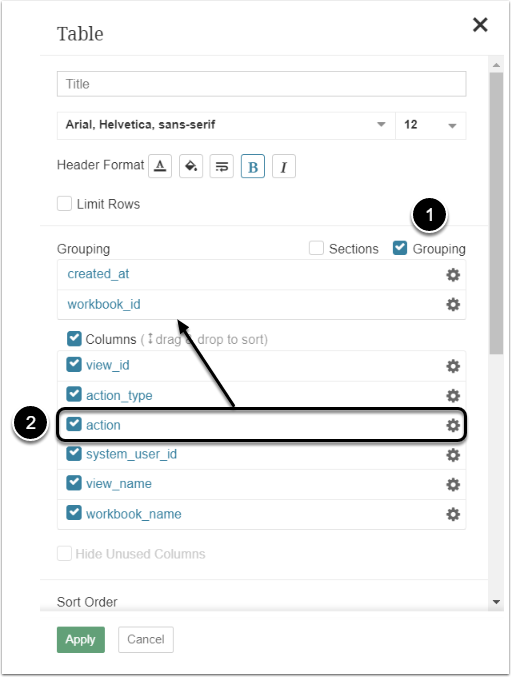
2. Applying Grouping

- Select the Grouping checkbox
- Drag-and-drop rows to order the Grouping section
2.1. Additional Sorting Options

Columns in Grouping will immediately appear in the Sort Order section. Adjust the sort as needed.
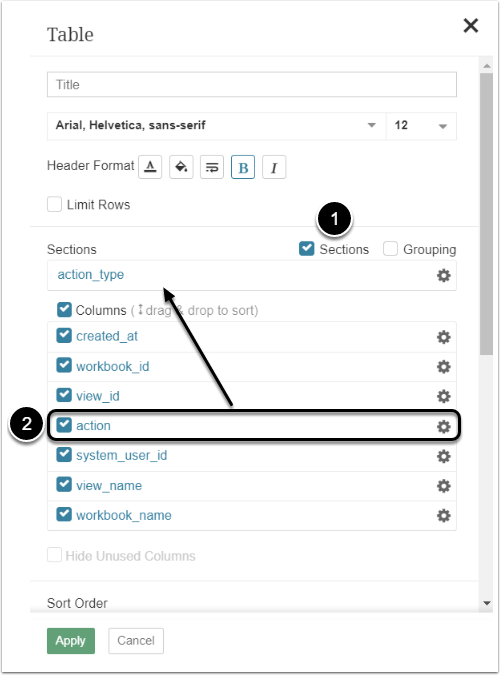
3. Applying Sections

- Select the Sections checkbox
- Drag-and-drop rows Columns grid to Sections grid
- Fields placed in Grouping grid will immediately appear in the Sort Order section - adjust the sort as needed
- Use the field-level edit icon(s) to apply additional formatting, such as Highlighting
3.1. Additional Sorting Options

Columns in Sections will immediately appear in the Sort Order section. Adjust the sort as needed.


