Metric Insight has the functionality to aggregate numeric fields directly in the Report without the need to create a new View first. The Report function mimics the ability in the Data Viewer. This article describes how to apply aggregation to the Report.
Aggregation Basics
How to access aggregation options:
- via column drop-downs;
- via the Column Editor;
- via the Table Editor.
How aggregation works:
- Aggregation regardless of type (sum, average, minimum, maximum, etc.) allows displaying unique pairs of values. If you choose to aggregate values based on a particular parameter (country, product category), the aggregation function will produce only ONE resulting value that will be a sum, an average, a minimum, or a maximum value calculated based on all existing values for that parameter.
- When aggregation is applied, matching values in all visible columns will be displayed in sets.
- Since aggregation produces pairs of unique values, sorting will not be applied to the aggregated column.
- Aggregation can be applied to multiple numeric columns.
- Both hidden and displayed columns are included in the aggregation.
Known issue: After aggregation has been applied to any numeric column, sorting can not be applied to any other column.
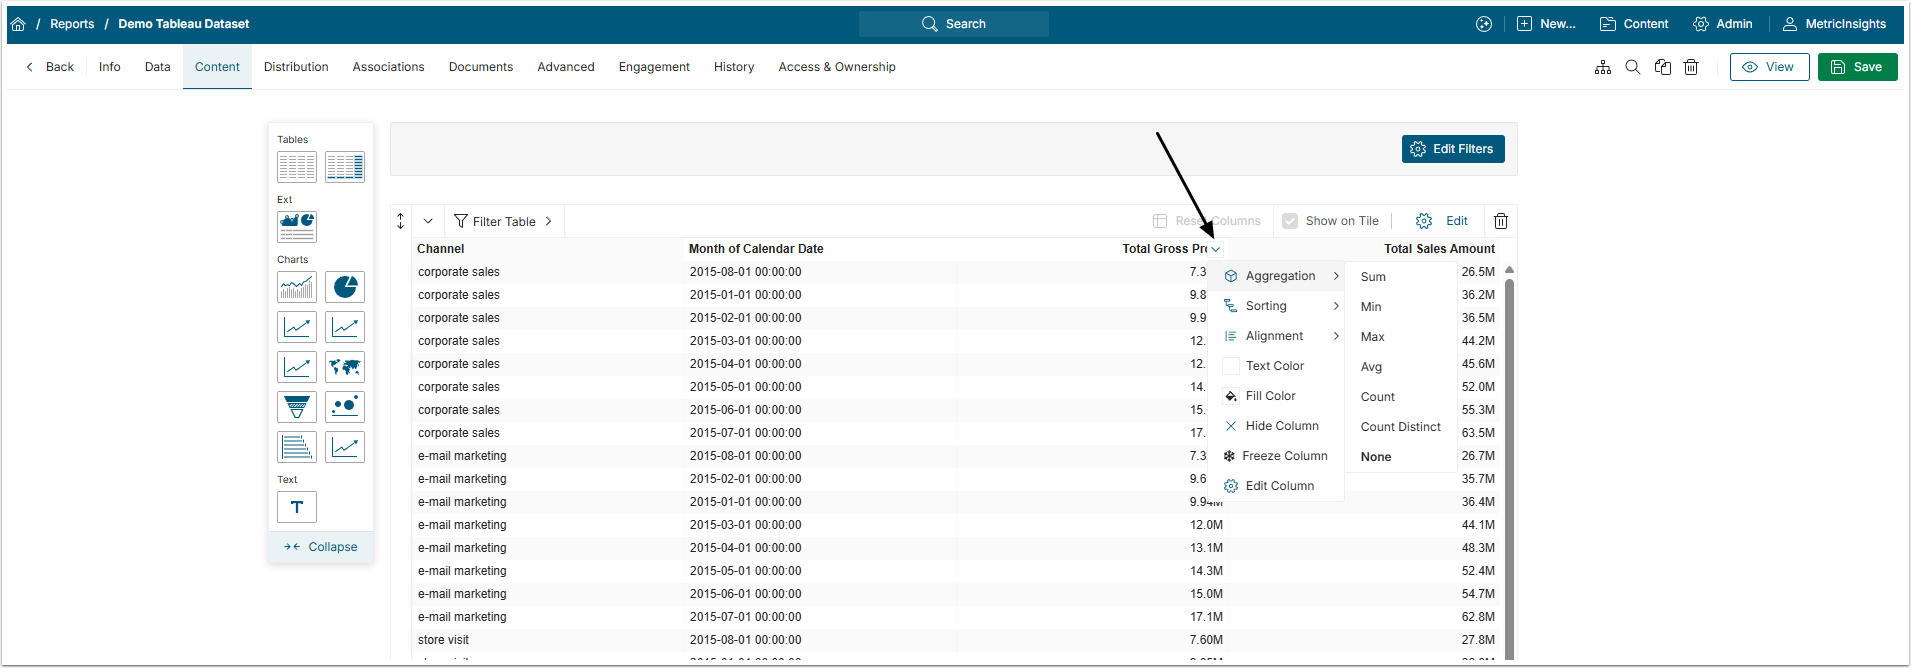
1. Aggregating via Column Drop-downs
Click the arrow down icon on the numeric values column to open the column drop-down menu and find Aggregation.
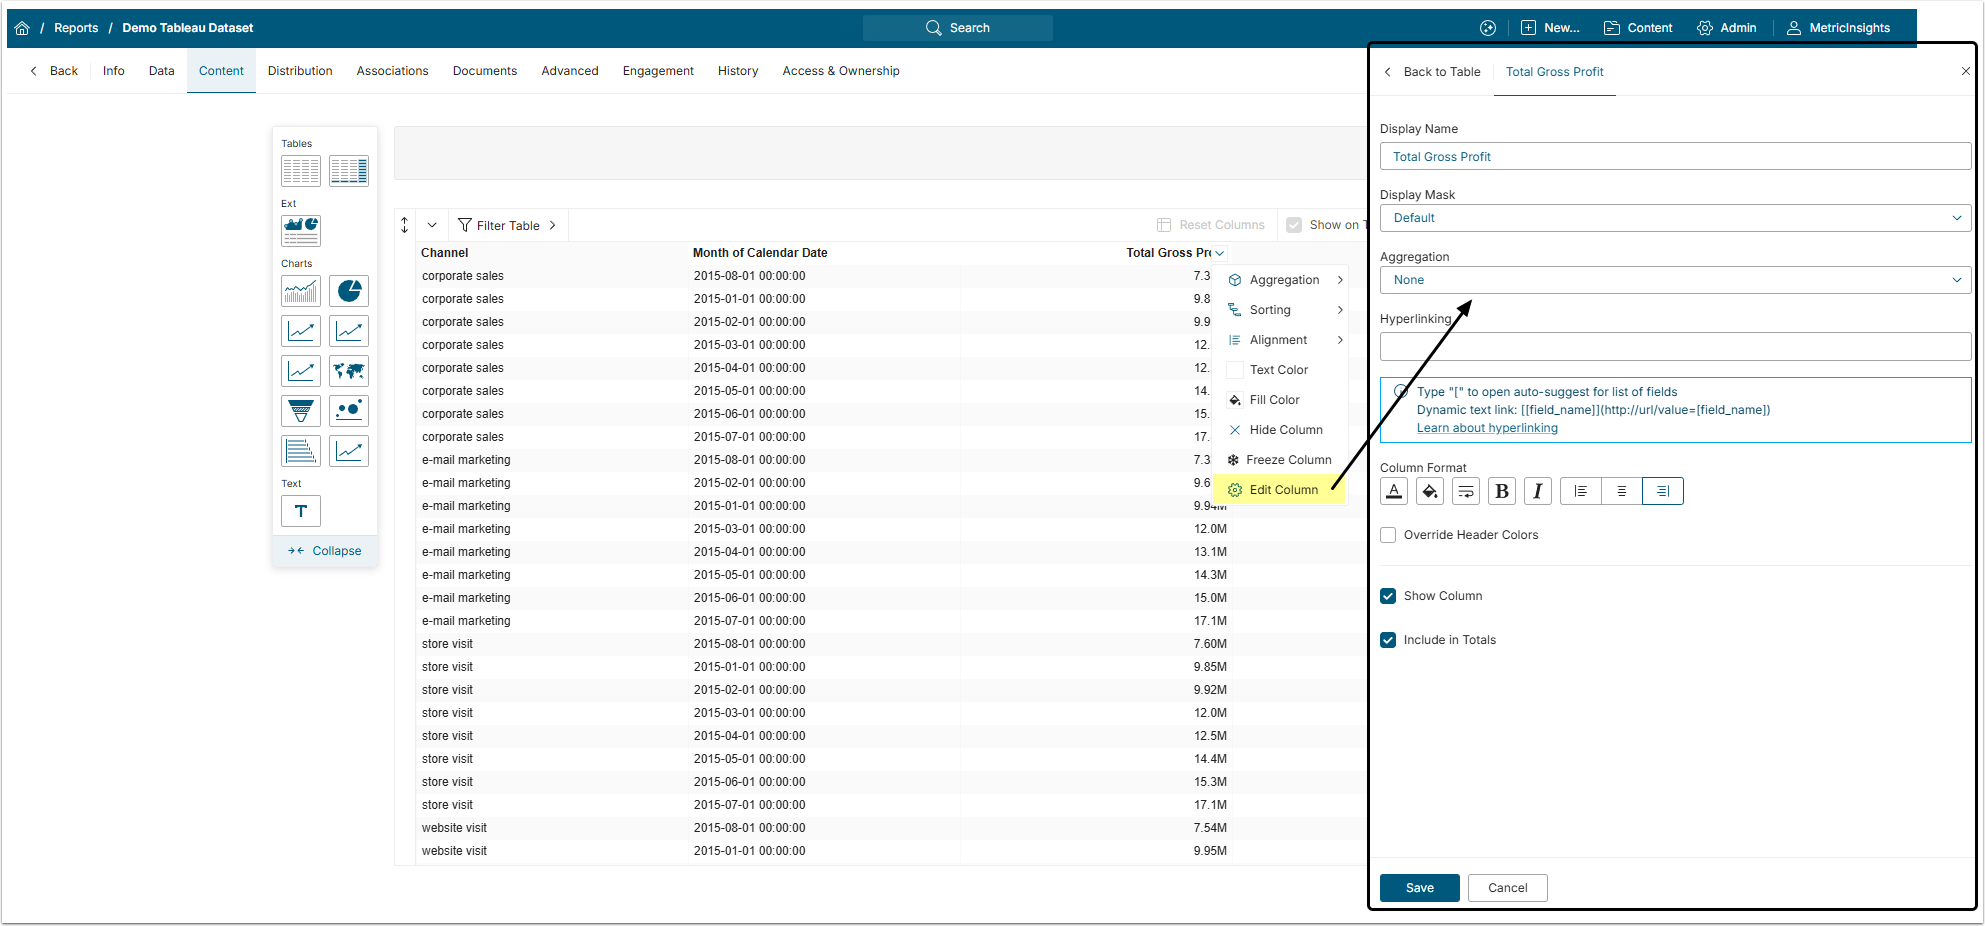
2. Aggregating via Column Editor
Click the arrow down icon on the numeric values column to open the column drop-down menu and click Edit Column. Select aggregation type in the Aggregation drop-down menu.
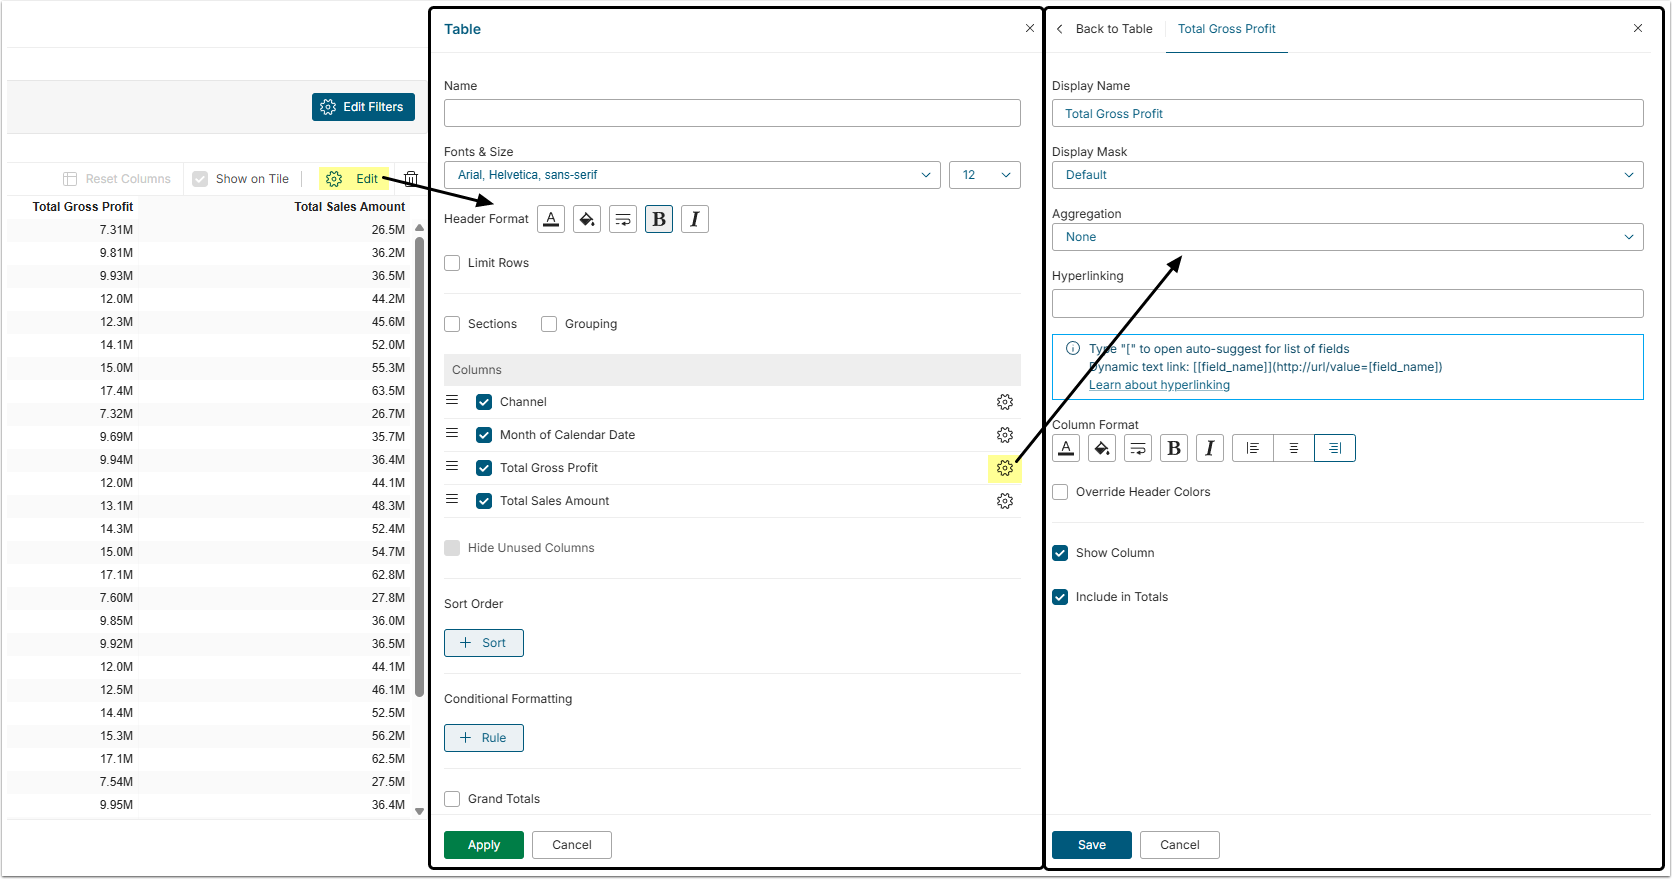
3. Aggregating via Table Editor
Click Edit in the right upper corner of the table to open Table Editor. Find the column with numeric values in the Columns section and click gear icon in its row. Select aggregation type in the Aggregation drop-down menu.