Dataset Reporting allows for custom configuration of Charts available to content builders. Metric Insights Admins can extend the existing list of the default charts available, beyond Line/Bar/Area charts, Pie charts, Map charts, Bubble charts, Funnel charts and Range charts.
This article details how to add a Custom Chart to Metric Insights and make it available for use in Dataset Reporting for all content builders.
For more information, refer to the Creating Charts in Dataset Reporting article.
1. Open Chart Templates List
Access Admin > System > Charting Options and open the Templates tab.
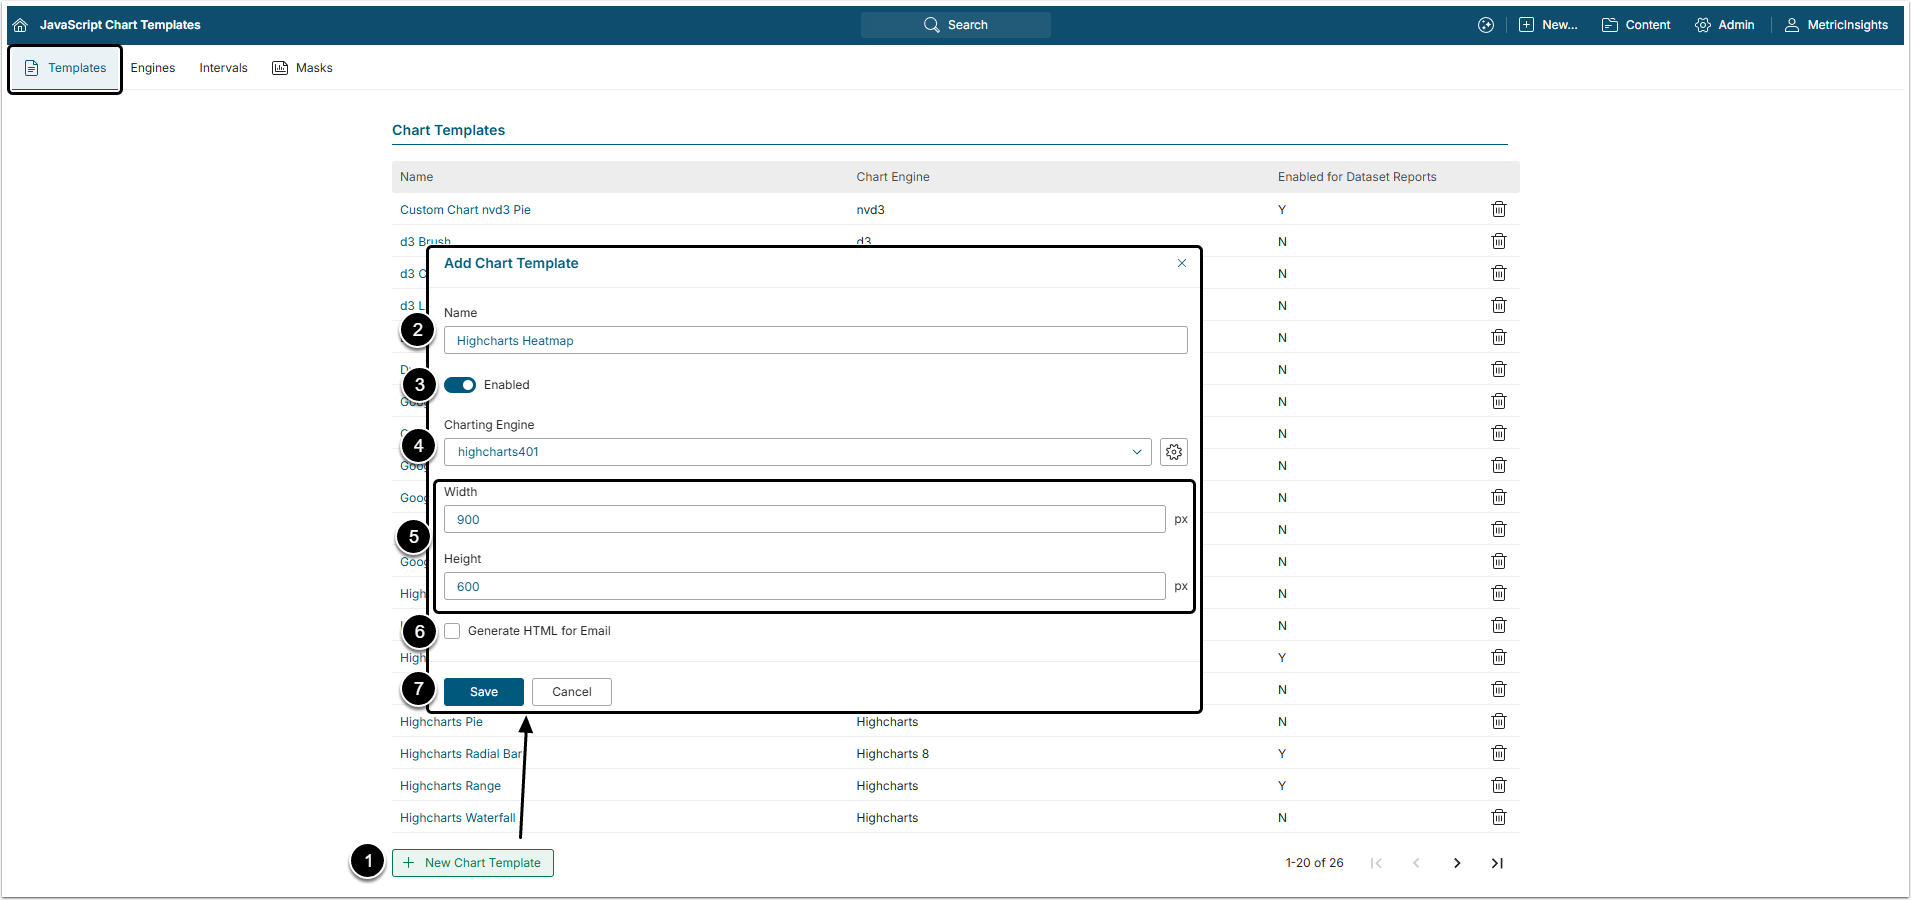
- [+New Chart Template]
- Name: Give the Chart Template a descriptive name.
- Switch the Template to "Enabled"
- Charting Engine: Select the required engine from the drop-down list.
-
Width / Height: Specify the width and height of the chert window in pixels.
- Defaults are 900x600, modify if required.
-
Generate HTML for Email: Select this checkbox to be able to control how the Chart is displayed in an email by your email program
- NOTE: This requires writing an additional piece of HTML code.
- [Save] to proceed to Editor.
2. Info Tab
Design your Chart by providing the code and adding custom properties in the corresponding sections.
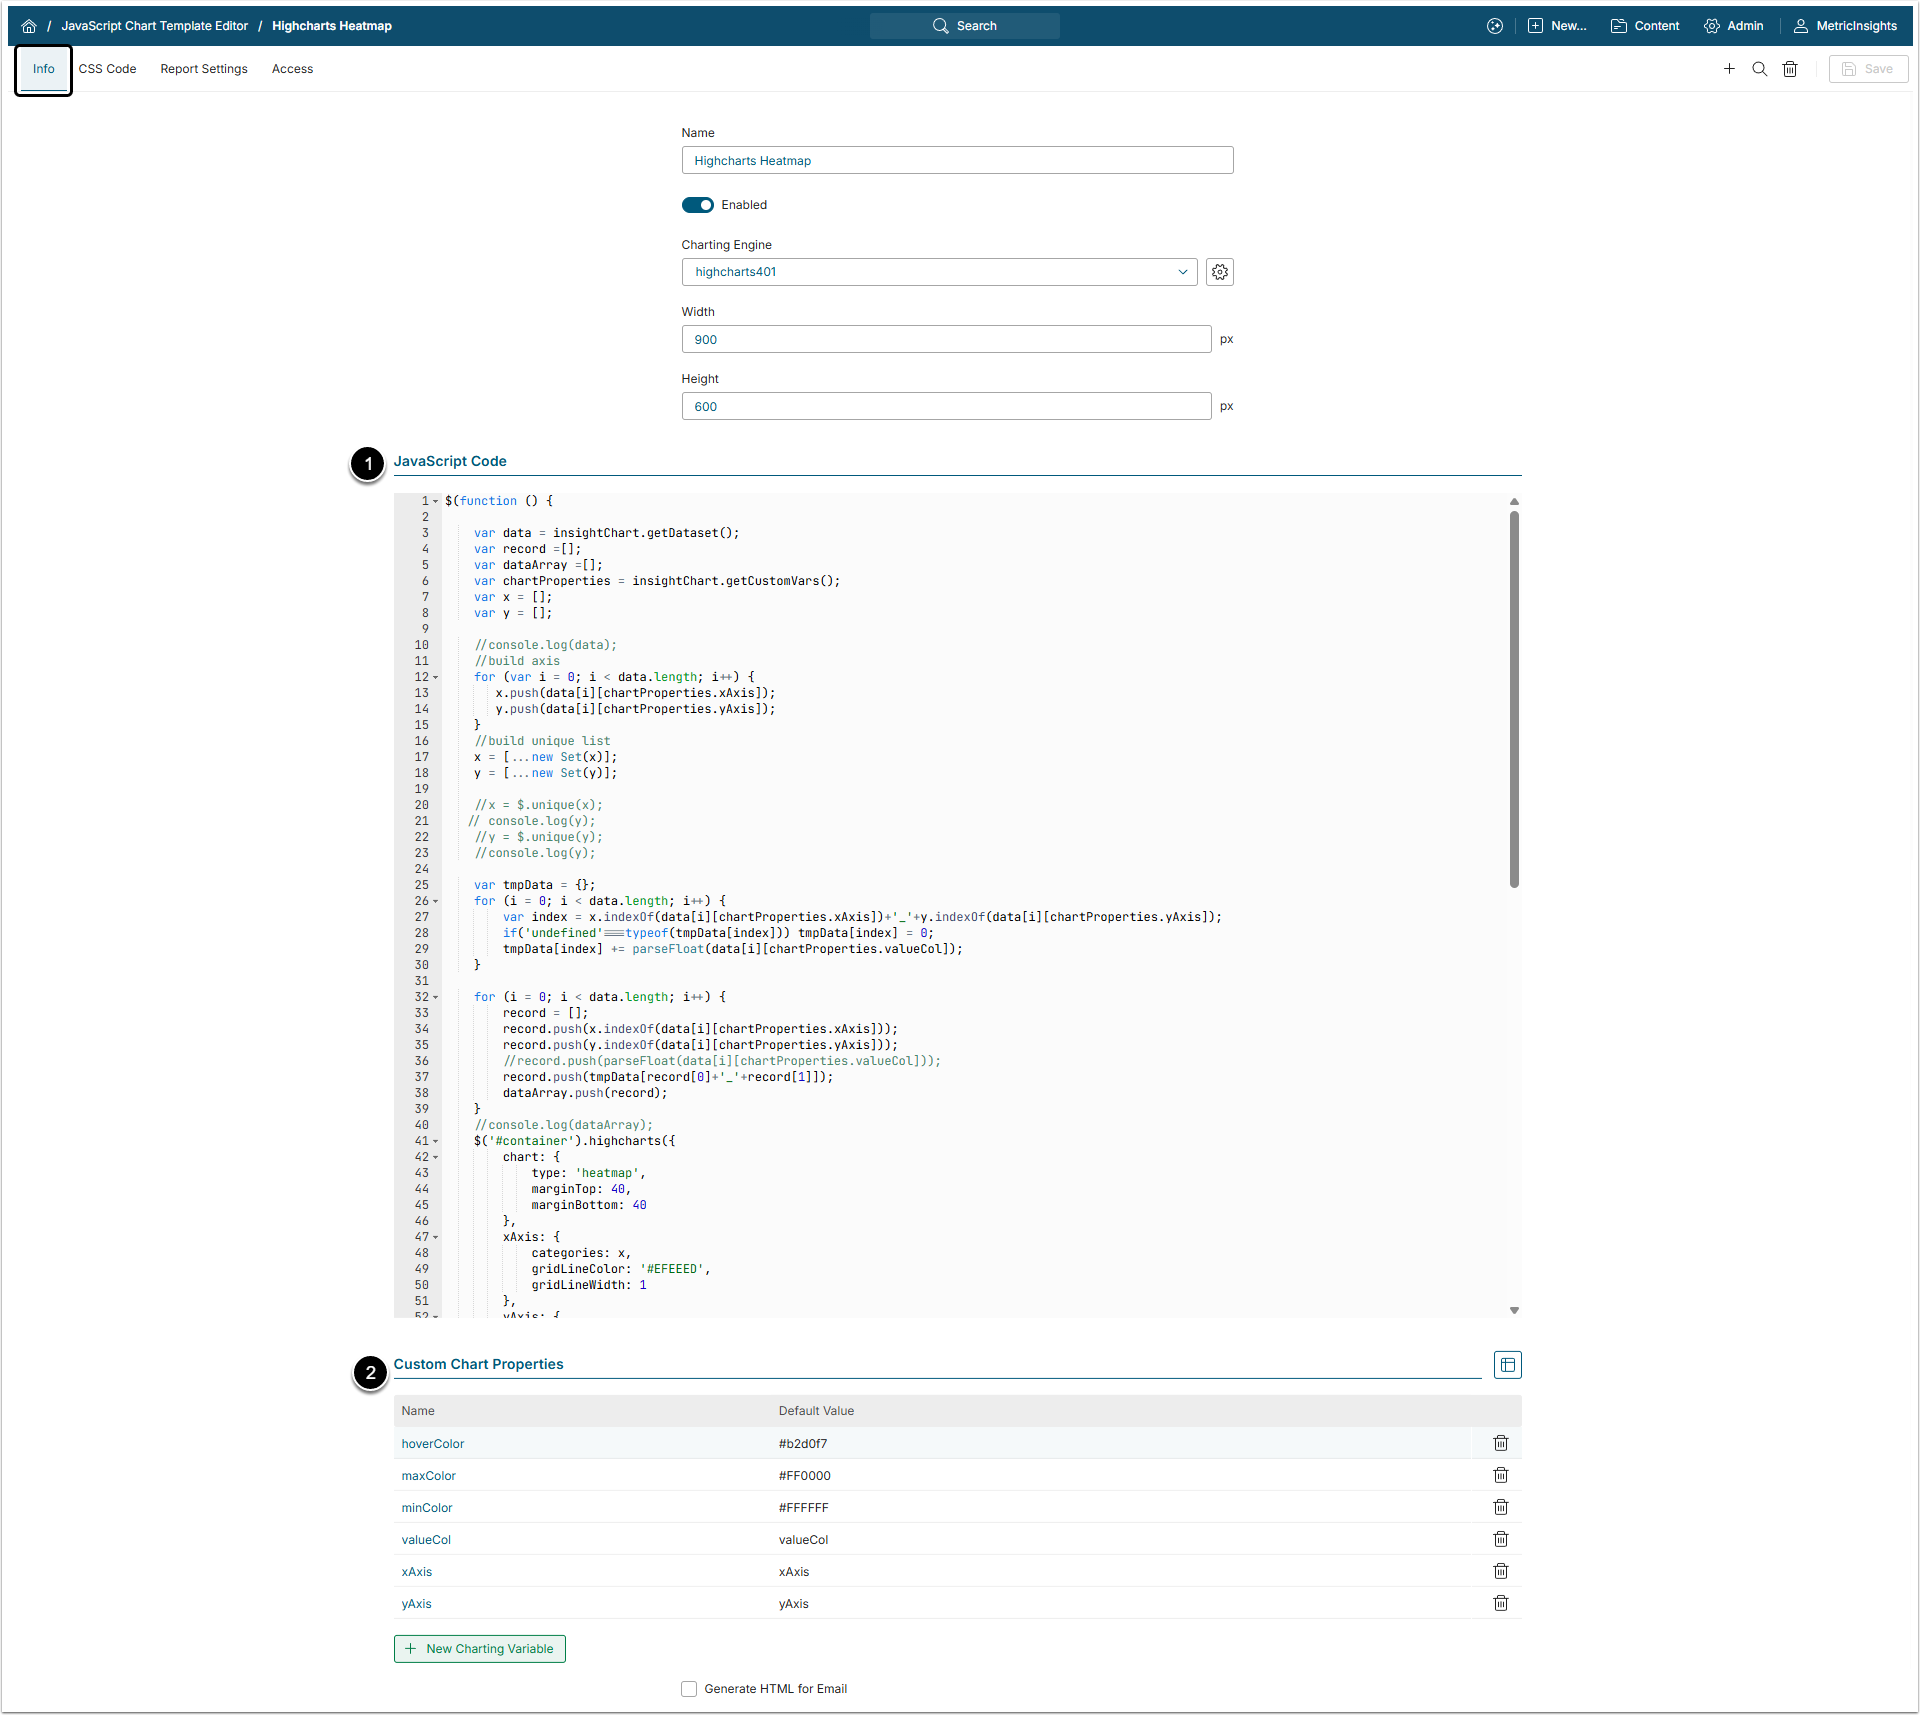
On the Info tab, configure the following:
- JavaScript Code: It is the only required code for the Chart Template.
-
Custom Chart Properties: Depending on needs, an Admin can add custom Charting Variables.
- Click [+New Charting Variable] to customize your Chart with labels, colors or custom actions.
3. Report Settings Tab
To make your Chart accessible for Dataset Reporting, go to the Report Settings tab.
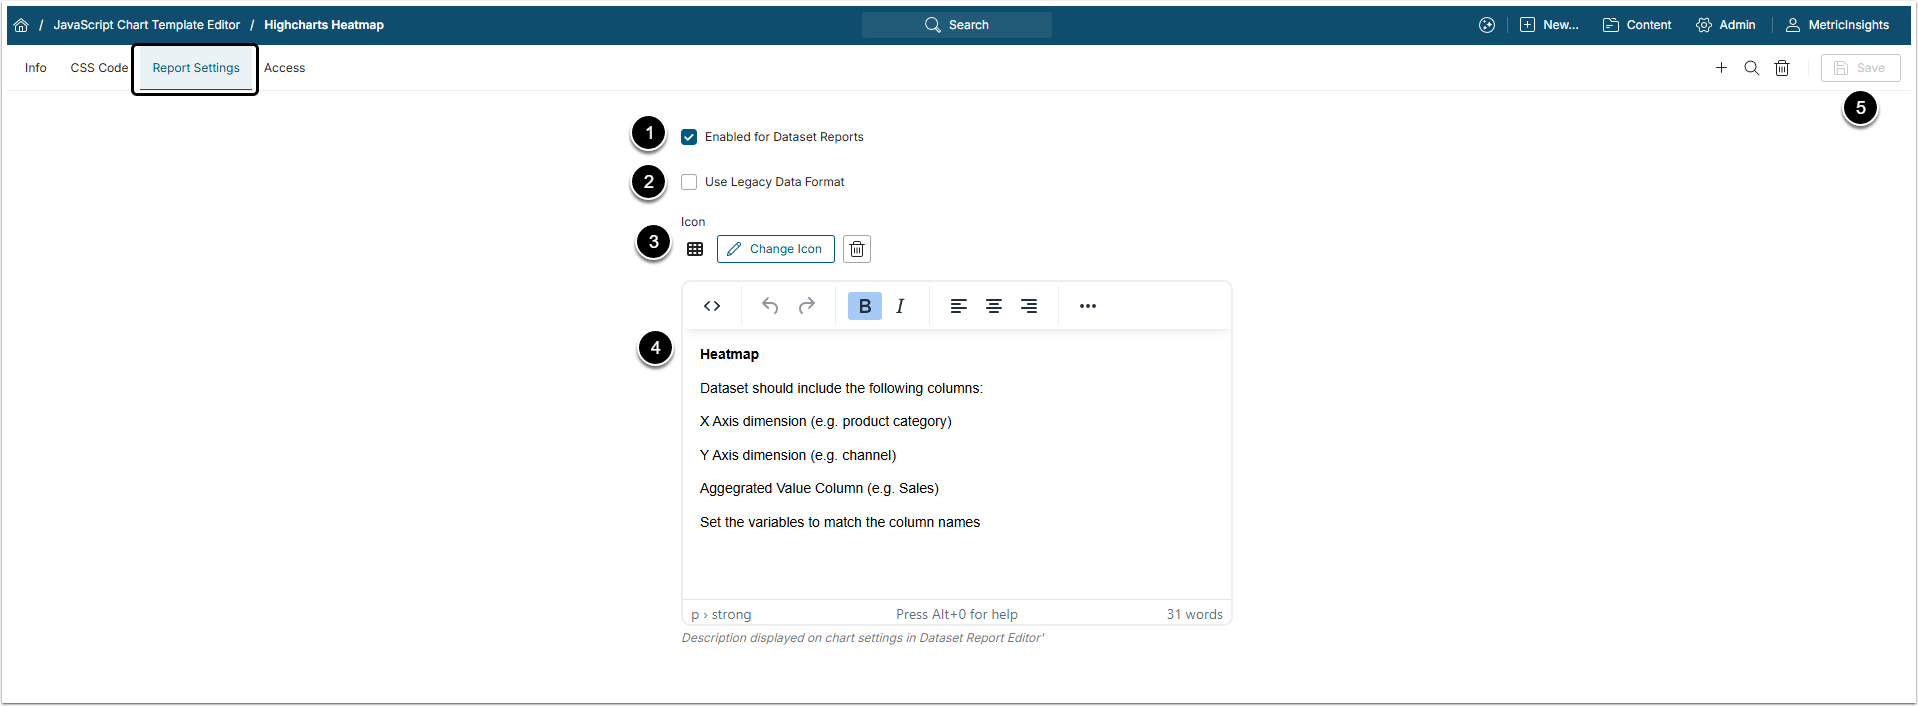
- Enable for Dataset Reports: Must be enbled if you plan to use this Chart Template when building Dataset Reports.
-
Use Legacy Data Format: This checkbox is activated by default.
- Legacy Data Format requires less space and allows faster data transfer. NOTE: This format has to be additionally converted for use by applying a special function.
- When Legacy Data Format is turned off, you will be using the new Data Format that does not need to be converted and is ready for use. NOTE: Data in this format requires more storage space and is transferred more slowly.
- Click [Select Icon] to open a pop-up with options.
- Description: Add a description of how this chart should be used. This is helpful for content builders who are not familiar with the chart type and might need some guidance.
- [Save] inputs.
After a Custom Chart has been added, it will appear as a new option in the Charts section.