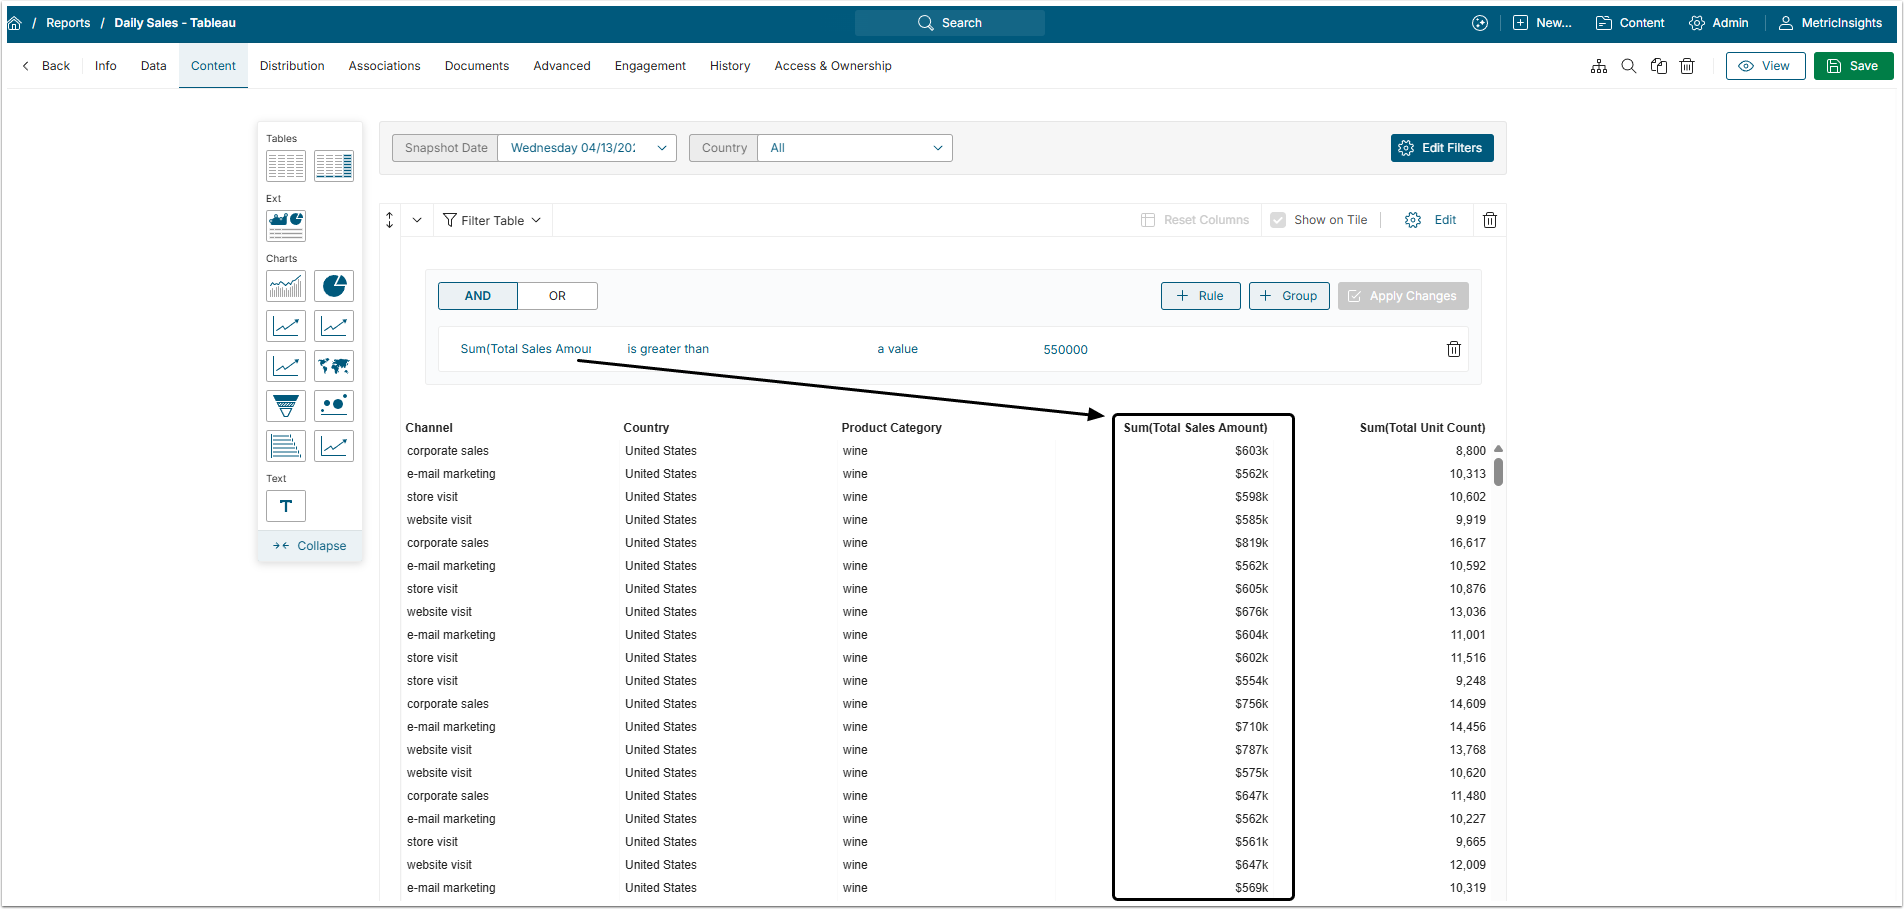
Dataset Reports can be modified using Filters in the Report Editor.
There are two types of Filters available in the Content tab of the Report Editor. These Filters limit the data that is displayed when viewing the Report online or in Notifications such as Bursts or Digests:
- Report Filters apply to all of the Report's Elements (Tables, Charts, and linked External Visualizations). These appear as drop-downs that can be adjusted by the Viewer, much like Dimension drop-downs in older versions of Metric Insights.
- Table Filters apply to a single Table or Chart, are fixed, and can only be modified in the Report Editor.
This article describes types of Filters and how to apply them to the Report.
An Overview of Dataset Report features is available in Dataset Reports Overview article.
Report Filters
1. Open Report Filters Window
Access Reports List, open Report Editor by clicking the necessary Report Active Name Link, and open the Content tab
1.1. Report Built from Snapshot Datasets
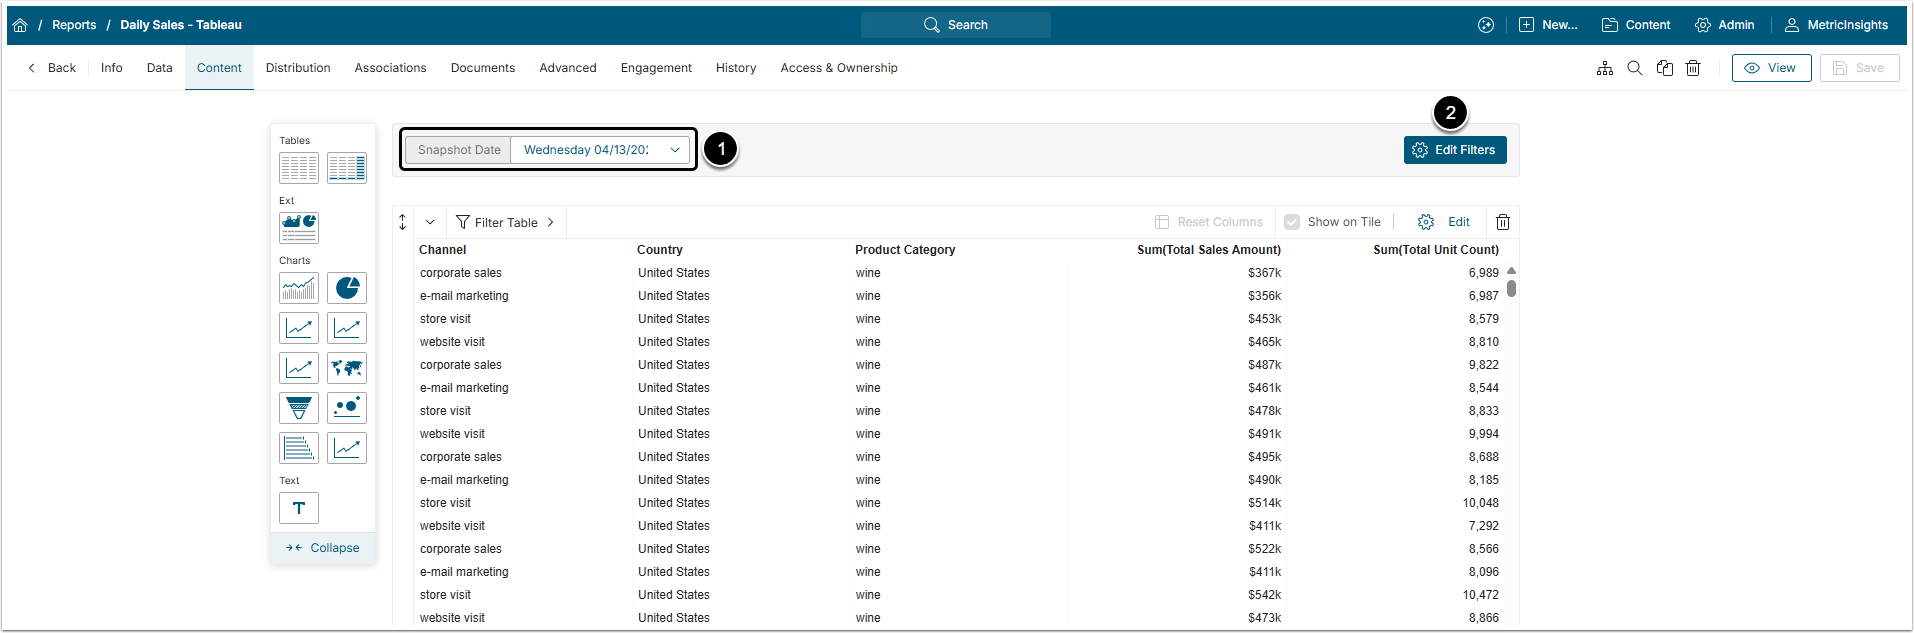
- A Snapshot Date Filter is created automatically for all Snapshot Reports. Reports built with dates already present in Data do not have this filter.
- To add other Report level Filter(s) click [Edit Filters].
2. Define Filters
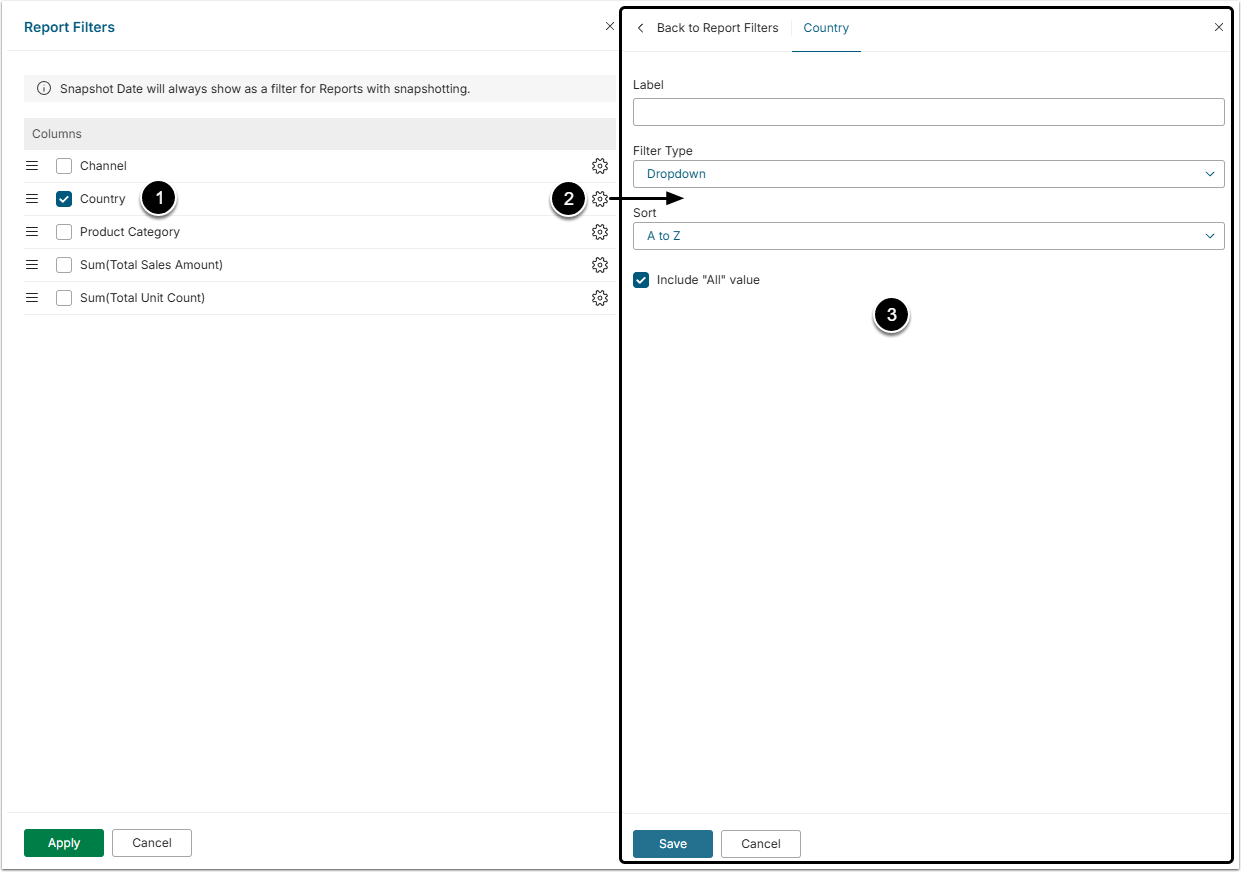
- Select the checkbox near the name of the column that will be filtered to add a Filter.
- Click the gear icon in the Filter's row to open the filter editing window.
- Change the Filter Label, Filter Type and Sorting type.
- Include "All" value: Appears when Filter Type is set to Dropdown. Allows you to add an "All" choice to the Filter's dropdown list for clearing the Filter back to unfiltered without a separate reset action.
- Dataset includes "All" value: Appears when Include "All" value is enabled. Use this setting when the Dataset already contains its own pre-calculated "All" or rollup row to avoid adding the individual rows and the pre-calculated row together. Specify Label by entering the actual name of the row from the Dataset.
- Optionally, you can Use External Filter Values via a specially created Dataset.
- Set Default Value: Enable to set a starting value for the filter, instead of loading the Report unfiltered. When turned on, a picker appears matching the filter's type, so you can choose the default value(s).
- Range filters: require both a from and to value. If none are set, the picker defaults to the dataset's min/max.
- Dropdown and charting interval filters: accept only one value. Selecting a second value replaces the first.
- The default applies each time the Report loads, until you change the filter.
- [Save]
3. Check the Filters
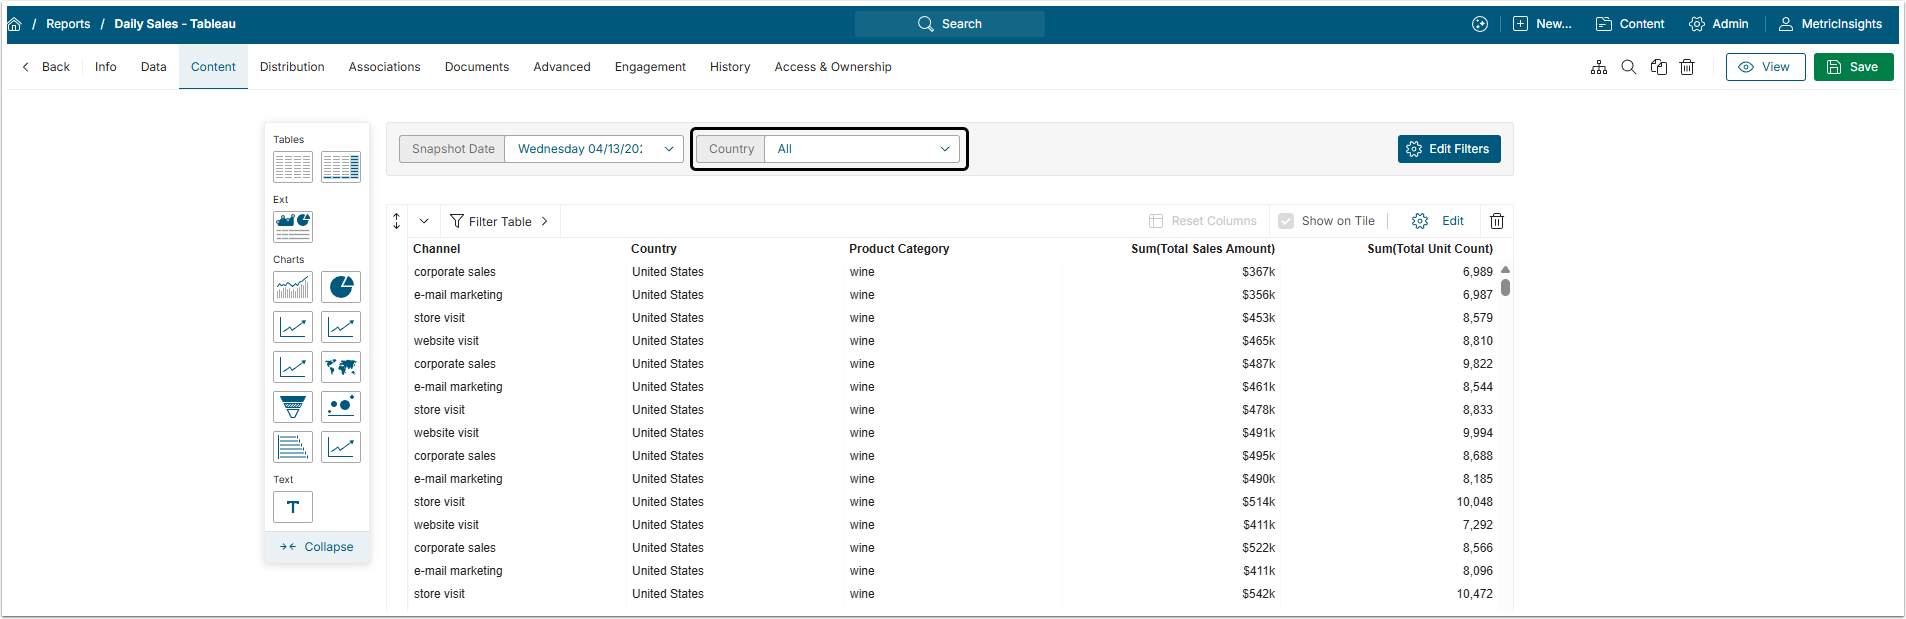
Table will now be viewed based on the Filter choices in both the Editor and the Viewer.
Table Filters
1. Open Filter Table and Add the Rules
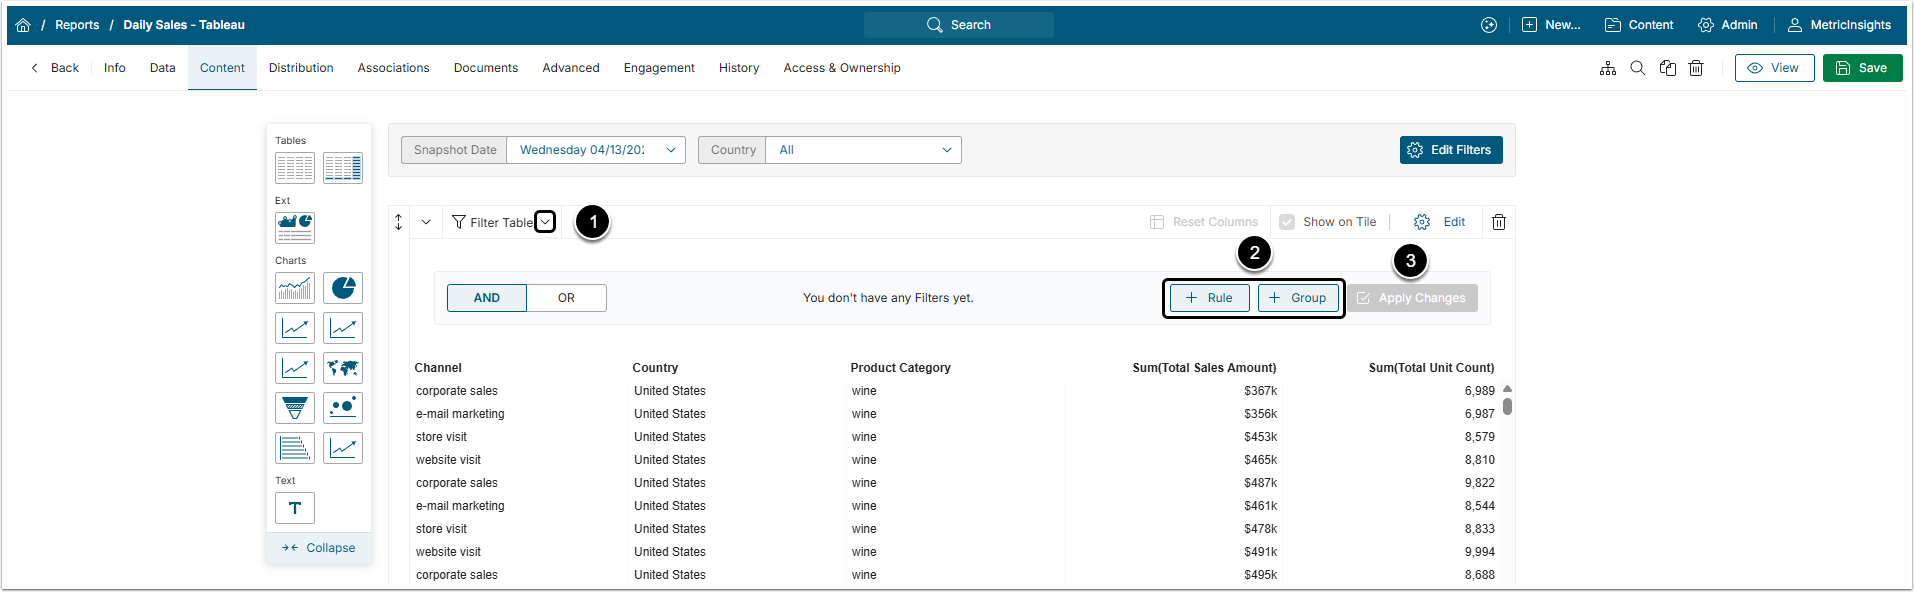
- Click Filter Table to open folded section.
- Click Add a Rule and add as many Groupings and Rules as you need.
- For more details about Rules and groups check Dataset Viewer Filter Rules.
- [Apply Changes]
NOTE: Filters set in a Dataset Report will be applied to all of the Report's Elements (Tables, Charts, and linked External Visualizations). These appear as drop-downs that can be adjusted in the Viewer.