Guided Analysis is an analytical feature designed to perform basic change analysis of data by comparing two time intervals/dates. Visual representation of the generated analysis simplifies understanding of key points and possible reasons for the behavior presented. Once built, charts can be saved and shared with Metric Insights Users.
PREREQUISITES:
- A Dataset must include a date column and a numeric column
- The ENABLE_GUIDED_ANALYSIS System Variable must be set to "Y"
1. Access Analysis Editor
Access a Dataset Viewer > Actions > Perform Analysis
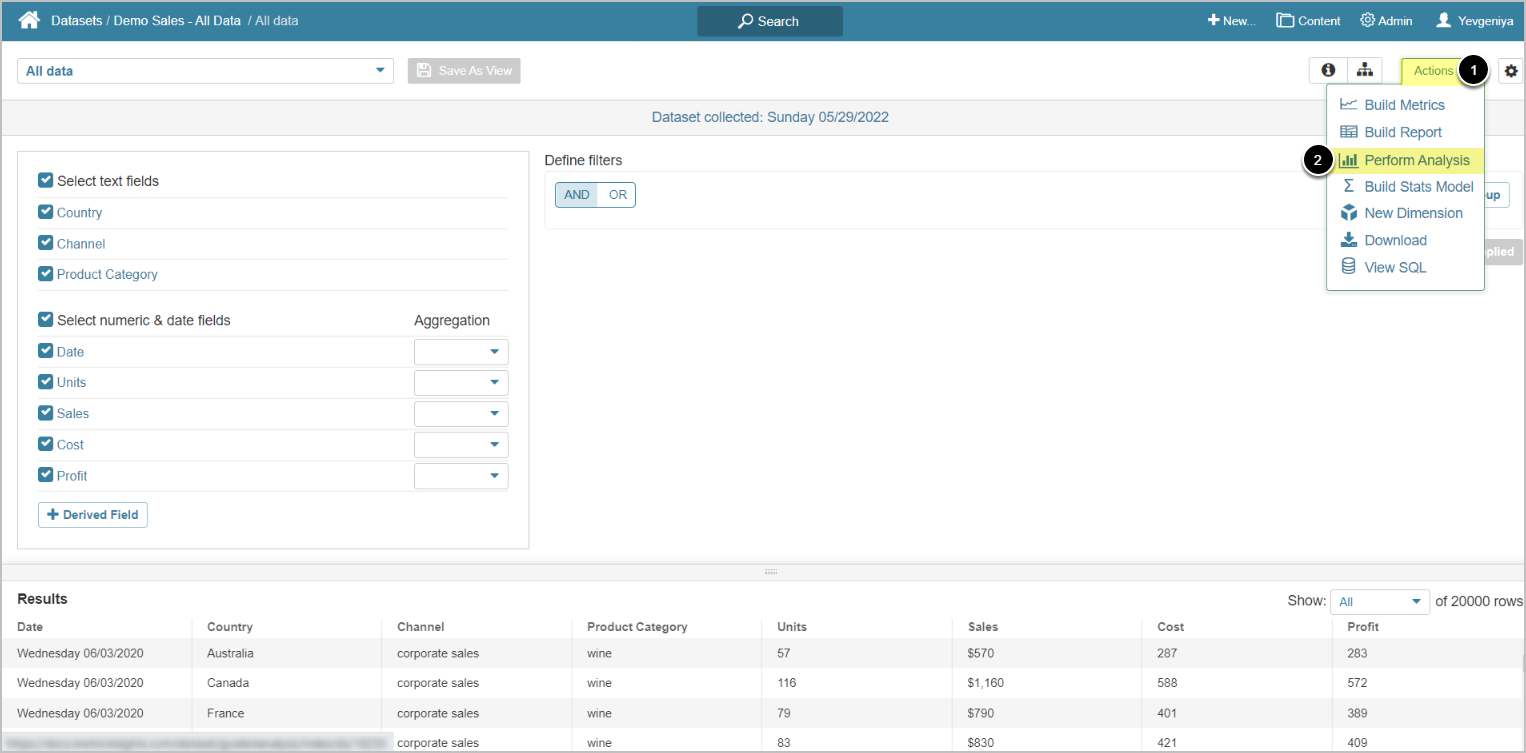
- Access the Actions menu
- Select Perform Analysis
2. Build Analysis
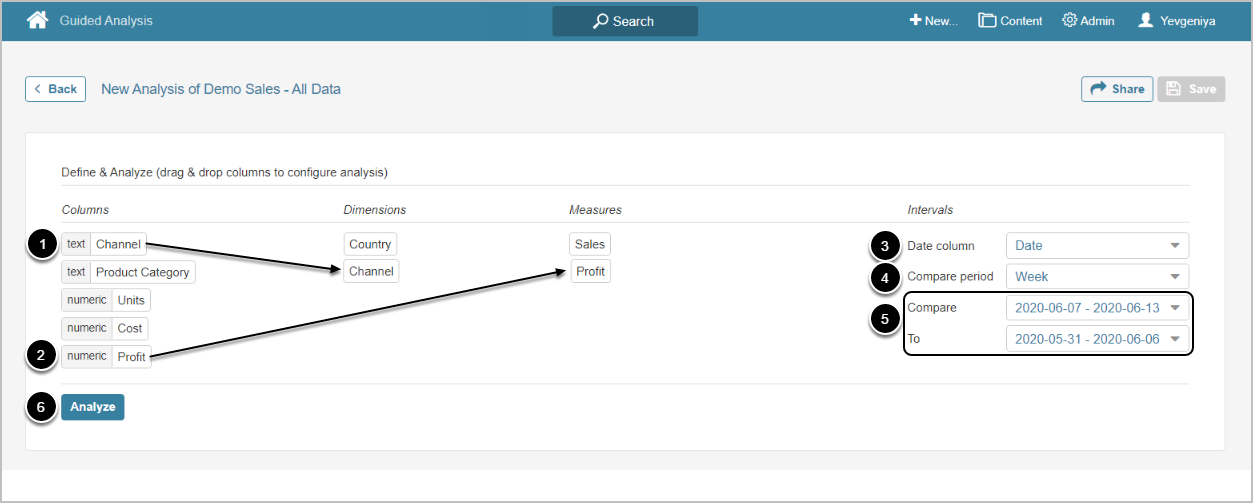
- Add Dimensions by dragging them to the corresponding column
- Add Measures by dragging them to the corresponding column
- Select Date column
- Specify Compare period
- Choose intervals/dates between which the analysis is to be conducted
- Usually a more recent interval/date is compared to an earlier one
- [Analyze]
3. Explore Details
The configuration from the section above will return the following result (on the left). The tabs are dedicated to Measures while the charts show the dynamics depending on the selected Dimension. The default view can be customized (on the right).
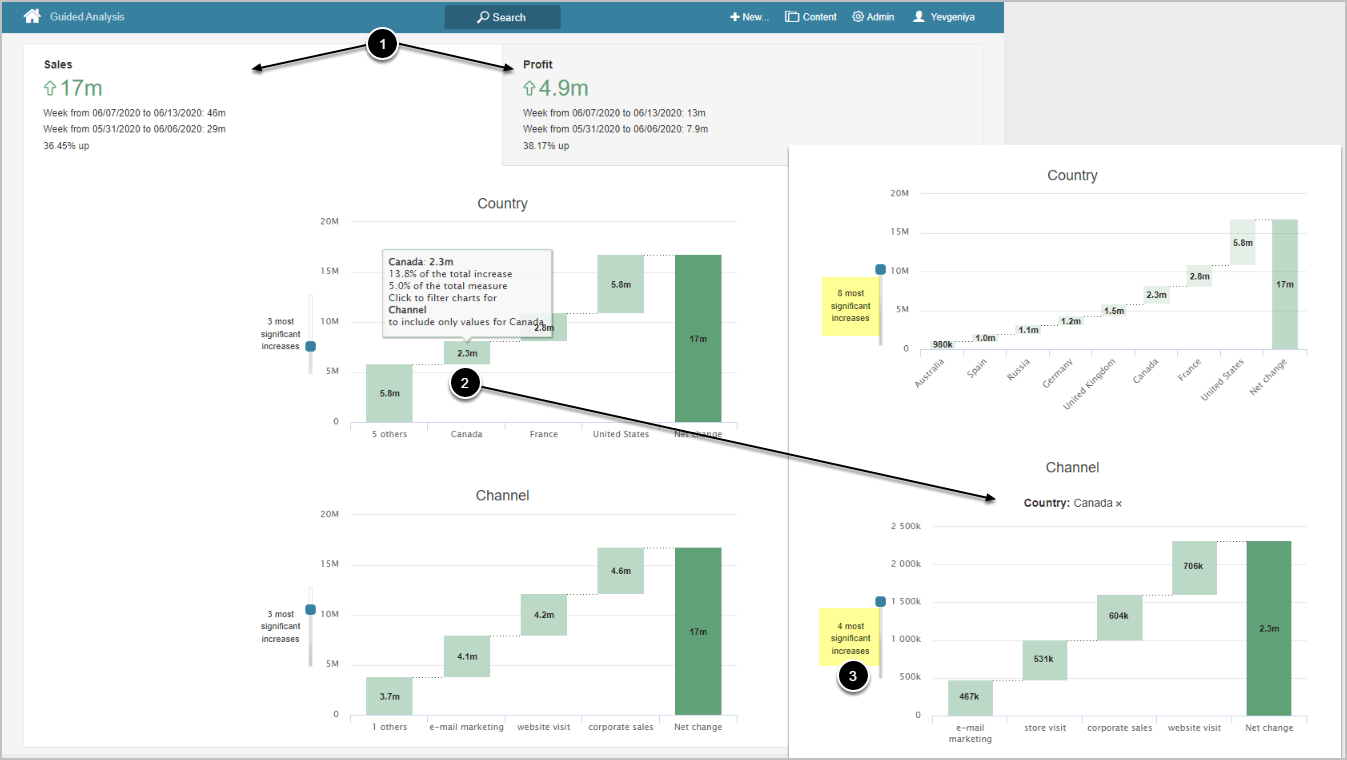
- Switch between tabs to view details based on a Measure
- Select a value to filter the chart to include only specified values
- Customize the display of data by showing more/fewer significant indicators
- If you choose to show less of them, the least significant indicators will be grouped into "Others"