With Datasets, it is easy to create Reports displaying changes in data. The Dataset Viewer allows the creation of separate Views that surface relevant data changes. These Views can be used to build Change Reports. A detailed step-by-step instruction is provided below.
PREREQUISITE:
Build a Dataset that keeps history (a Snapshot Dataset). For details, see:
1. Access Dataset Viewer
Access Content > Datasets
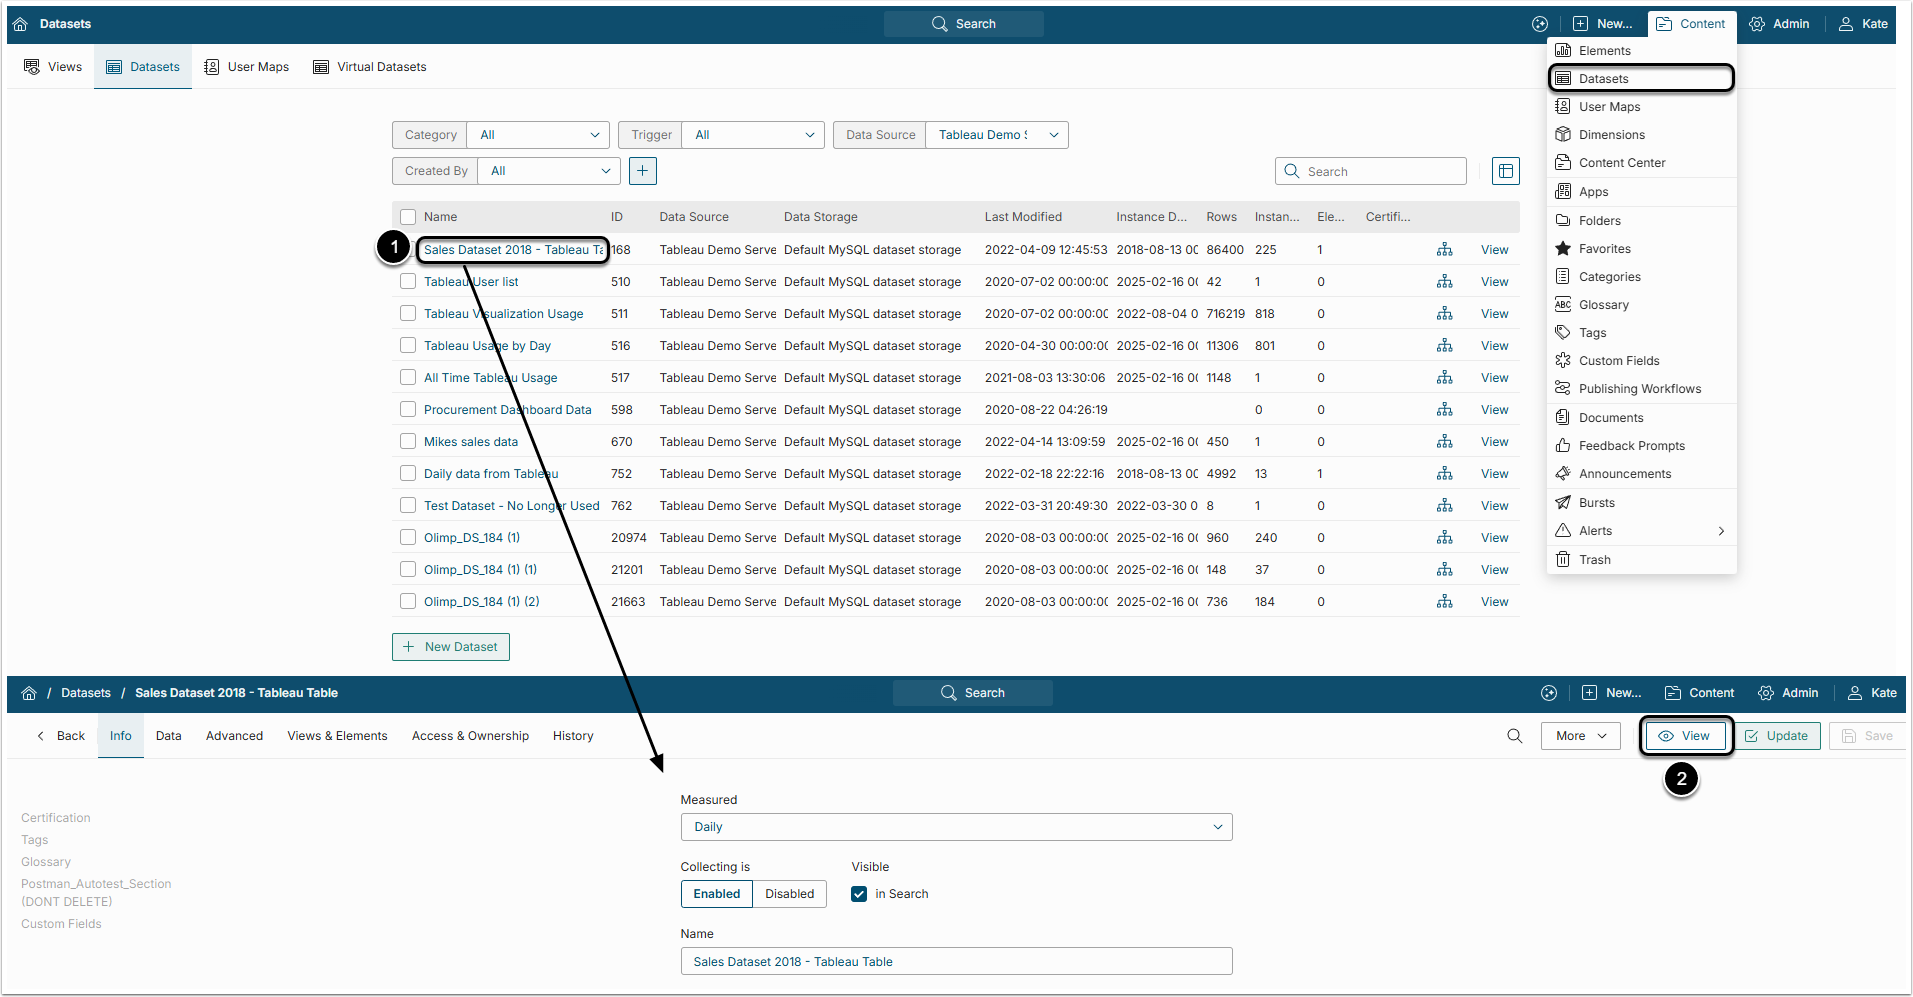
- Choose a Dataset for your Change Report and click it's Active Name link
- In the Dataset Editor click [View] to open Dataset Viewer
2. Display Data Changes in Dataset View
2.1. Compare Two Instances
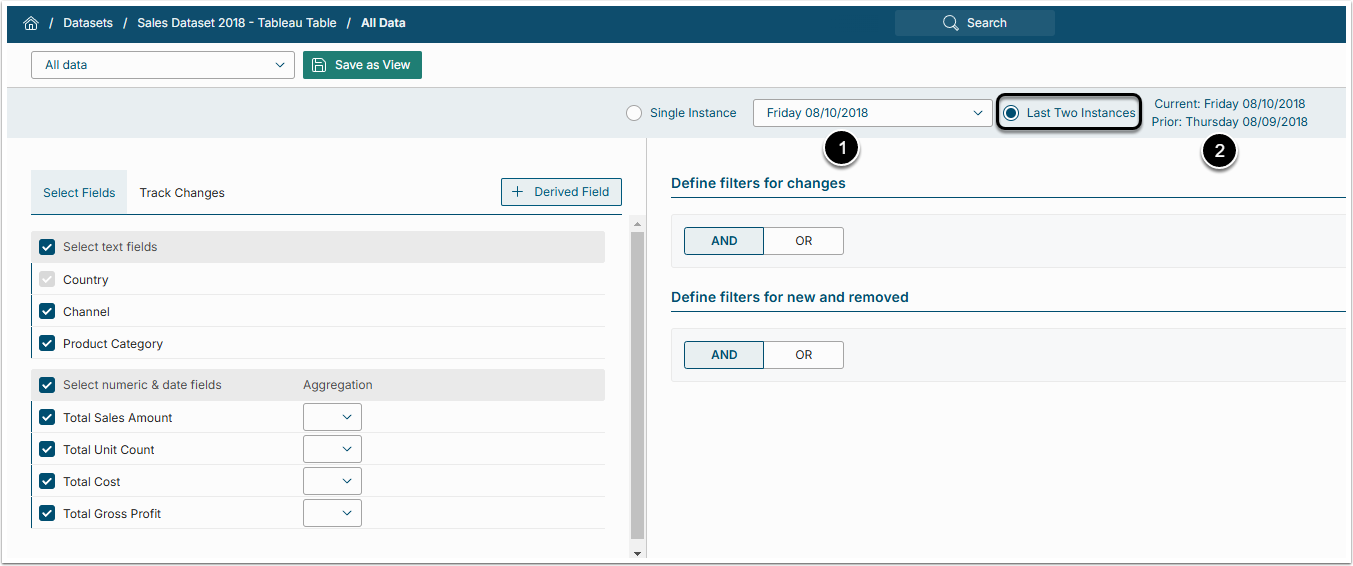
Select Last Two Instances.
- In the drop-down menu you can select any of the saved dates
- The two instances that will be compared are shown to the right
2.2. Define What to Track
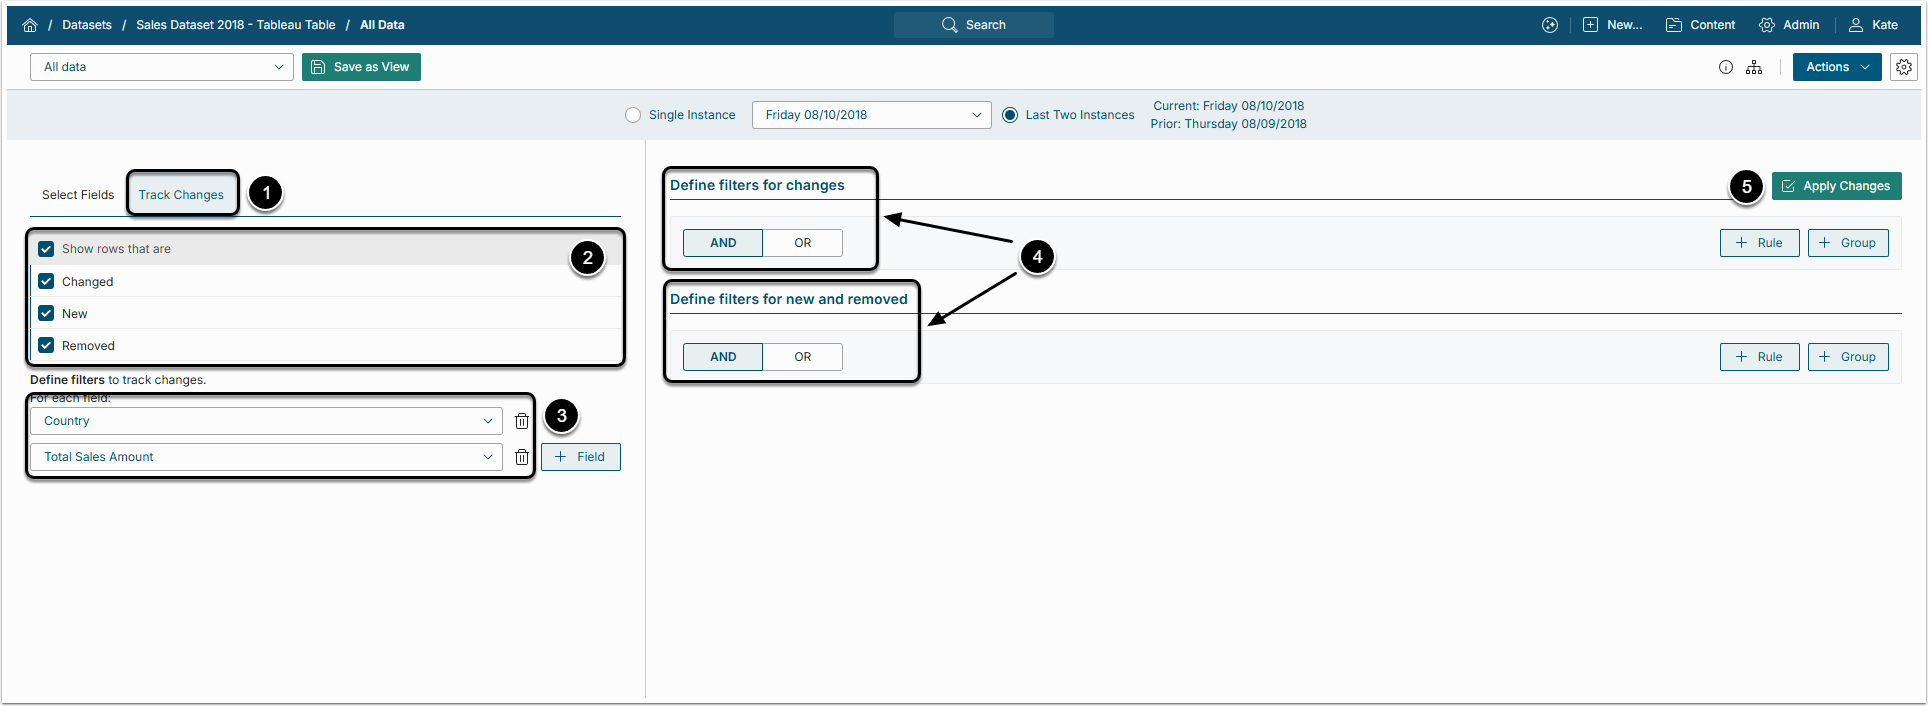
- Open the Track Changes tab.
-
Show rows that are: Here the User can select what kind of change to track:
- Changed: Track rows where the values have changed somehow
- New: Show rows that were added in the latest instance
- Removed: Show rows that were removed in the latest instance
- Fields: Add Fields for which the changes will be tracked by clicking [+ Field] and selecting the Field's name from the drop-down list
-
Define filters for changes / new and removed: Specify results even more by adding filtration Rules
- For more information about Rules, read this article
- [Apply Changes] to see the result in the bottom grid
3. Create Change Report from View
3.1. Save the View
The User can check how the grid will look like after applying all the filters in the Results table.
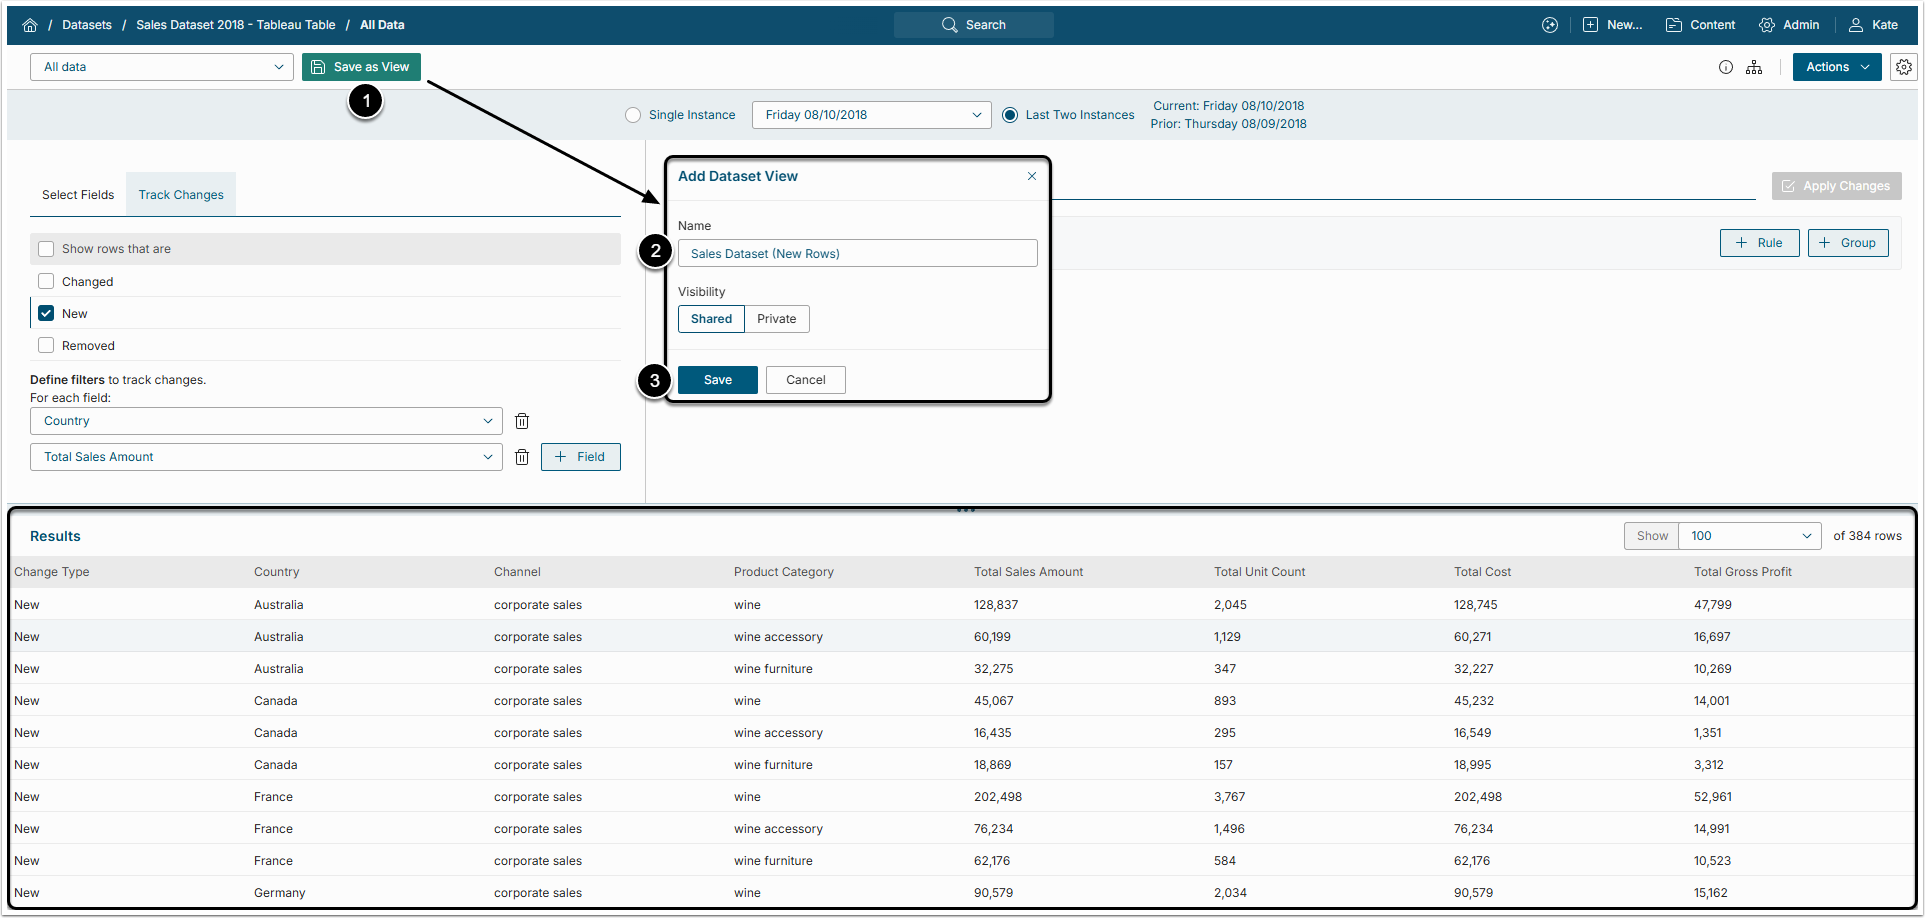
- [Save as View]
- Name: Give the new Dataset View a descriptive name
- [Save]
3.2. Build a Report
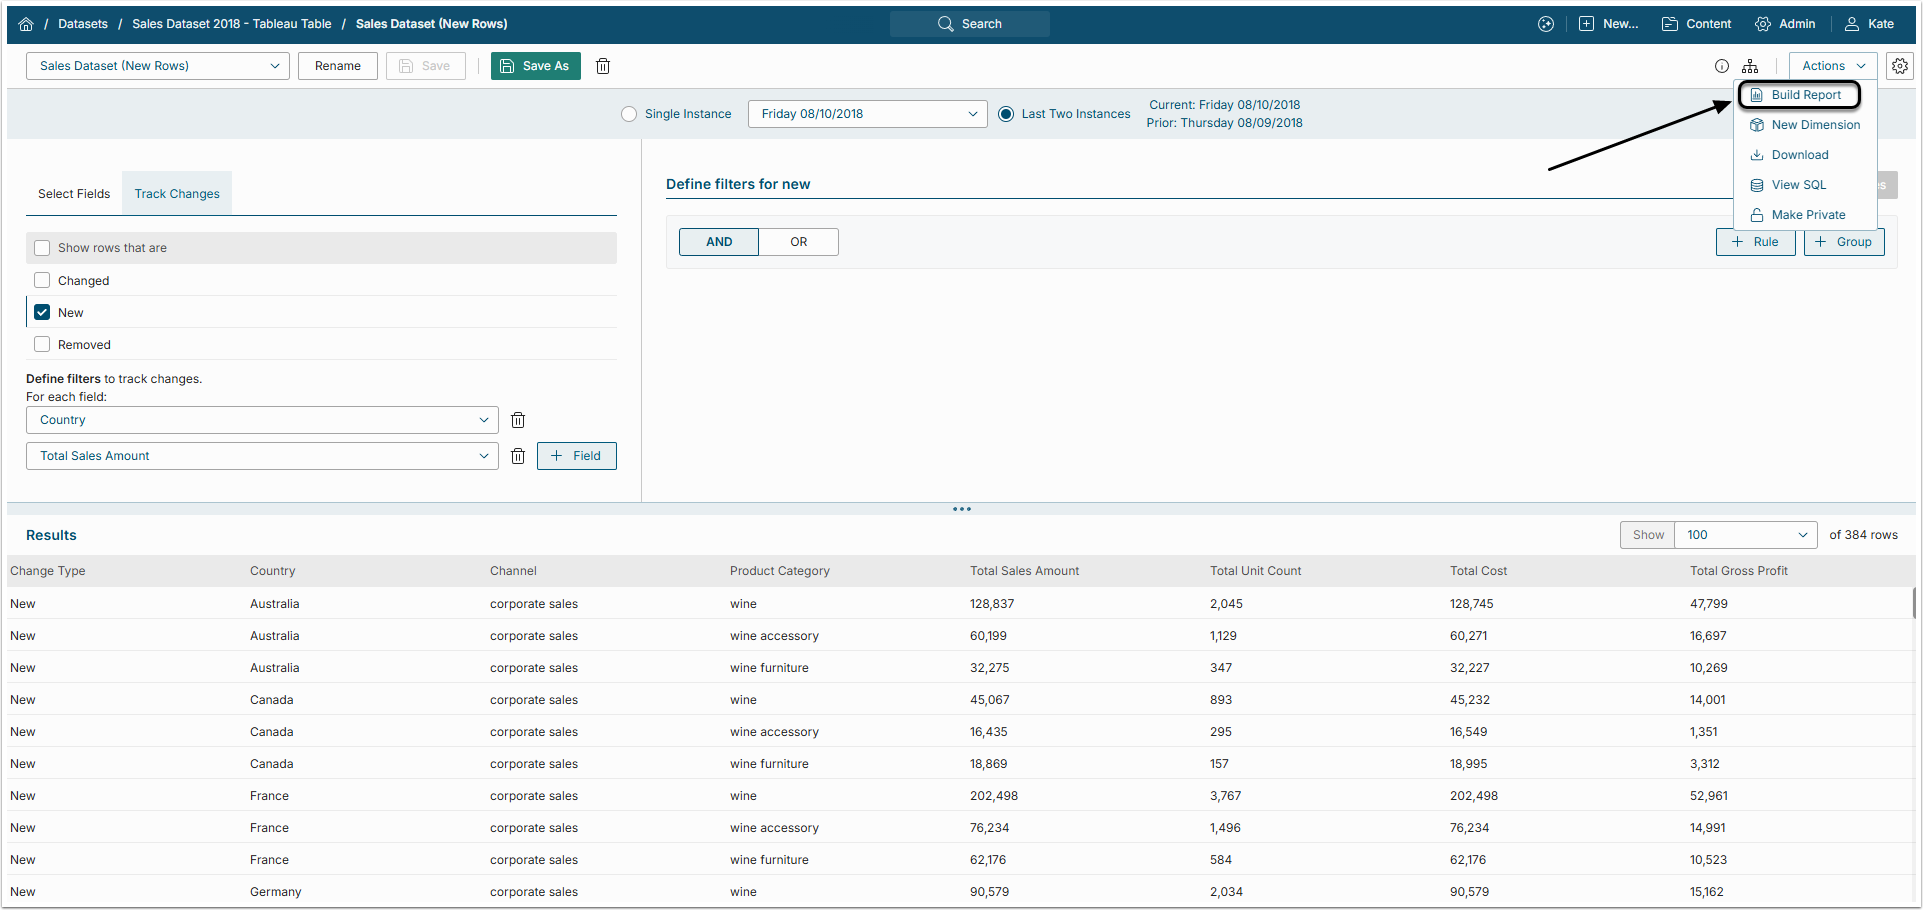
Open Actions > Build Report
The User will be redirected to the Report Editor.
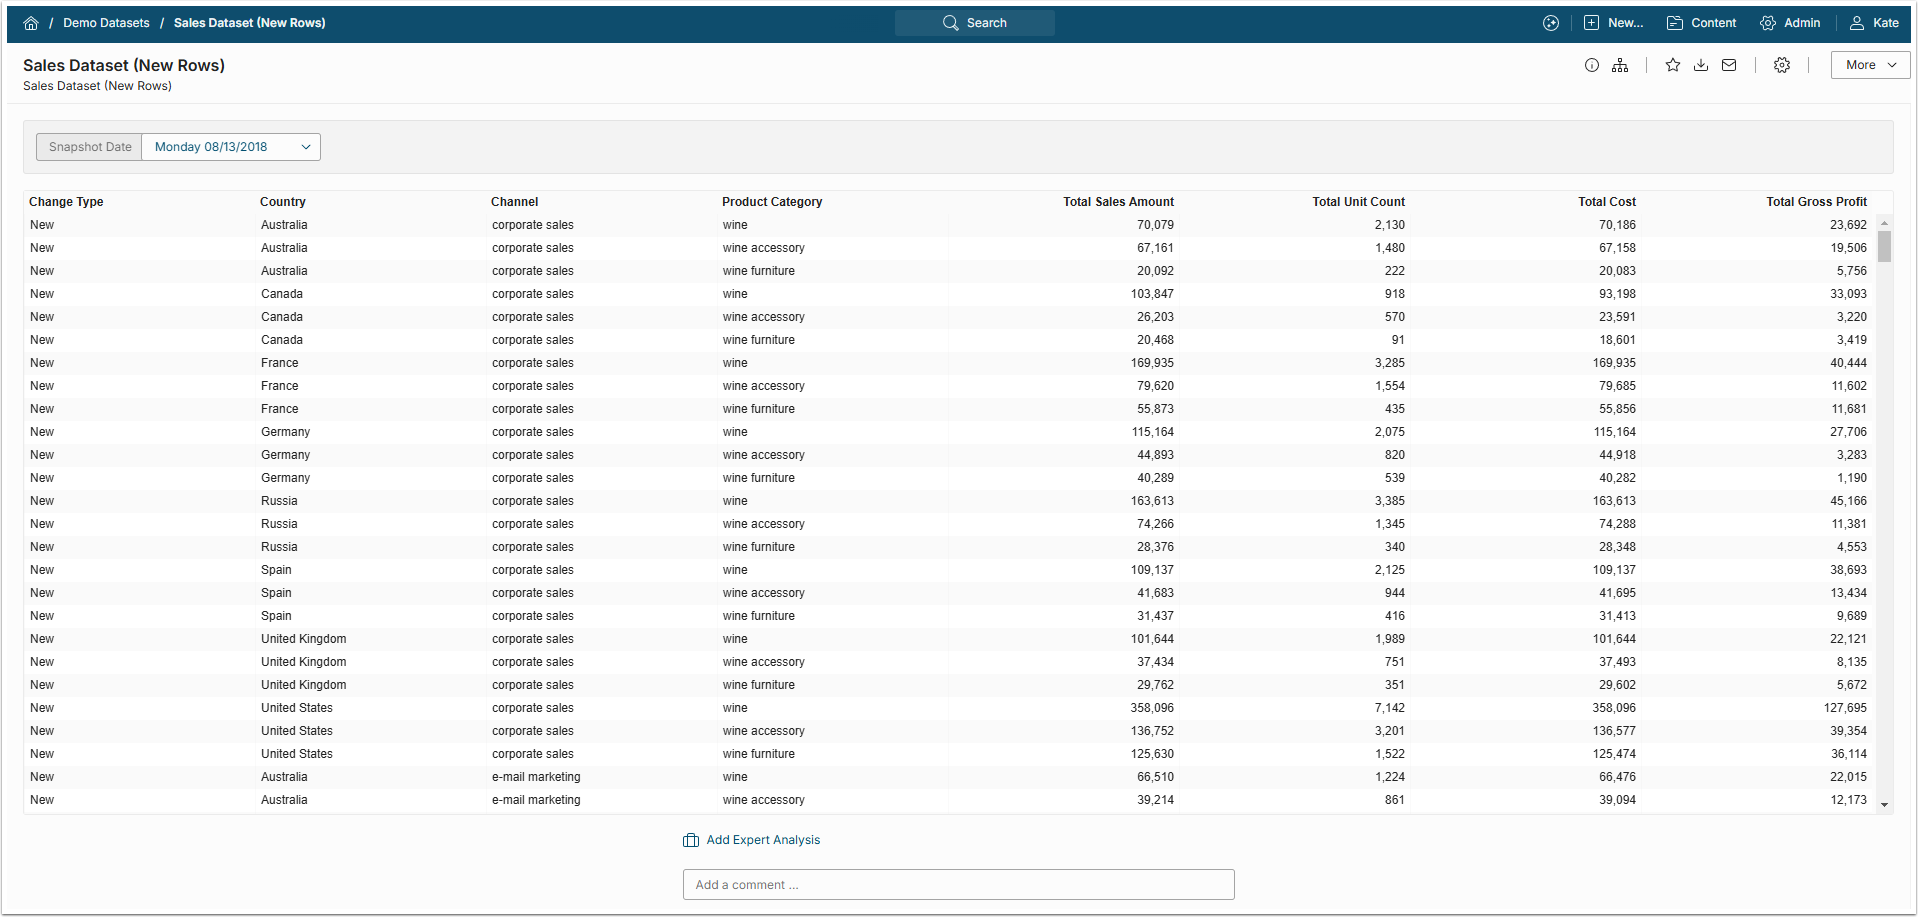
4. View Report
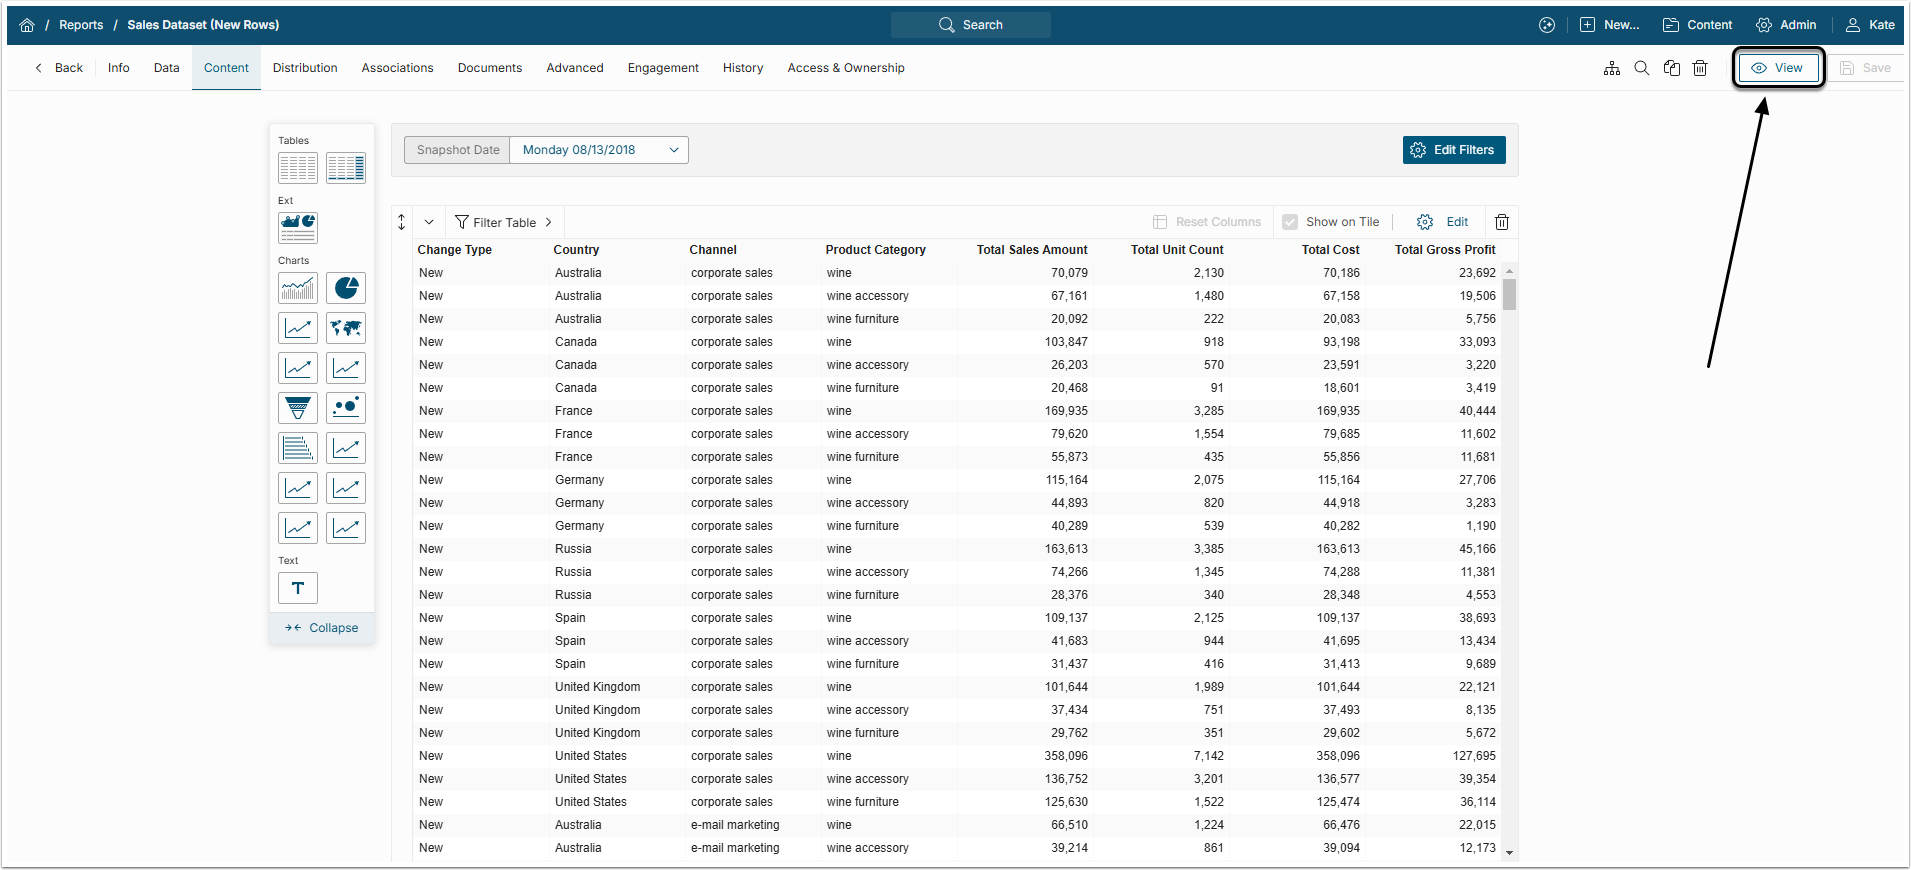
After checking the data and (optionally) customizing the Report additionally, click [View]. The Change Report will look like that: