Metric Insights allows selecting a group of elements and including them into a Slideshow that can be used within your organization to disseminate information to management and employees. This presentation plays through the included charts/reports just like a photo Slideshow.
Multiple presentations can be created for different purposes. Slideshows are very flexible and can also be constructed using elements assigned to a specific Category or Shared Favorites folder.
To view a complete Slideshow, access it through the URL provided by Metric Insights on the Slideshow Editor. If you have selected to show Alerts and/or Annotations, their icons are also visible.
NOTE:
(!) Disabled Elements are not displayed during a Slideshow.
(!) Slideshows can only display Elements that have all content pre-generated. Reports that are generated on request, or External Reports that get images on-demand, will not be shown. To check out whether the element is collected on-demand/request, follow:
- Regular Dimensioned Report: Report Editor > Data tab > Collect data: on Report request
- External Report: External Report Editor > Configuration tab > Advanced section > Collect Image: On Demand
- Reports sourced from a Dataset with a User Map applied:
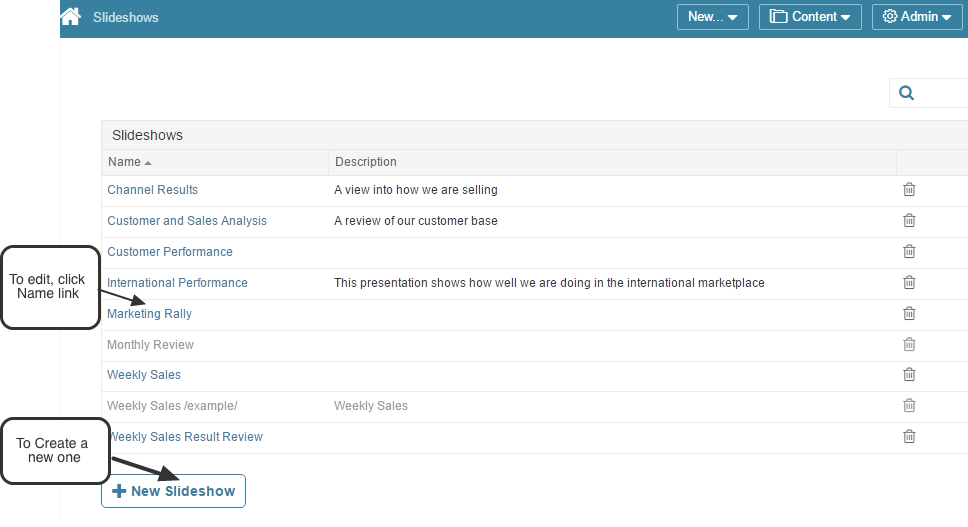
1. Access Content > Slideshows
2. Define the basics of the Slideshow display
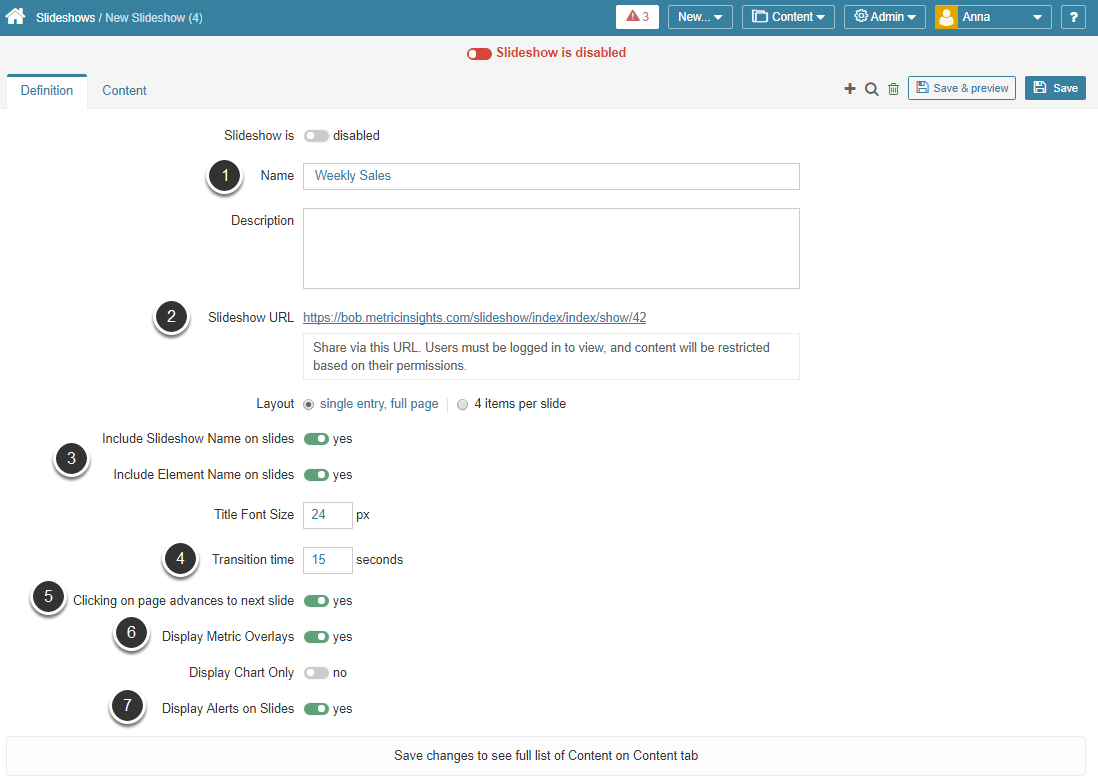
Use the Slide Show Editor to continue defining a new presentation parameters or modify existing Slideshow settings. Based upon the choices you make, the system dynamically changes some of the displayed fields.
- Name: Enter the title of your Slideshow
- Slideshow URL: You may change any default values except for the URL.
- Include Slideshow Name / Element Name on slides: Check this box if you want the slide show’s name to be displayed as a title across the top of the slide above each included Element’s name (This title would be visible throughout the presentation and does not fade out as the slides change)
- Transition Time: Enter the number of seconds each slide is displayed before transitioning to the next one
- Clicking on page advances to next slide: Allows User to click on screen image to advance slides rather than wait for Transistion time to expire
- Display Metric Overlays: 'Yes' for this option will display any Overlays that User has chosen in the onlline Viewer
- Display Alerts on Slides: If Display Chart Only is set to 'no', this option appears to allow Alerts to display as they would in on-online Viewer
Save your settings and click on Contents tab
3. Add Elements at the Content tab
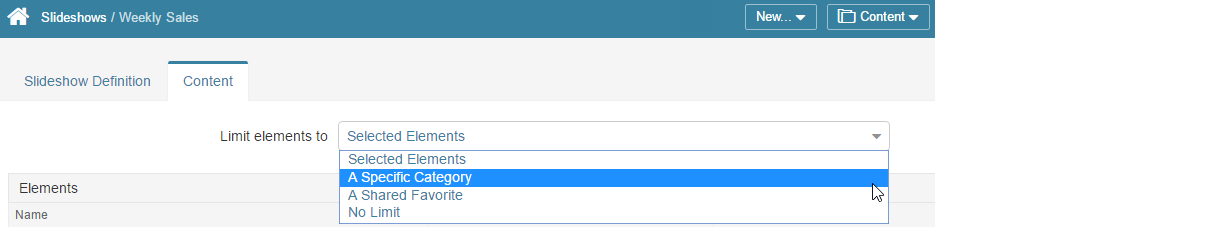
Upon initial display of the Slideshow Editor, the Slideshow Contents tab grid contains no elements, but you can choose the scope of elements to be included into the presentation:
- Selected elements: you may choose various elements from different Categories one-by-one.
- A Specific Category: restrict the Slideshow to a selected Category's elements.
- A Shared Favorite: you can include elements from the Favorite Folders either shared with you or your own Favorite Folders that you have shared with others. If you are also leveraging the group security for this slideshow, choose a Group from the Restrict slideshow visibility to group field before selecting a Shared Favorite folder. For example, you might want a slide show of 'Key Performance Indicator's (KPI's)' for everyone in the office to view, select a Shared Favorite folder of "KPI Elements" and set Restrict Elements to "Default Group" (assuming all staff has been included in this Group). Now, as you add elements to the selected Shared Favorite folder to which the Default Group has access, they will automatically be included in this slide show.
- No Limit: all elements created in the system will be shuffled in this presentation.
![[Example 1] Refine Contents by Category](https://web-image-kb.s3.us-east-1.amazonaws.com/H-D-images/117421/89edb6ea.png)
- Limit Elements to: Choose an option other than "No Limit"; in the example above, the "Specific Category" is selected to restrict the Slideshow to a selected Category's elements
- For this example, the "Financial" Category is selected
- Optionally, use the Restrict slideshow visibility to group option: if you are also leveraging the user/group security for this slide show, use the drop-down list to choose a Group (before selecting the Category in order to limit the presentation to those Elements that the chosen Group is able to access.
- All Chart in Slideshow: This table displays all elements that are going to be included into this presentation.
Save your selection.
NOTE: As new Elements are added to the Category that you select, they will be automatically included in the Slide Show.
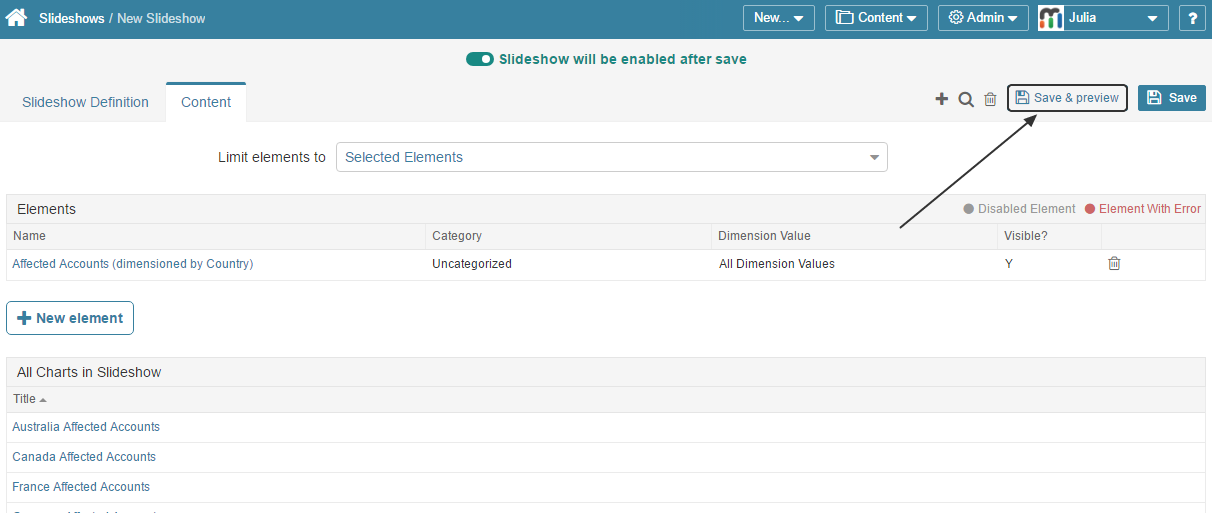
![[Example 2] Select specific Elements for the Presentation](https://web-image-kb.s3.us-east-1.amazonaws.com/H-D-images/117421/493bd5f4.png)
To add specific elements to a slideshow:
- Limit elements to: choose "Selected Elements". This option allows combining various elements regardless of their Category in one presentation.
- Click [+ New Element]. The pop-up will open.
- Optionally. You can limit the scope of element display by choosing a specific Category or choose "All Categories" to be displayed.
- Element Name: choose the required element from the drop-down list.
- If the Metric is dimensioned. Since when the Metric is dimensioned, each Dimension Value is represented as a separate Chart. You can choose to include all or specific Dimension Values to the presentation. Once you are ready with your selection, Save the element. The element itself is going to be displayed in the Elements grid and the list of all charts to be included in the presentation is to be displayed at the All Charts in Slideshow table.
4. Save and Preview your Slideshow