There are two primary options for administering the Metric Insights Kubernetes cluster:
- Kubernetes Dashboard (a web-based user interface)
- Kubectl (command-line tool):
- Can be installed in both Linux and Windows environments
- Must be able to reach the Kubernetes cluster
This article covers the following:
1. Kubernetes Dashboard
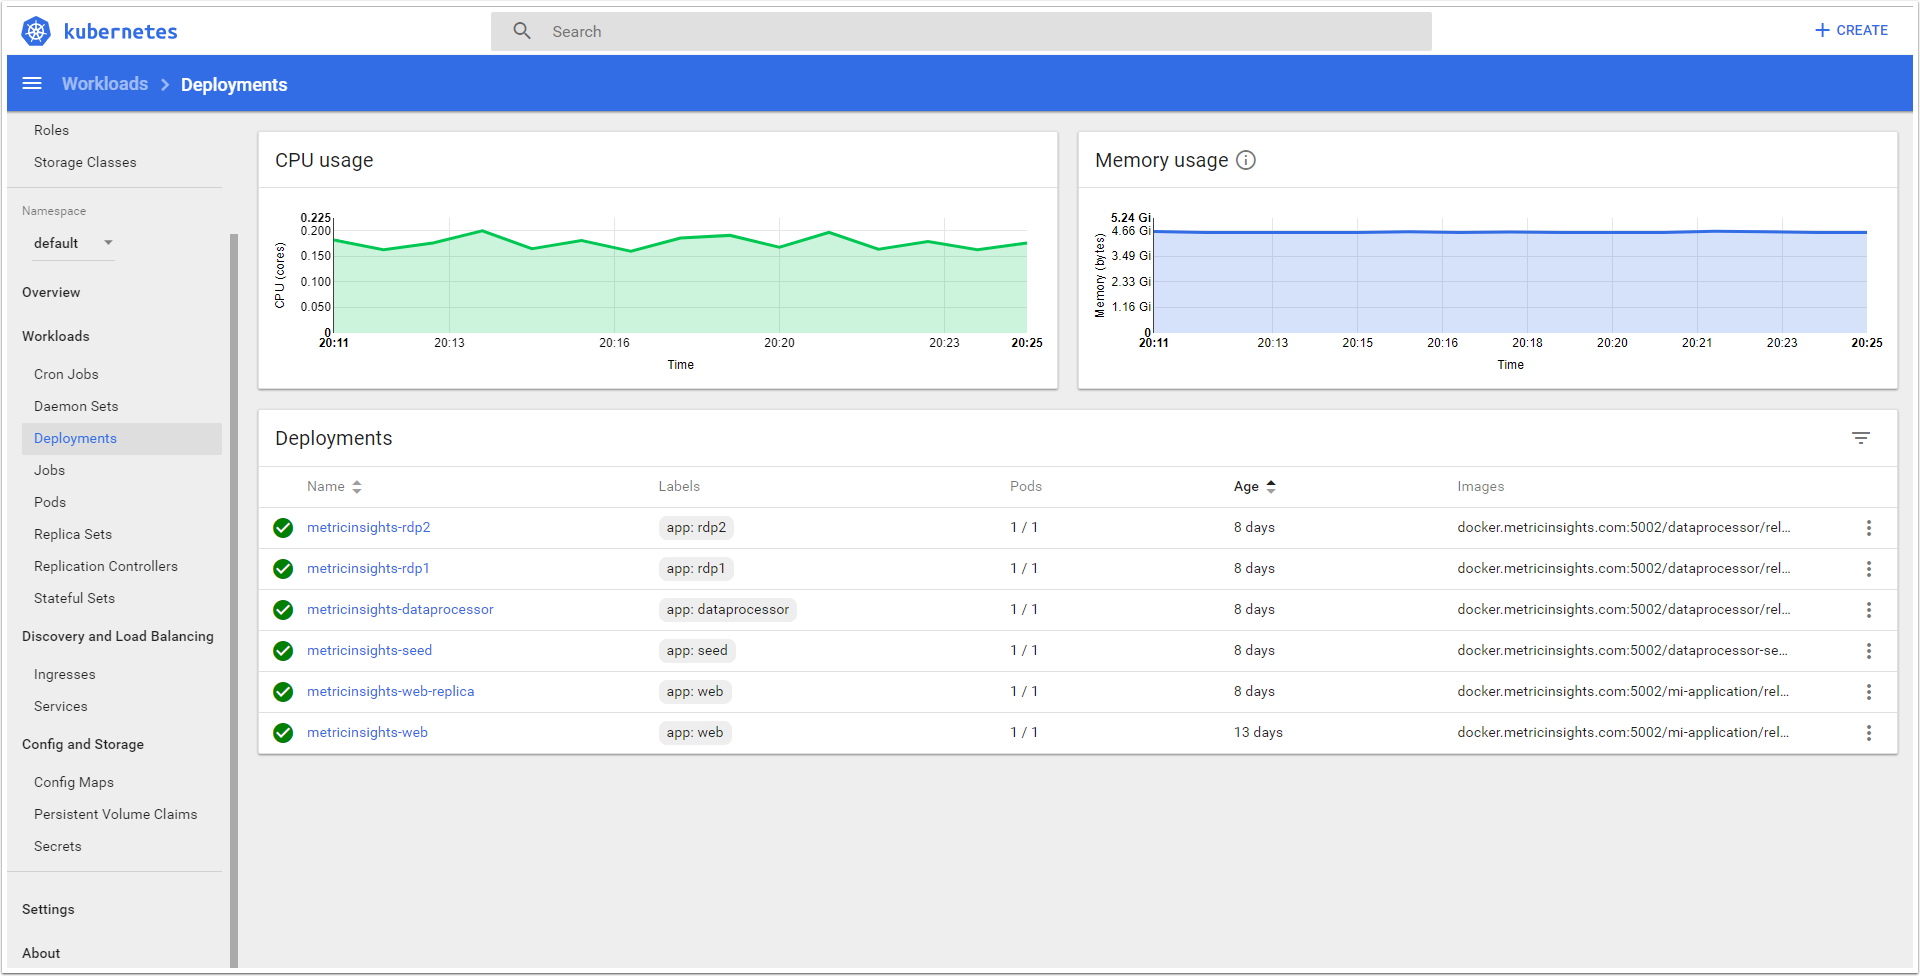
In the image above, you can see the list of Metric Insights services under the Deployments menu option. One service corresponds to one pod in the namespace. Let's take a closer look at the pods below.
A pod is a unit of deployment, and in the case of Metric Insights, it equals 1 application service (packaged inside a container). Accessing the Pods menu allows you to get information about each pod as well as enter the container to view the file system, run commands, and get logging.
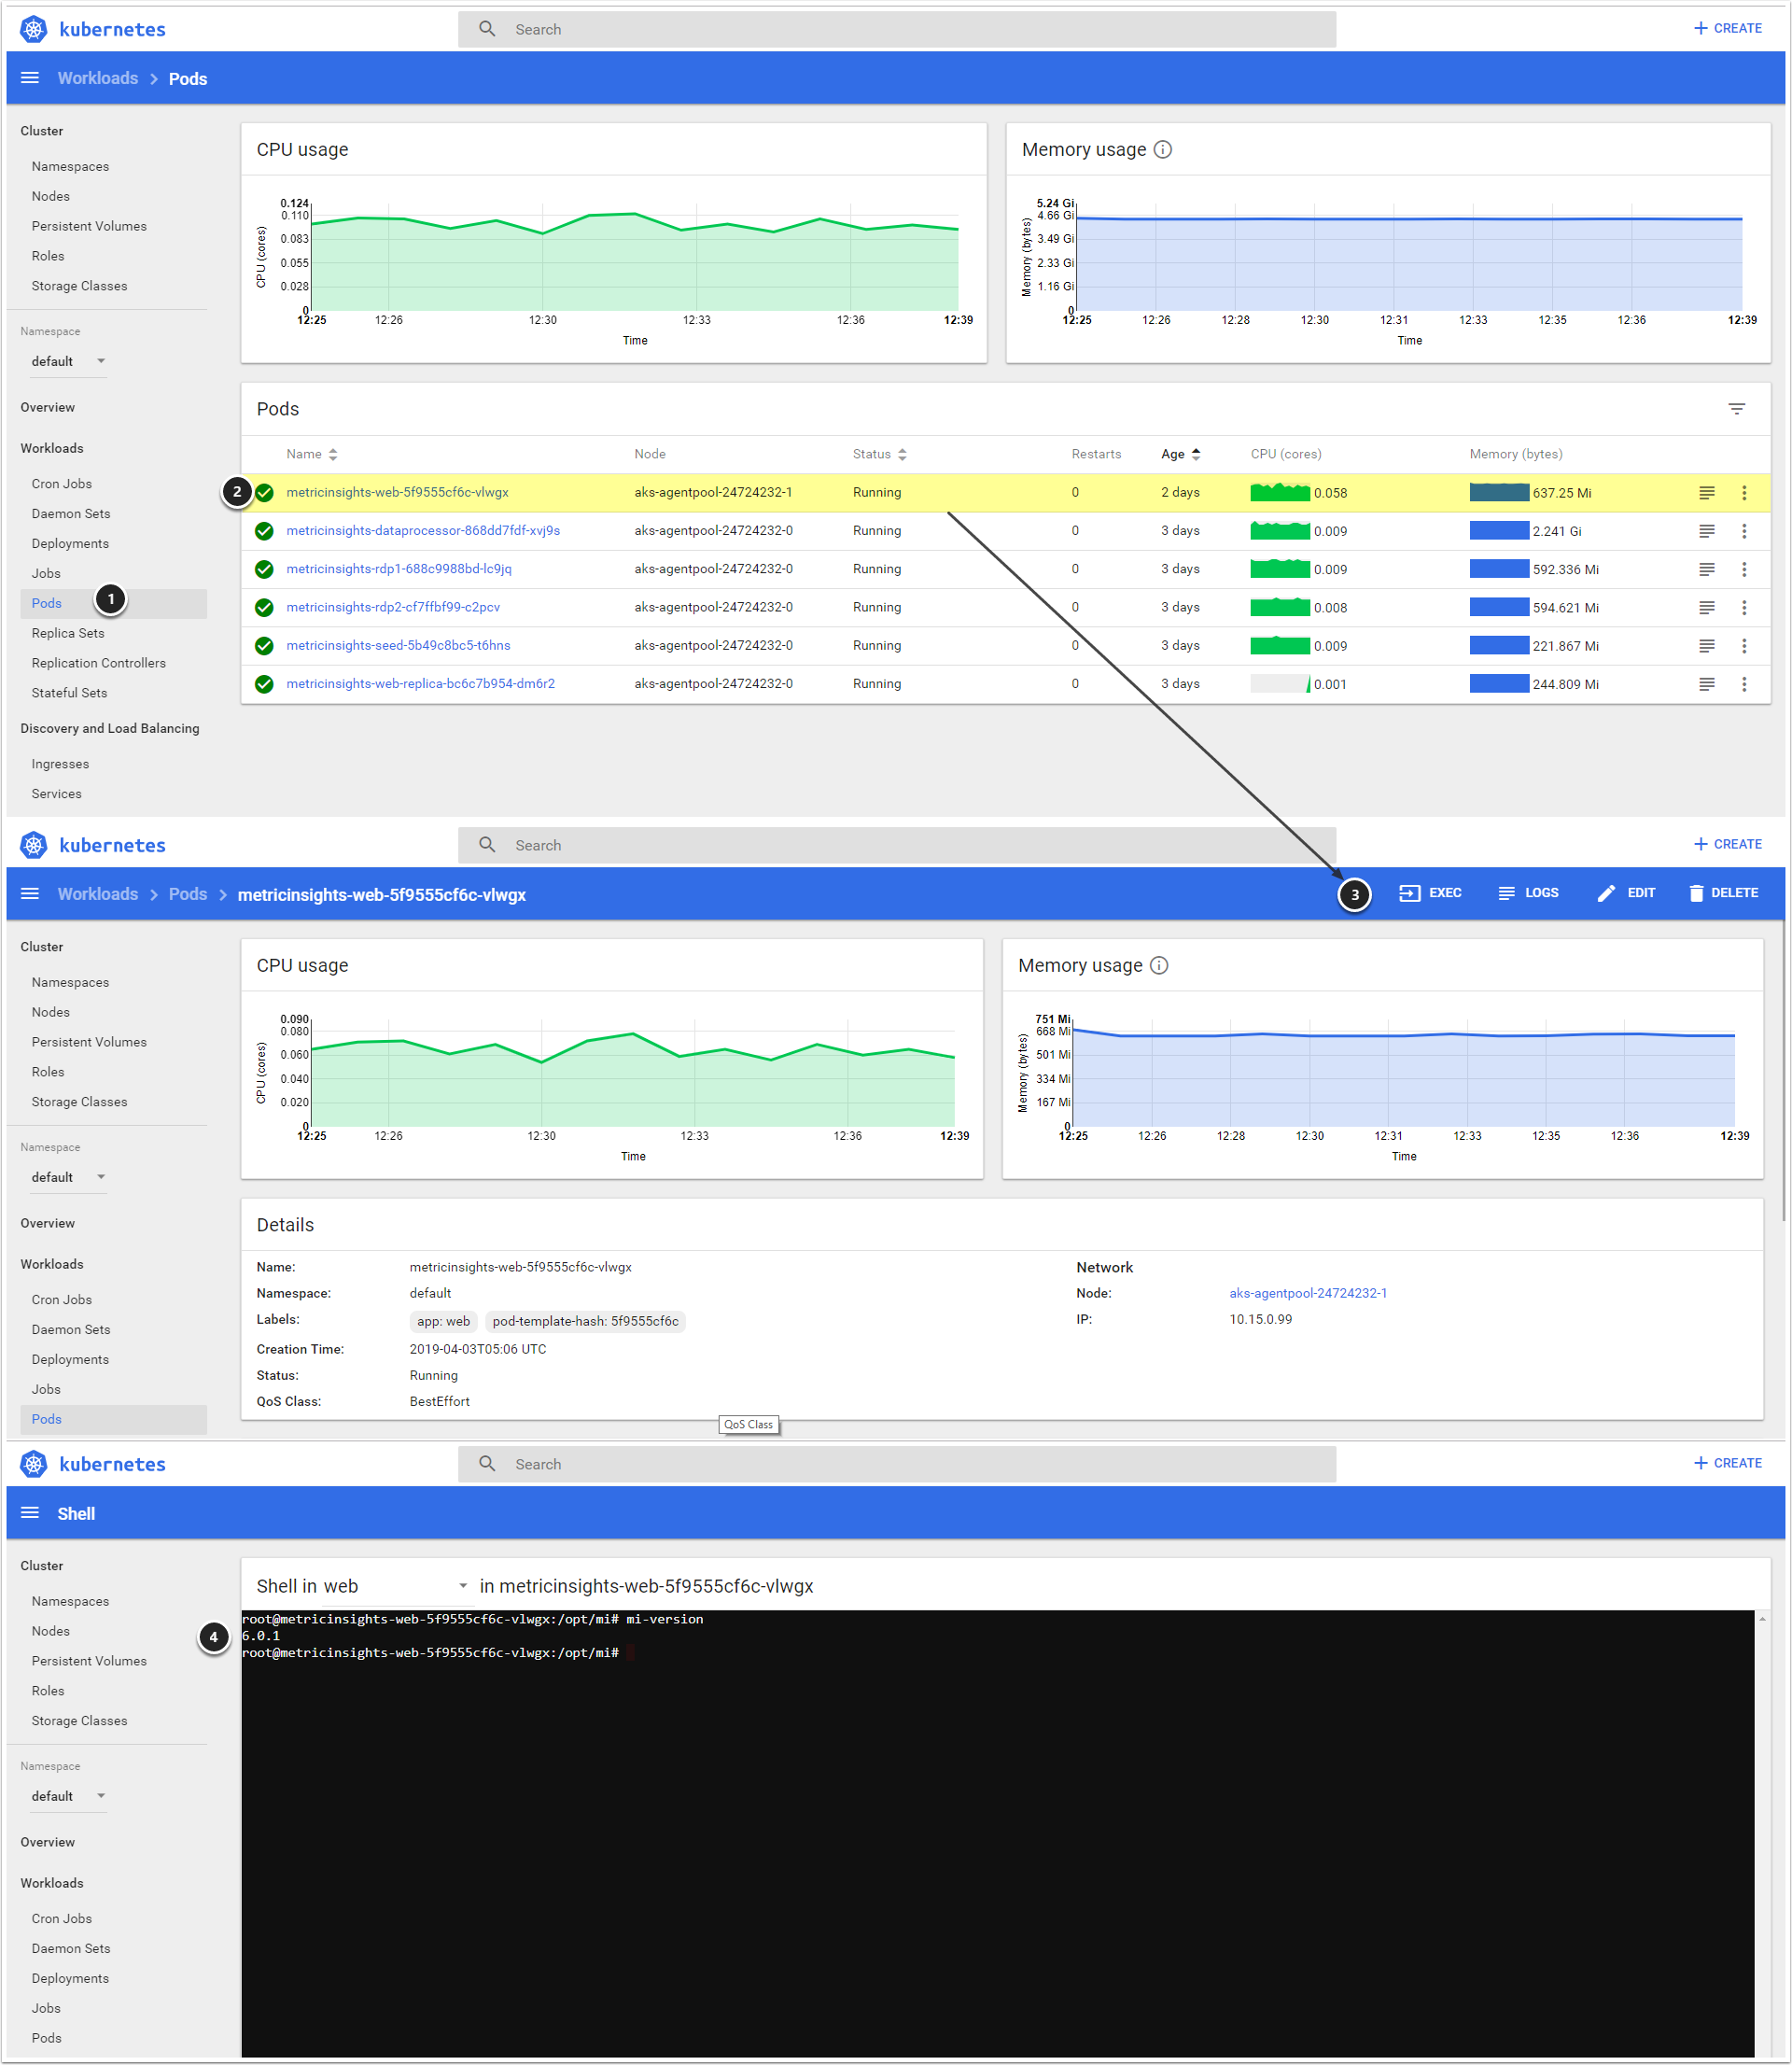
- Go to Navigation Menu > Pods
- Select Pod to open Pod's Detail Page
- Click [EXEC] to open the shell console
- Use the shell console to view the file system and run commands
By default, each of the Metric Insights Services prints its own logs to stdout.
To view the logs:
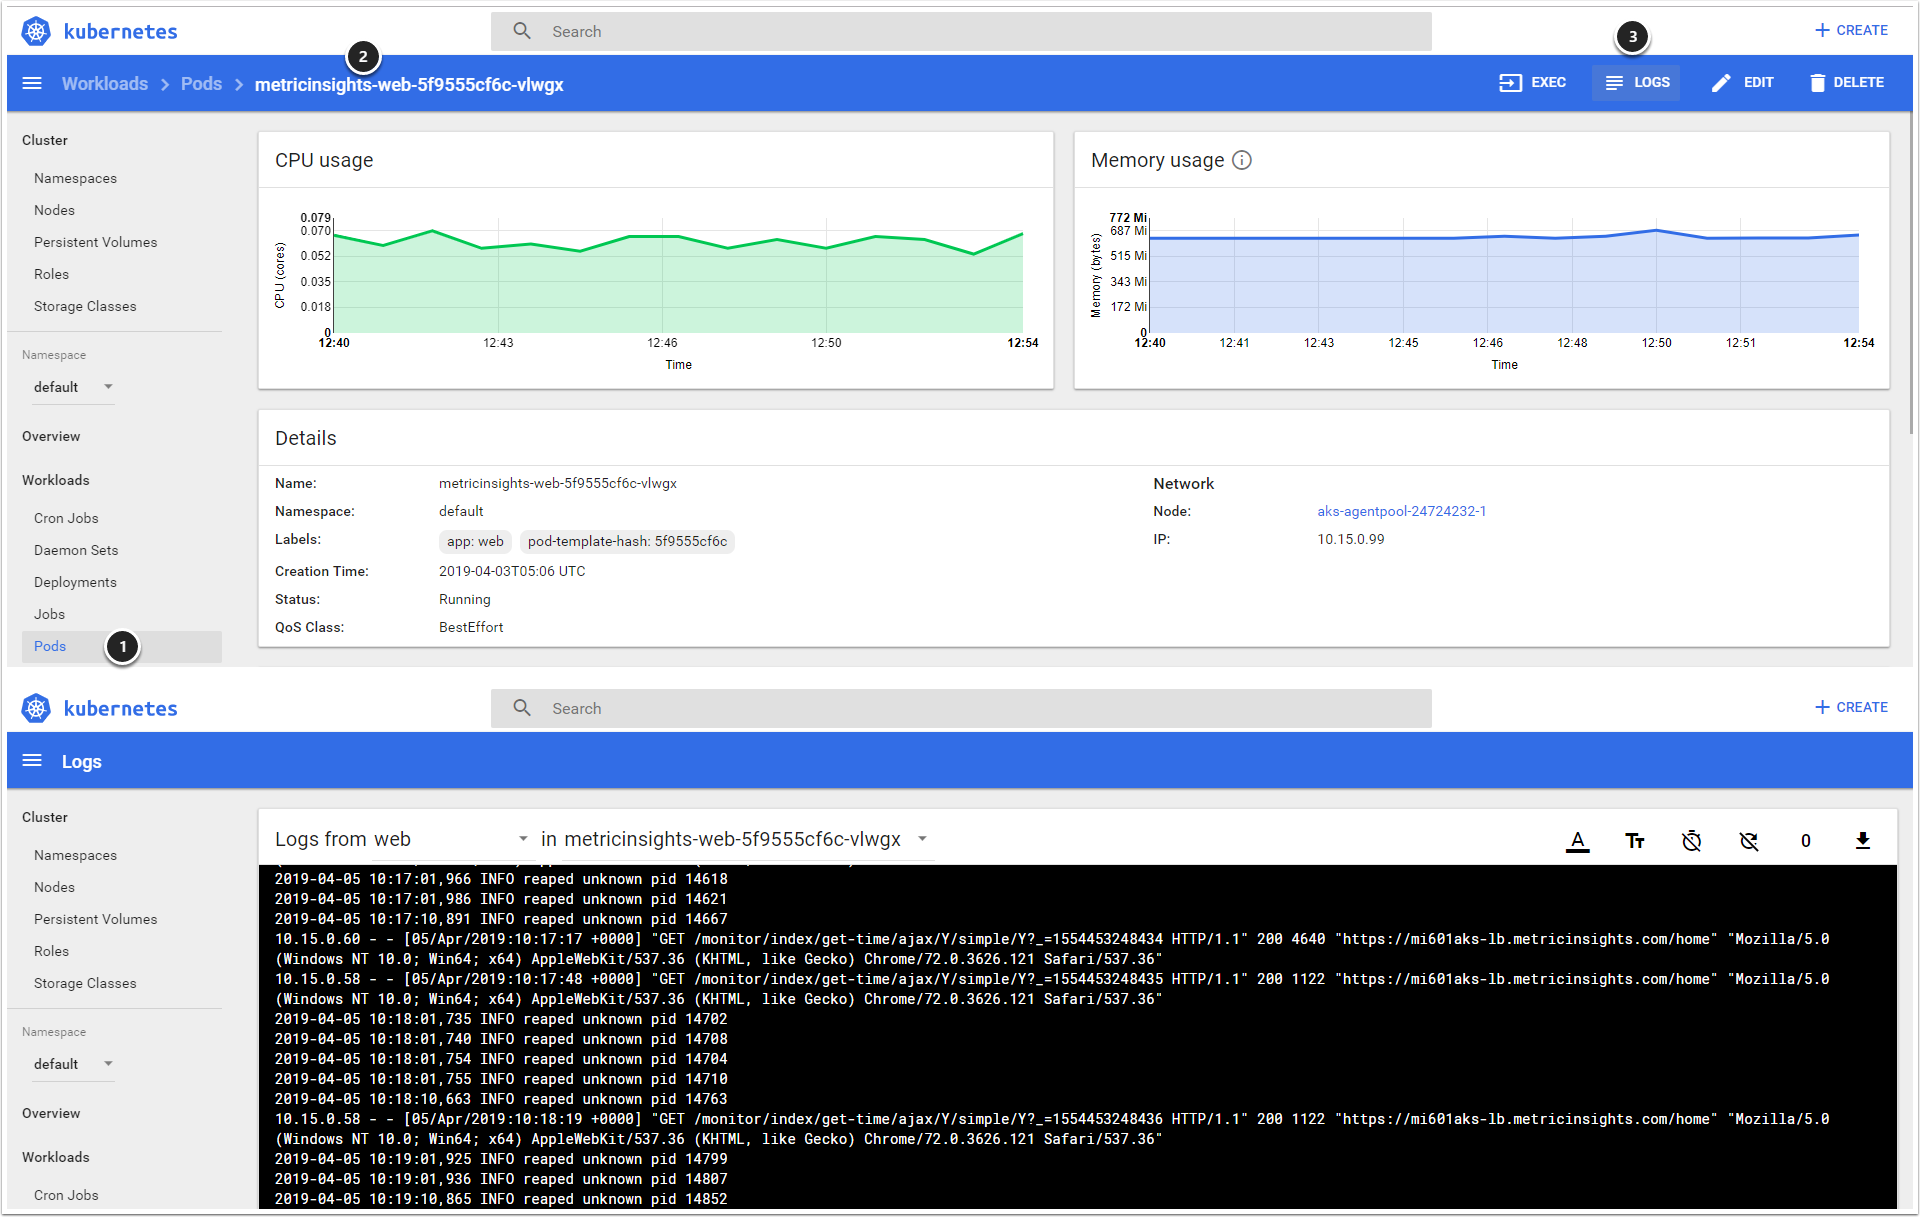
- Go to the Navigation Menu > Pods
- Select Pod to open Pod's Detail Page
- Click [LOGS]
- Logs generally show the boot process of the container and the running application service
- e.g., for the Web service: apache logs, https requests, and other provisioning info
- e.g., for the Data Processor service: logs from the Java application
You can also enter the container to view the application logs directly. The logs can also be downloaded from the Metric Insights UI.
Instead of using the default logging service, you can use the Splunk logging driver to send container logs to Splunk Enterprise and Cloud. The logs are sent to Splunk HTTP Event Collector.
- See Logging via Splunk (6.x) on how to configure it.
2. Kubectl
To use kubectl, you must install the tool on a machine that can access the Kubernetes cluster. The tool can be installed on Linux, Windows, and MacOS. See Install Kubectl for steps on how to install and configure the tool.
As for using the tool itself, here's an example of a kubectl command to get a list of pods for a namespace named MI:
# kubectl --namespace mi get podsFor more useful kubectl commands to manage Metric Insights, see Kubectl Commands Cheat Sheet.