OpenShift is Red Hat's version of Kubernetes. It is a viable option for container orchestration, especially if your organization already has a Red Hat subscription.
PREREQUISITES:
- Ensure that the system requirements for a Metric Insights server are met
- Installation package
- Docker images for Metric Insights services
- Access to the OpenShift Container Platform
- OpenShift Container Platform command-line interface (CLI)
- Remote database server to host the application database (e.g., MySQL 8)
- Persistent shared storage (e.g., NFS)
The following topics are covered in this article:
- Understanding the Metric Insights Application Architecture in OpenShift
- Create a Project for the Metric Insights Application in the OpenShift Container Platform
- Configure the Storage Class for Persistent Volumes
- Obtain Docker Registry Credentials
- Generate the Deployment Files for the Metric Insights
- Create & Upload Secrets for Each MI Service
- Deploy the Metric Insights Application
- Check if the Application Has Been Deployed
- Create Routes for the Web Service and the Monitoring Service
- Basic Console Commands
For non-orchestrated environments, see the help article on using Simple Installer.
NOTE: For OpenShift deployments that use the CRI-O container runtime, set readOnlyRootFilesystem to false in every securityContext block in the manifest before you apply it. For details, see the note in Deploy the Metric Insights Application.
1. Understanding the Metric Insights Application Architecture in OpenShift
See the application architecture diagram for your Metric Insights version:
7.1.1-7.2.1
Below is an architectural diagram of Metric Insights deployed in OpenShift. A namespace is a virtual cluster that consists of several Nodes (servers). The Nodes host Pods that are essentially Containers. Metric Insights consists of services that run inside their own Container, rooted to a shared file system for persistence.
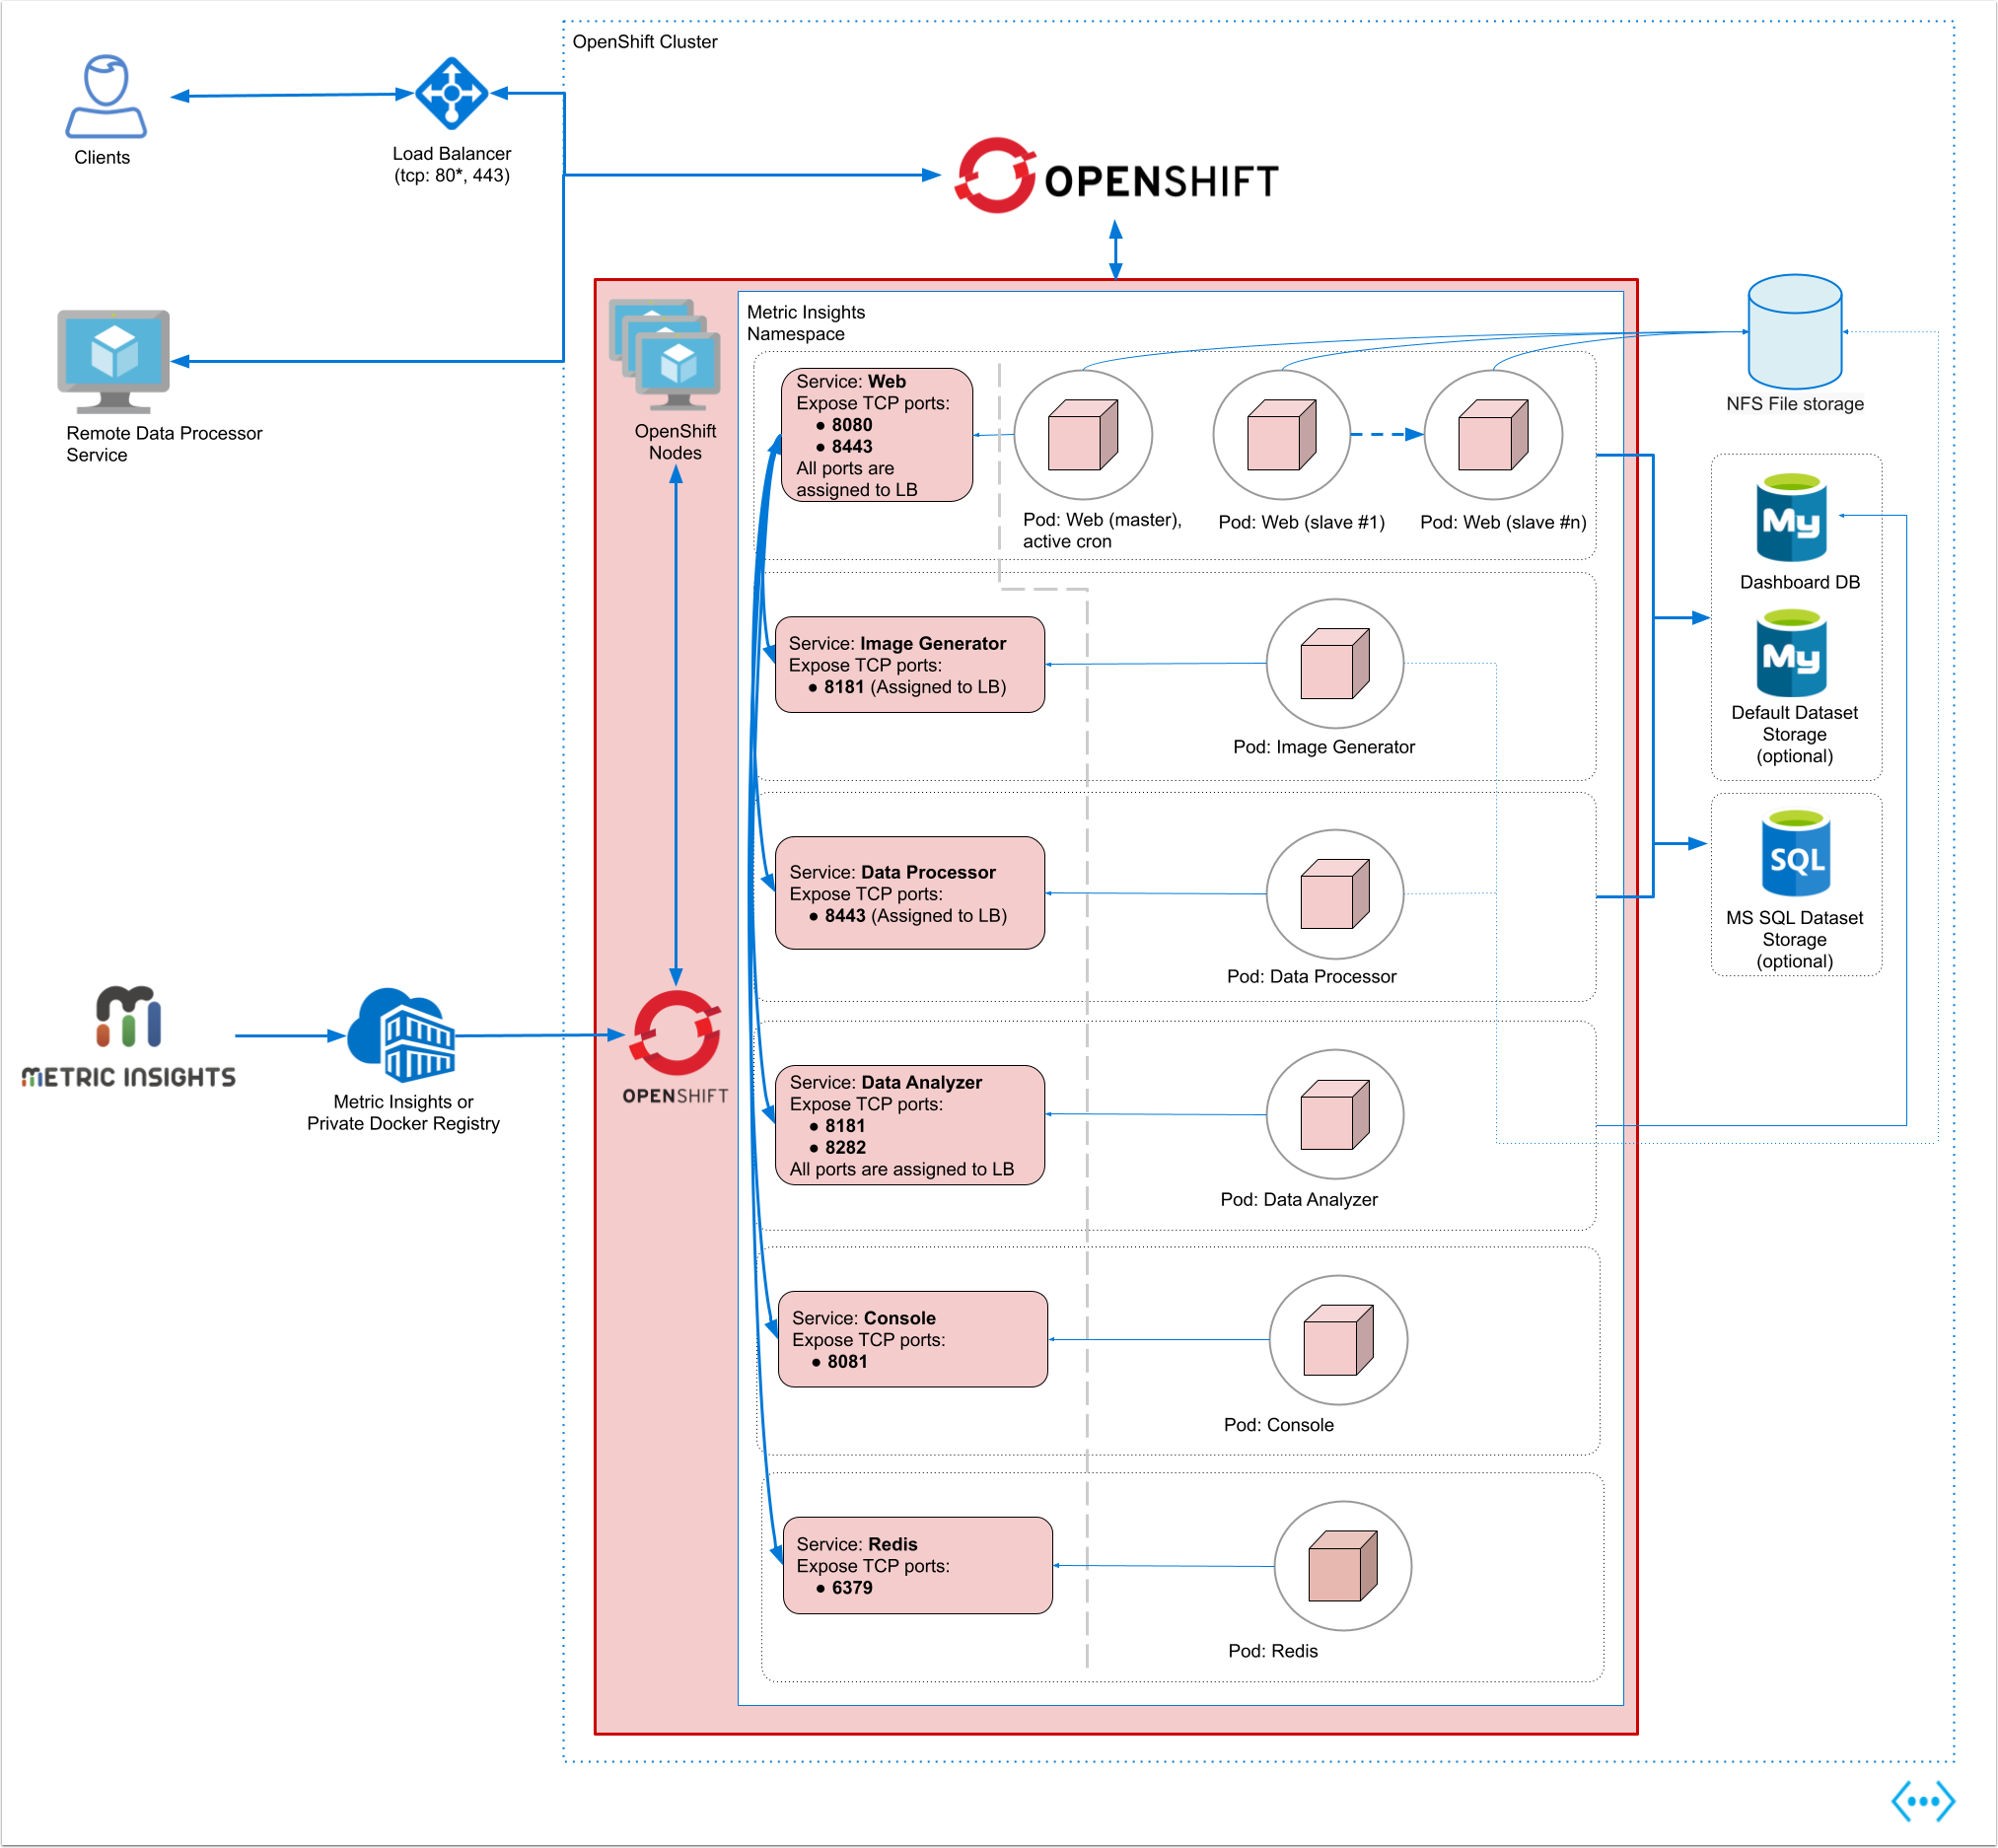
NOTE: Opening port 80 is optional. See the list of ports for details.
The deployment scheme consists of the following services deployed in individual Pods (1 service per Pod):
Required services:
- Web Master, Web Slave replicas: The application's user interface.
- Data Analyzer: Provides global search capabilities within the Metric Insights application.
- Data Processor: Manages the integration between Metric Insights and external BI services.
- Console: Monitors the application's services and their status.
- Redis: Handles internal caching for optimized performance.
- Image Generator: Renders images directly from web pages.
Optional services:
- Remote Data Processor: A service for BI Tools that require integrating from a Windows environment instead of Linux.
Additional items of note:
- A minimum of 3 Nodes is required for automatic failover.
- MySQL is required to host the Metric Insights application database, and it should run on a remote server.
- Persistent storage is required for the shared file system.
Ensure the following ports are open:
- 80*, 443: HTTP and HTTPS ports for the UI Application Service (by default, redirection to 443).
- NOTE: Opening port 80 is optional. Opening port 80 allows browser redirection to HTTPS when a user enters
subdomain.domain.comin the browser without the protocol.
- NOTE: Opening port 80 is optional. Opening port 80 allows browser redirection to HTTPS when a user enters
- 3306: MySQL port.
- 8080, 8443: HTTP/HTTPS ports for the REST API Data Processor service.
- 8081: TCP port for the Console Tool.
- 6379: Port that needs to be opened within the namespace (network rules).
Below is an architectural diagram of Metric Insights deployed in OpenShift. A namespace is a virtual cluster that consists of several Nodes (servers). The Nodes host Pods that are essentially Containers. Metric Insights consists of services that run inside their own Containers, rooted to a shared file system for persistence.
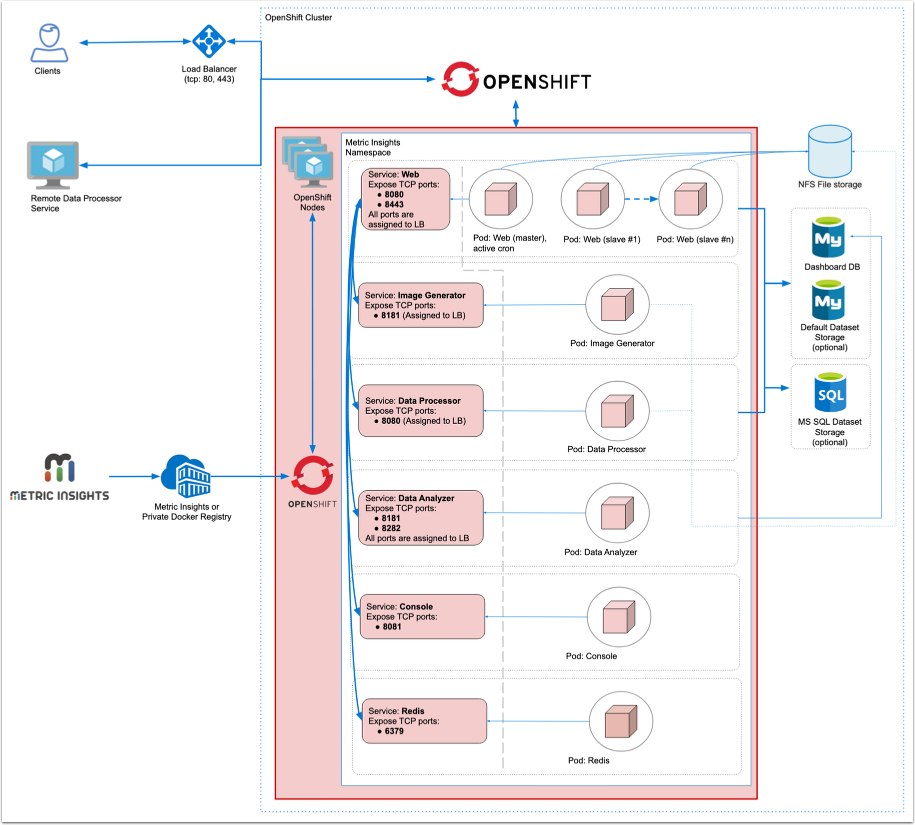
NOTE: Opening port 80 is optional. See the list of ports below for details.
The deployment scheme consists of the following services deployed in individual pods (1 service per pod):
Required services:
- Web Master, Web Slave replicas: The application's user interface.
- Data Analyzer: Provides global search capabilities within the Metric Insights application.
- Data Processor: Manages the integration between Metric Insights and external BI services.
- Console: Monitors the application's services and their status.
- Redis: Handles internal caching for optimized performance.
- Image Generator: Renders images directly from web pages.
Optional services:
- Remote Data Processor: A service for BI Tools that require integrating from a Windows environment instead of Linux.
Additional items of note:
- A minimum of 3 Nodes is required for automatic failover.
- MySQL is required to host the Metric Insights application database, and it should run on a remote server.
- Persistent storage is required for the shared file system.
Ensure the following ports are open:
- 80*, 443: HTTP and HTTPS ports for the UI Application Service (by default, redirection to 443).
- NOTE: Opening port 80 is optional. Opening port 80 allows browser redirection to HTTPS when a user enters
subdomain.domain.comin the browser without the protocol.
- NOTE: Opening port 80 is optional. Opening port 80 allows browser redirection to HTTPS when a user enters
- 3306 - MySQL port.
- 8080, 8443 - HTTP/HTTPS ports for the REST API Data Processor service.
- 8081 - TCP port for the Console Tool.
- 6379 - port that needs to be opened within the namespace (network rules).
Below is an architectural diagram of Metric Insights deployed in OpenShift. A namespace is a virtual cluster that consists of several Nodes (servers). The Nodes host Pods that are essentially Containers. Metric Insights consists of services that run inside their own Container, rooted to a shared file system for persistence.
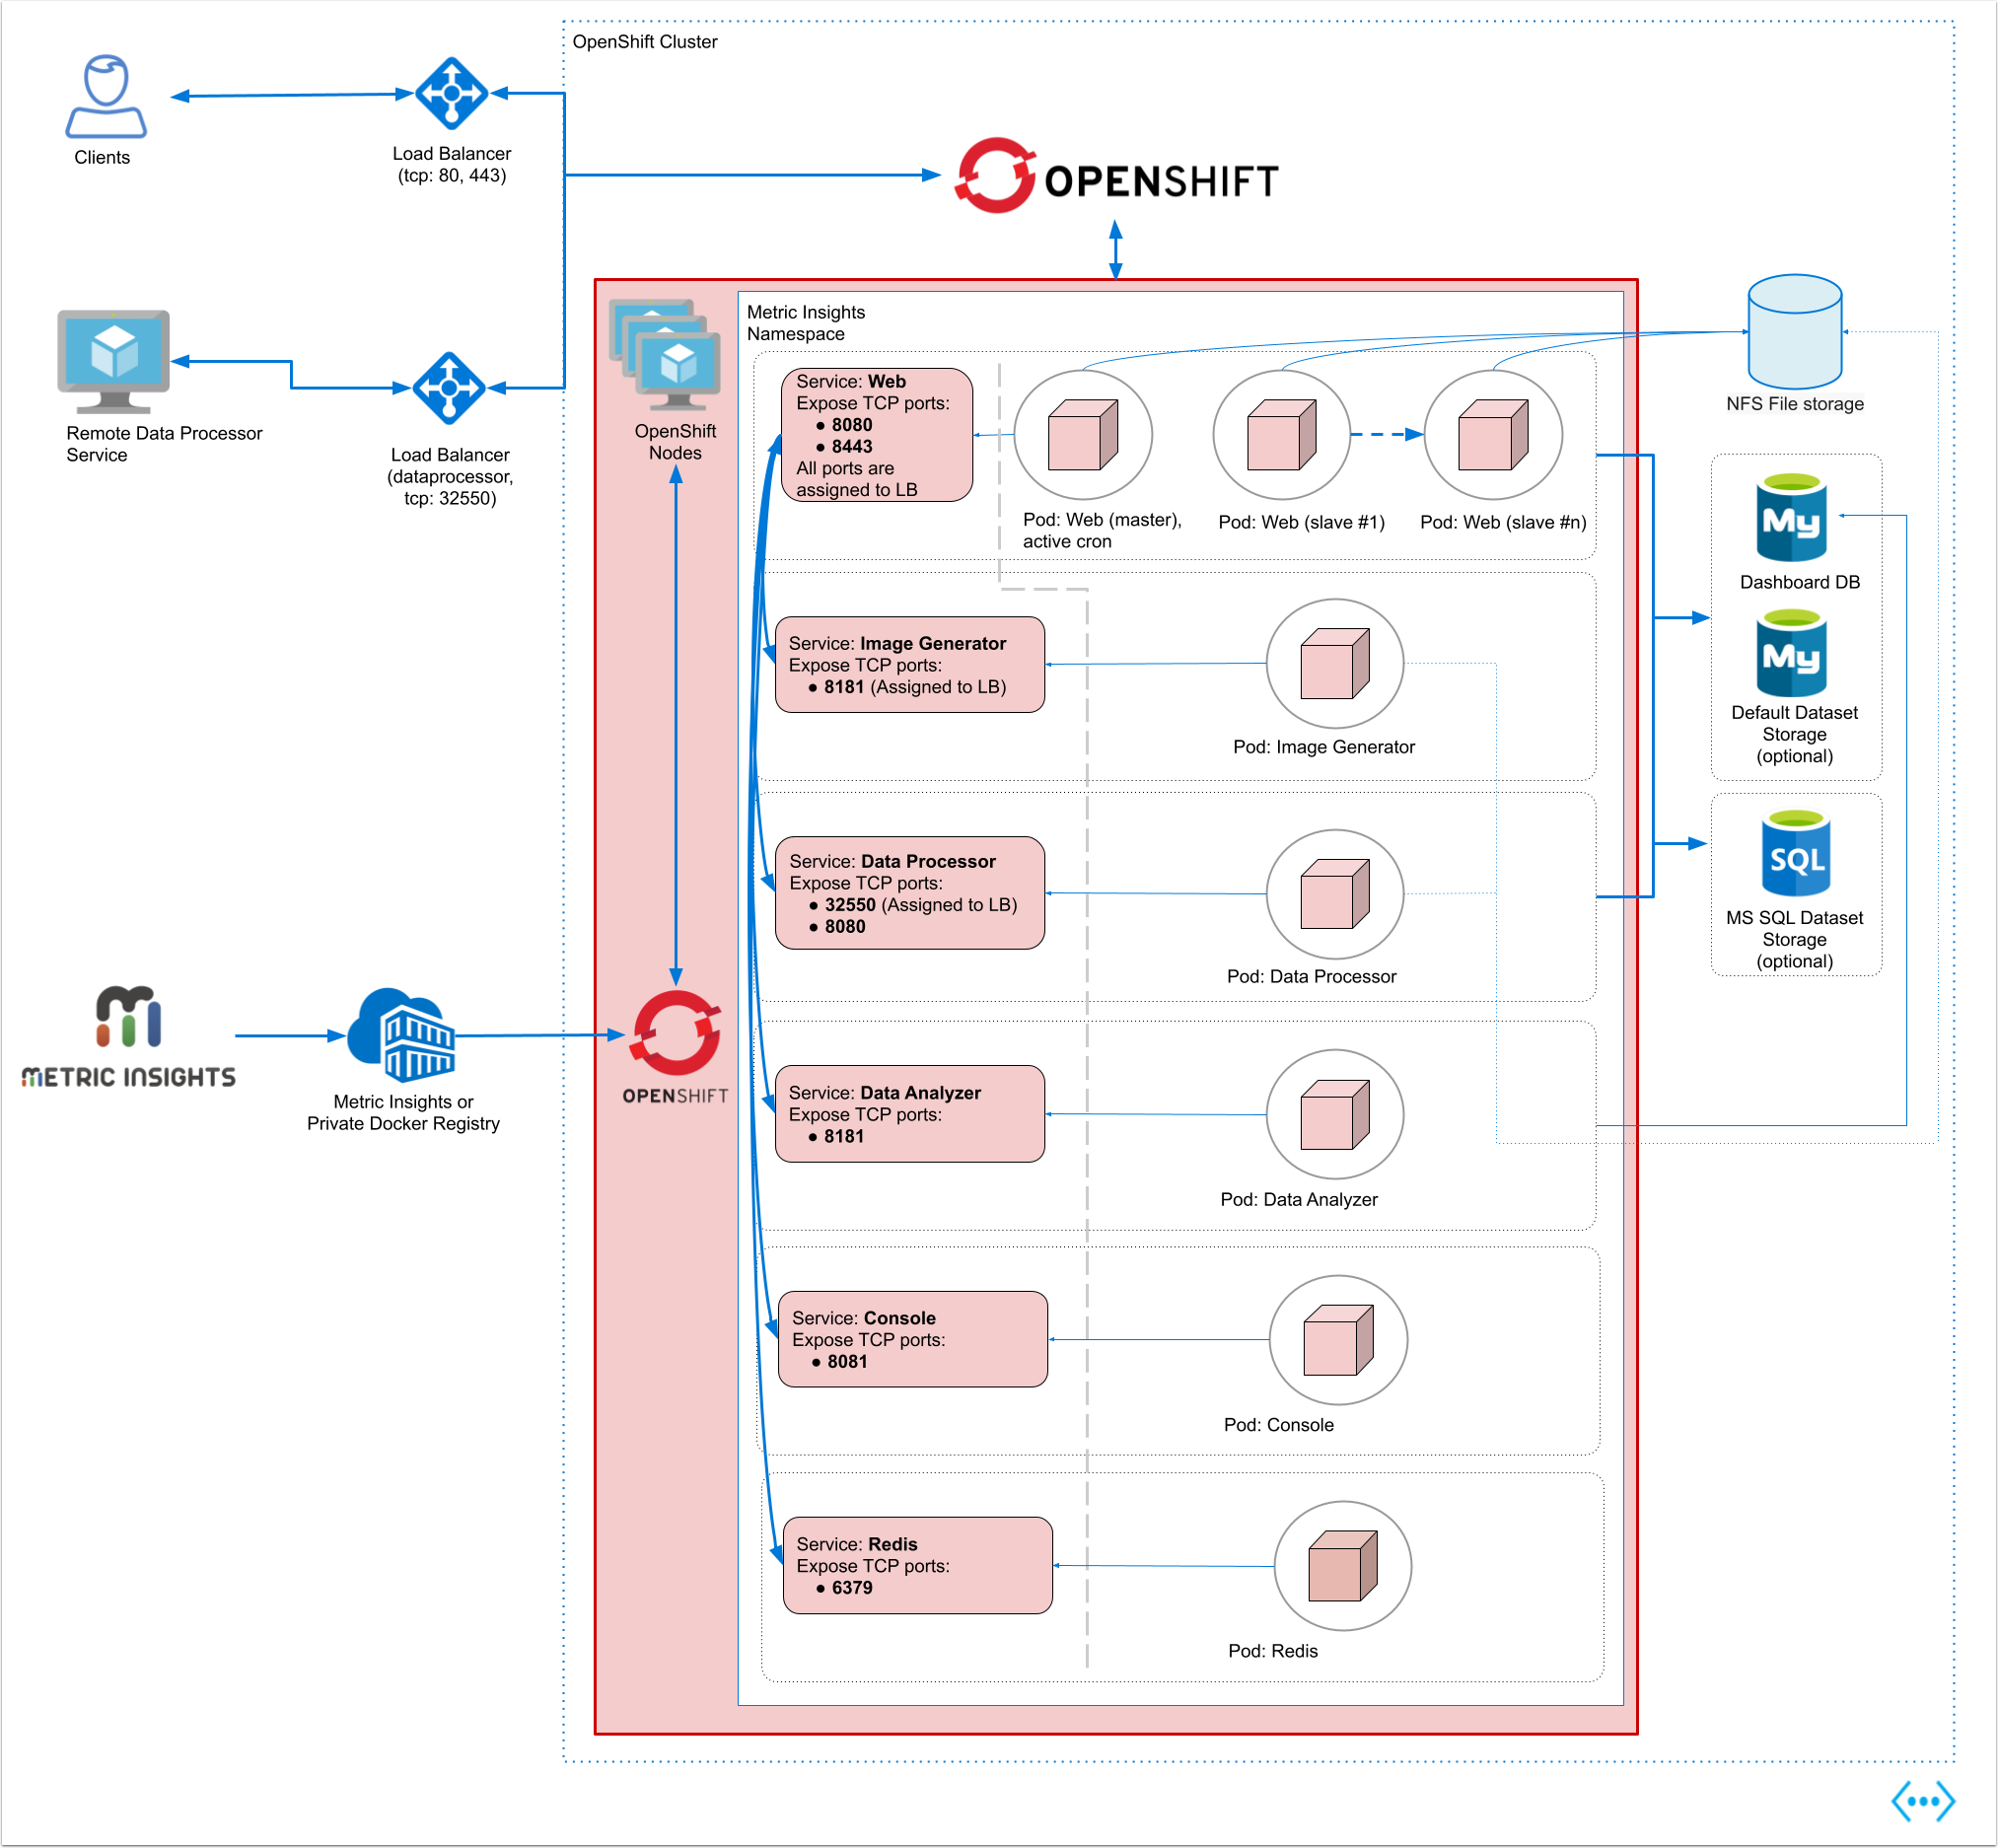
NOTE: Opening port 80 is optional. See the list of ports below for details.
The deployment scheme consists of the following services deployed in individual pods (1 service per pod):
Required services:
- Web Master, Web Slave replicas: The application's user interface.
- Data Analyzer: Provides global search capabilities within the Metric Insights application.
- Data Processor: Manages the integration between Metric Insights and external BI services.
- Console: Monitors the application's services and their status.
- Redis: Handles internal caching for optimized performance.
- Image Generator: Renders images directly from web pages.
Optional services:
- Remote Data Processor: A service for BI Tools that require integrating from a Windows environment instead of Linux.
Additional items of note:
- A minimum of 3 Nodes is required for automatic failover.
- MySQL is required to host the Metric Insights application database, and it should run on a remote server.
- Persistent storage is required for the shared file system.
Ensure the following ports are open:
- 80*, 443: HTTP and HTTPS ports for the UI Application Service (by default, redirection to 443).
- NOTE: Opening port 80 is optional. Opening port 80 allows browser redirection to HTTPS when a user enters
subdomain.domain.comin the browser without the protocol.
- NOTE: Opening port 80 is optional. Opening port 80 allows browser redirection to HTTPS when a user enters
- 32550: TCP port for external access to the Data Processor cluster.
- 3306: MySQL port.
- 8080, 8443: HTTP/HTTPS ports for the REST API Data Processor service.
- 8081: TCP port for the Console Tool.
- 6379: Port that needs to be opened within the namespace (network rules).
Below is an architectural diagram of Metric Insights deployed in OpenShift. A namespace is a virtual cluster that consists of several Nodes (servers). The Nodes host Pods that are essentially Containers. Metric Insights consists of services that run inside their own Container, rooted to a shared file system for persistence.
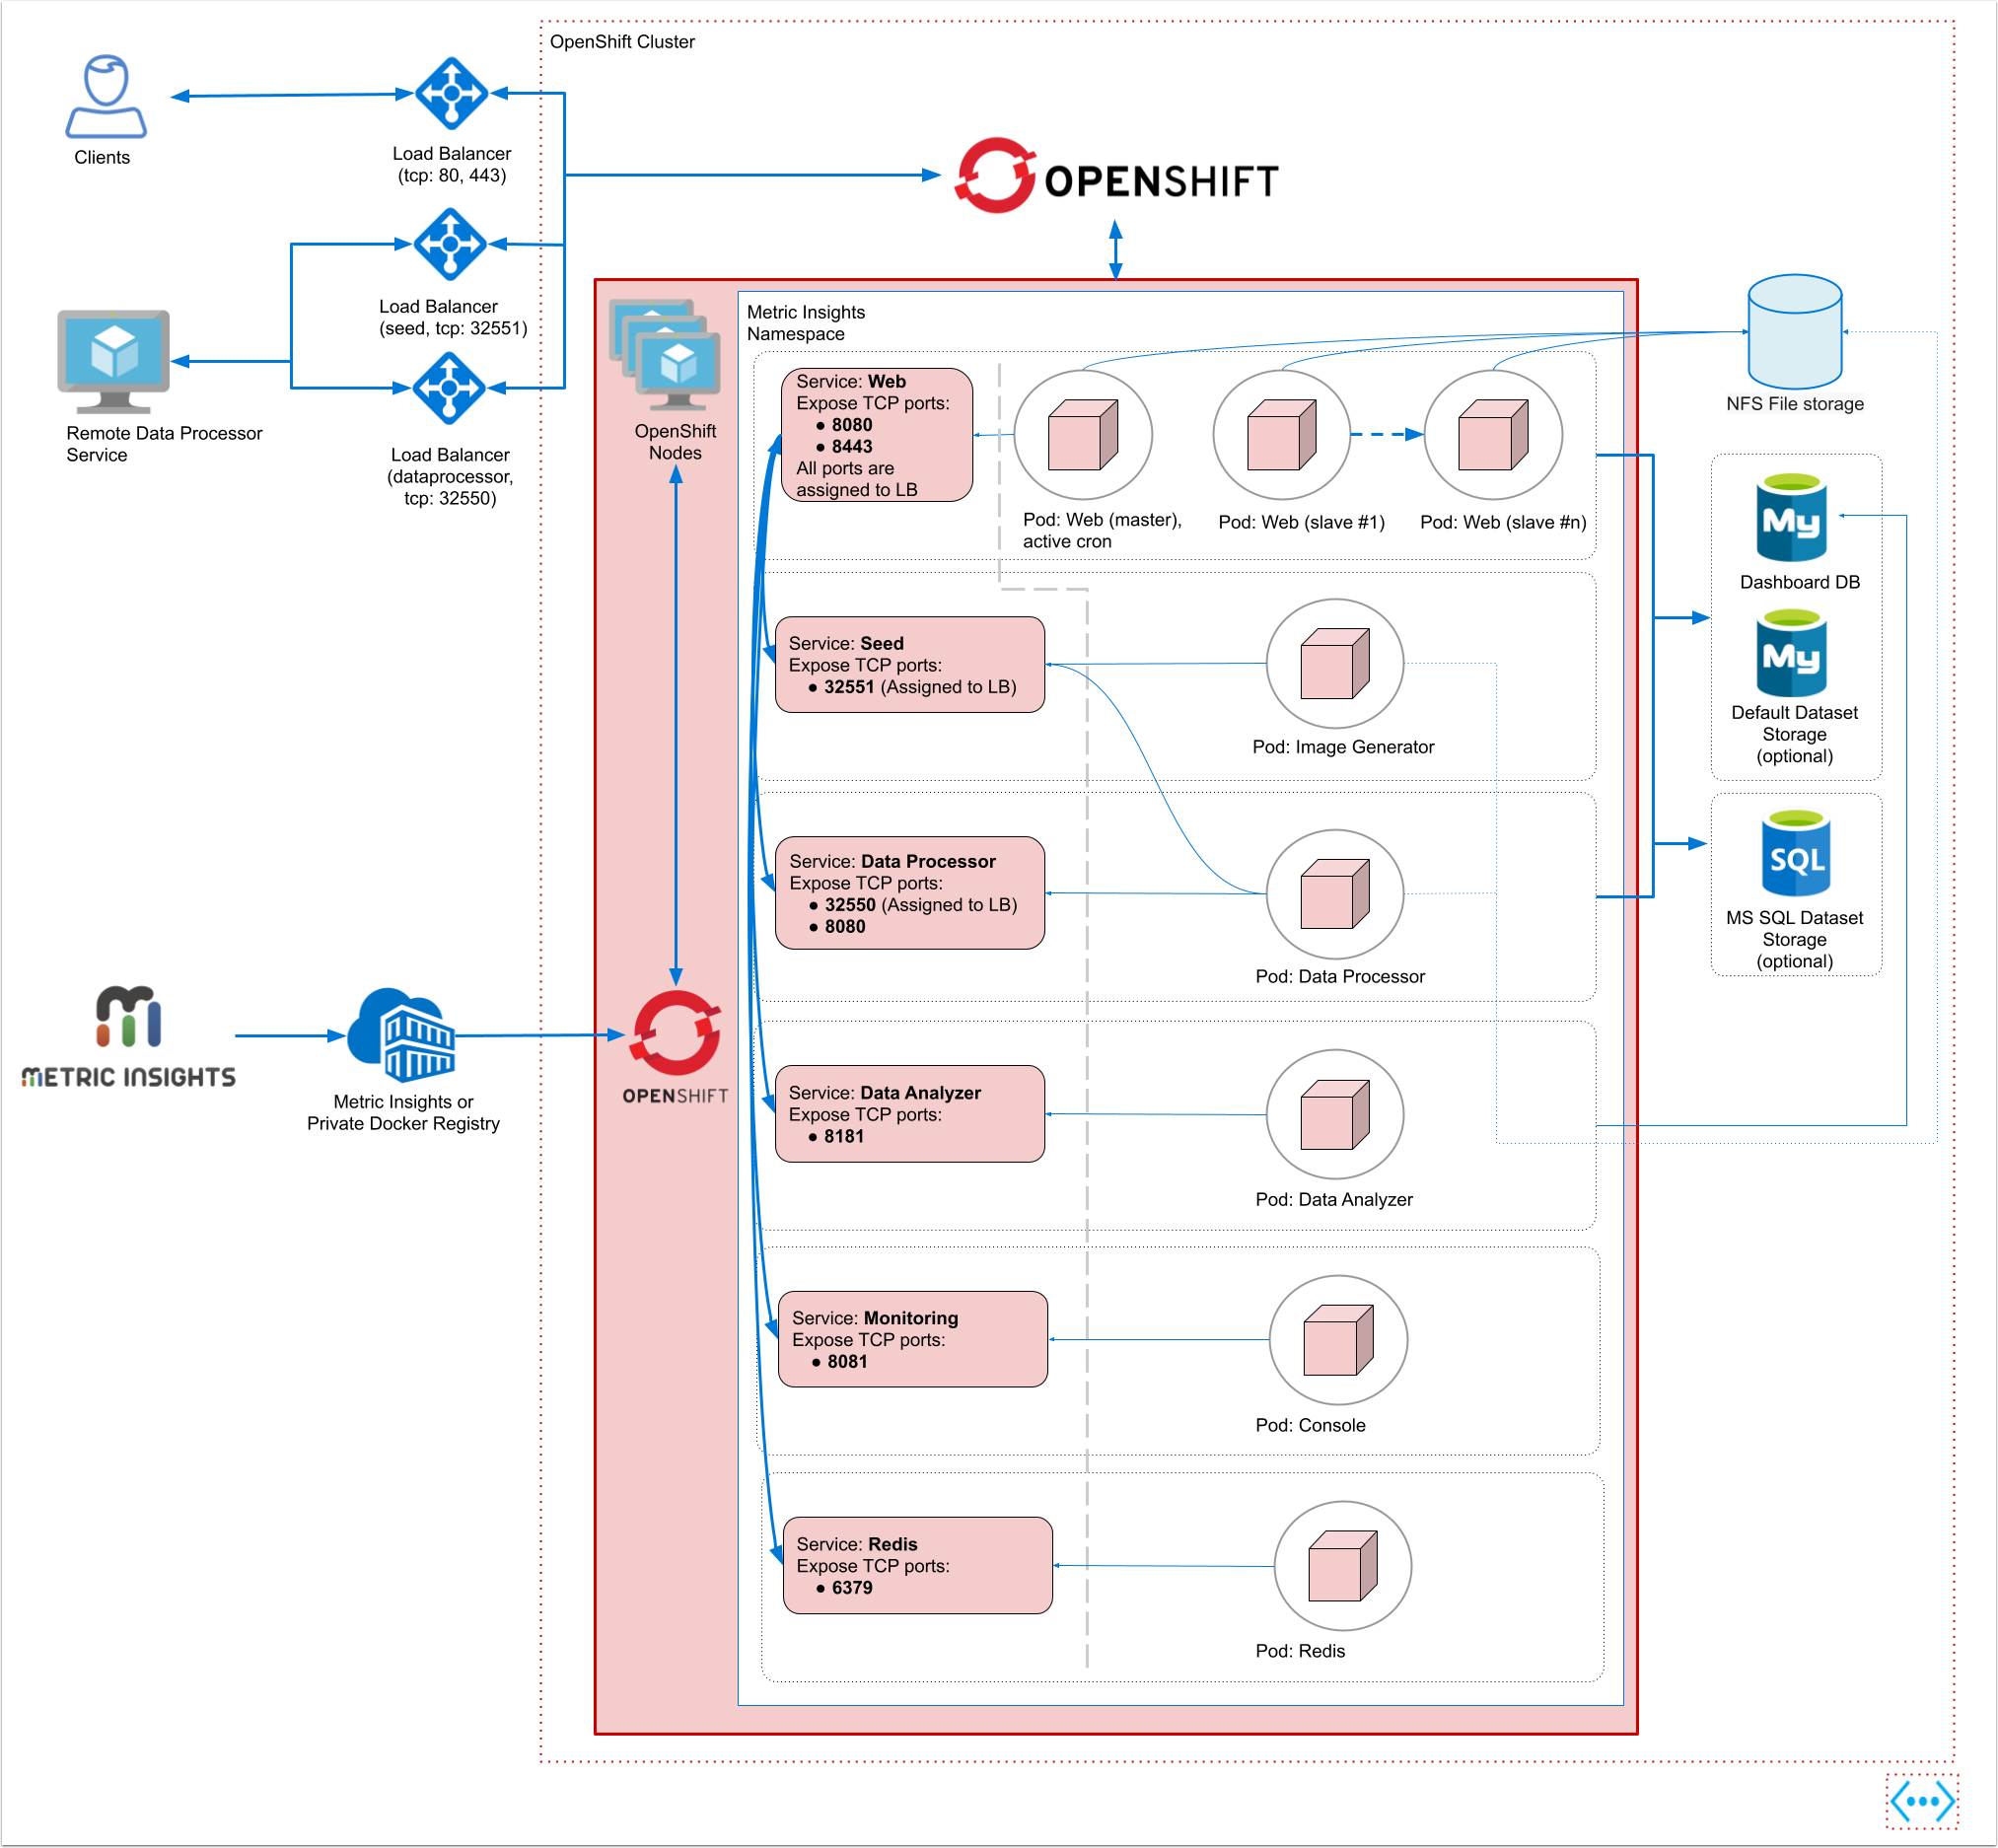
The deployment scheme consists of the following services deployed in individual pods (1 service per pod):
Required services:
- Web Master, Web Slave replicas: The application's user interface.
- Data Analyzer: Provides global search capabilities within the MI application.
- Data Processor: Manages the integration between MI and external BI services.
- Seed: Works together with Data Processor to manage integration between MI and external BI services.
- Monitoring: Monitors the application's services and their status.
- Redis: Handles internal caching for optimized performance.
Ensure the following ports are open:
- 80, 443 - HTTP/HTTPS ports for UI access;
- 32550 - TCP port for external access to the Data Processor cluster;
- 32551 - TCP port for external access to the Seed service;
- 3306 - MySQL port;
- 8080, 8443 - HTTP/HTTPS ports for the REST API Data Processor service;
- 8081 - TCP port for the Console Tool;
- 6379 - port that needs to be opened within the namespace (network rules).
Additional items of note:
- A minimum of 3 Nodes is required for automatic failover;
- MySQL is required to host the Metric Insights application database, and it should run on a remote server;
- Persistent storage is required for the shared file system.
2. Create a Project for the Metric Insights Application in the OpenShift Container Platform
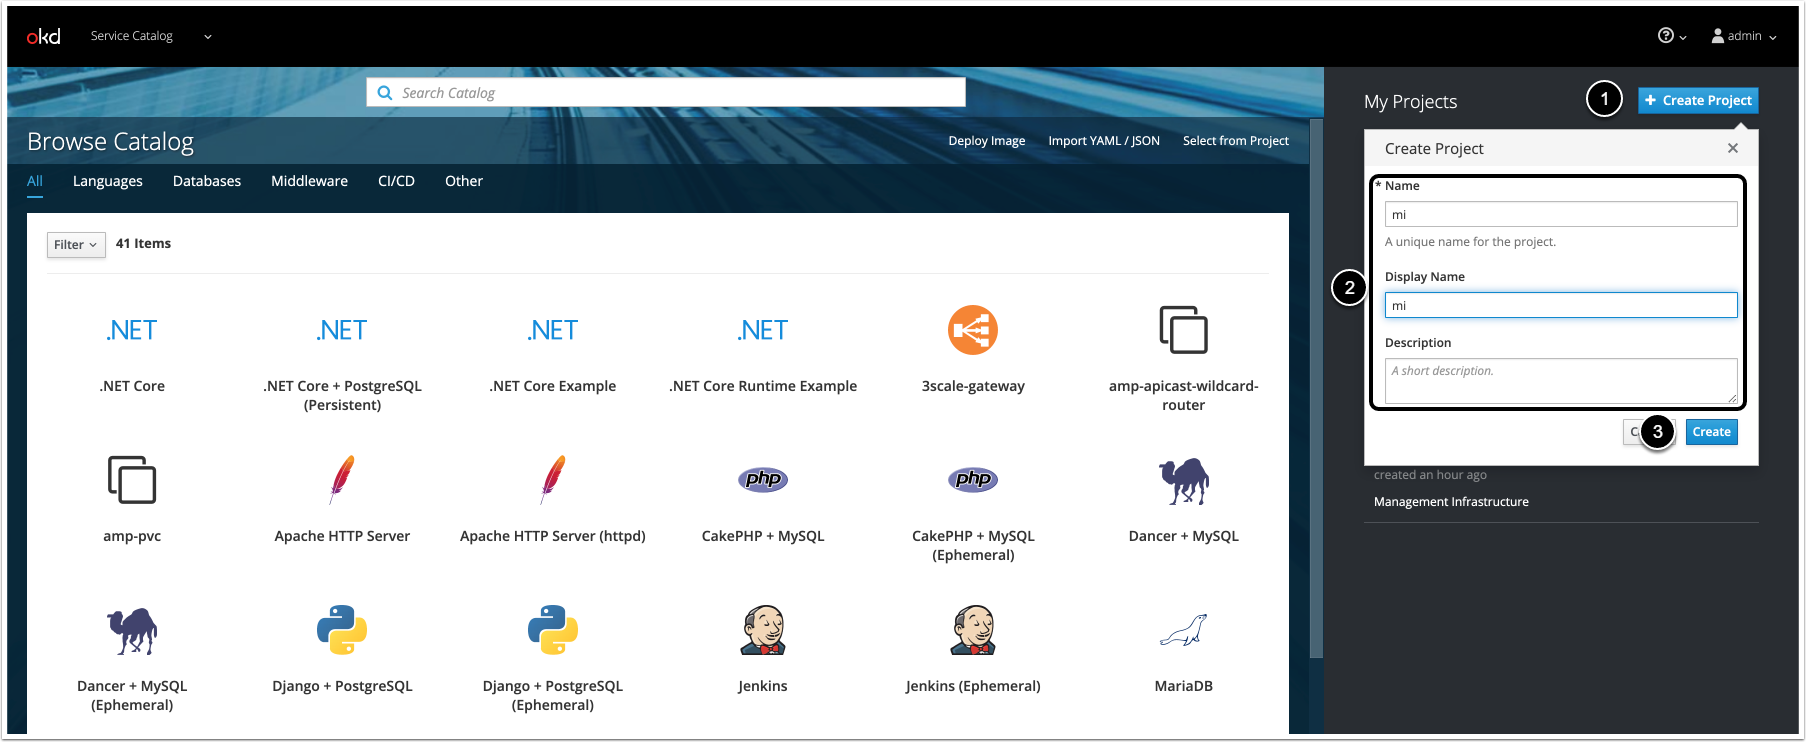
- [+ Create Project]
- Fill in the fields
- [Create]
3. Configure the Storage Class for Persistent Volumes
The OpenShift 3 deployment supports only the NFS type for the application file system that is shared across pods as persistent volumes.
In /etc/exports, set the mounted share to /opt/mi with the following options:
/opt/mi <worker_ip>(rw,fsid=1,crossmnt,no_subtree_check,no_root_squash,async)
4. Obtain Docker Registry Credentials
Contact Metric Insights Support for access to the official Metric Insights Docker Registry. Credentials are required for pulling Docker images for each Metric Insights service.
The Metric Insights Docker Registry address (docker.metricinsights.com) is specified in the deployment configuration file.
5. Generate the Deployment Files for the Metric Insights
Depending on the deployment type, replace <deployment_type> in the commands described below with the following values:
- OpenShift 3: replace
deployment_typewithopenshift3; - OpenShift 4: replace
deployment_typewithk8s.
- If the remote database server has the same timezone as the Metric Insights application, run
./installer.py kubernetes --type <deployment_type> --storage-class nfs --nfs-server-address <nfs.example.com> --ingress-controller-type nginx --hostname <MI_hostname> --dp-hostname <dataprocessor_hostname> --registry <registry_url> --timezone <MI_app_timezone> -o <deployment_file>.yml - If the remote database server has a different timezone than the Metric Insights application, use
./installer.py kubernetes --type deployment_type--storage-class nfs --nfs-server-address nfs.example.com --ingress-controller-type nginx --hostname MI_hostname --dp-hostname dataprocessor_hostname --registry registry_url --timezone MI_app_timezone --mysql-timezone remote_database_server_timezone -o deployment_file.yml
Use ./installer.py kubernetes -h for more options. See Basic Console Commands section for details.
To generate the set of files required for the Metric Insights deployment, refer to the Generate the Deployment Files by the Installation Wizard article.
6. Create & Upload Secrets for Each MI Service
NOTE: This step is required only if you generated the deployment file with the Installer.
There are default secret files for each service in MetricInsights-Installer-vX.X.X-Full/utils/orchestration/kubernetes/secrets/:
v7.0.1+:
| Secret File | Service |
|---|---|
data-analyzer.env |
Data Analyzer |
dataprocessor.env |
Data Processor |
console.env |
Console |
mysql.secret |
MySQL |
image-generator.env |
Image Generator |
web.env |
Web Service |
redis.env |
Redis |
v6.4.5:
| Secret File | Service |
|---|---|
data-analyzer.env |
Data Analyzer |
dataprocessor.env |
Data Processor |
monitoring.env |
Monitoring |
mysql.secret |
MySQL |
seed.env |
Seed |
web.env |
Web Service |
redis.env |
Redis |
Create the secrets for each service by uploading each file to the namespace using oc create:
v7.0.1+:
$ oc create secret generic --namespace <MI-namespace> metricinsights-mysql-root-password --from-file mysql.secret
$ oc create secret generic --namespace <MI-namespace> metricinsights-data-analyzer --from-file data-analyzer.env
$ oc create secret generic --namespace <MI-namespace> metricinsights-web --from-file web.env
$ oc create secret generic --namespace <MI-namespace> metricinsights-dataprocessor --from-file dataprocessor.env
$ oc create secret generic --namespace <MI-namespace> metricinsights-console --from-file console.env
$ oc create secret generic --namespace <MI-namespace> metricinsights-redis --from-file redis.env
$ oc create secret generic --namespace <MI-namespace> metricinsights-image-generator --from-file image-generator.env
v6.4.5:
$ oc --namespace <MI-namespace> create secret generic metricinsights-web --from-fileweb.env
$ oc --namespace MI-namespace create secret generic metricinsights-dataprocessor --from-filedataprocessor.env
$ oc --namespace MI-namespace create secret generic metricinsights-seed --from-fileseed.env
$ oc --namespace MI-namespace create secret generic metricinsights-mysql-root-password --from-filemysql.secret
$ oc --namespace MI-namespace create secret generic metricinsights-data-analyzer --from-filedata-analyzer.env
$ oc --namespace MI-namespace create secret generic metricinsights-monitoring --from-filemonitoring.env
$ oc --namespace MI-namespace create secret generic metricinsights-redis --from-file redis.envSecret is an object for storing and managing sensitive information like passwords and OAuth tokens. Before deploying to OpenShift 3/4, Docker Registry credentials must be registered as the Secret for K8s to reference. Metric Insights uses a secret labeleddocker-registryto authenticate in Docker Registry to pull the images.
6.1. Access the Created Project for Metric Insights Application
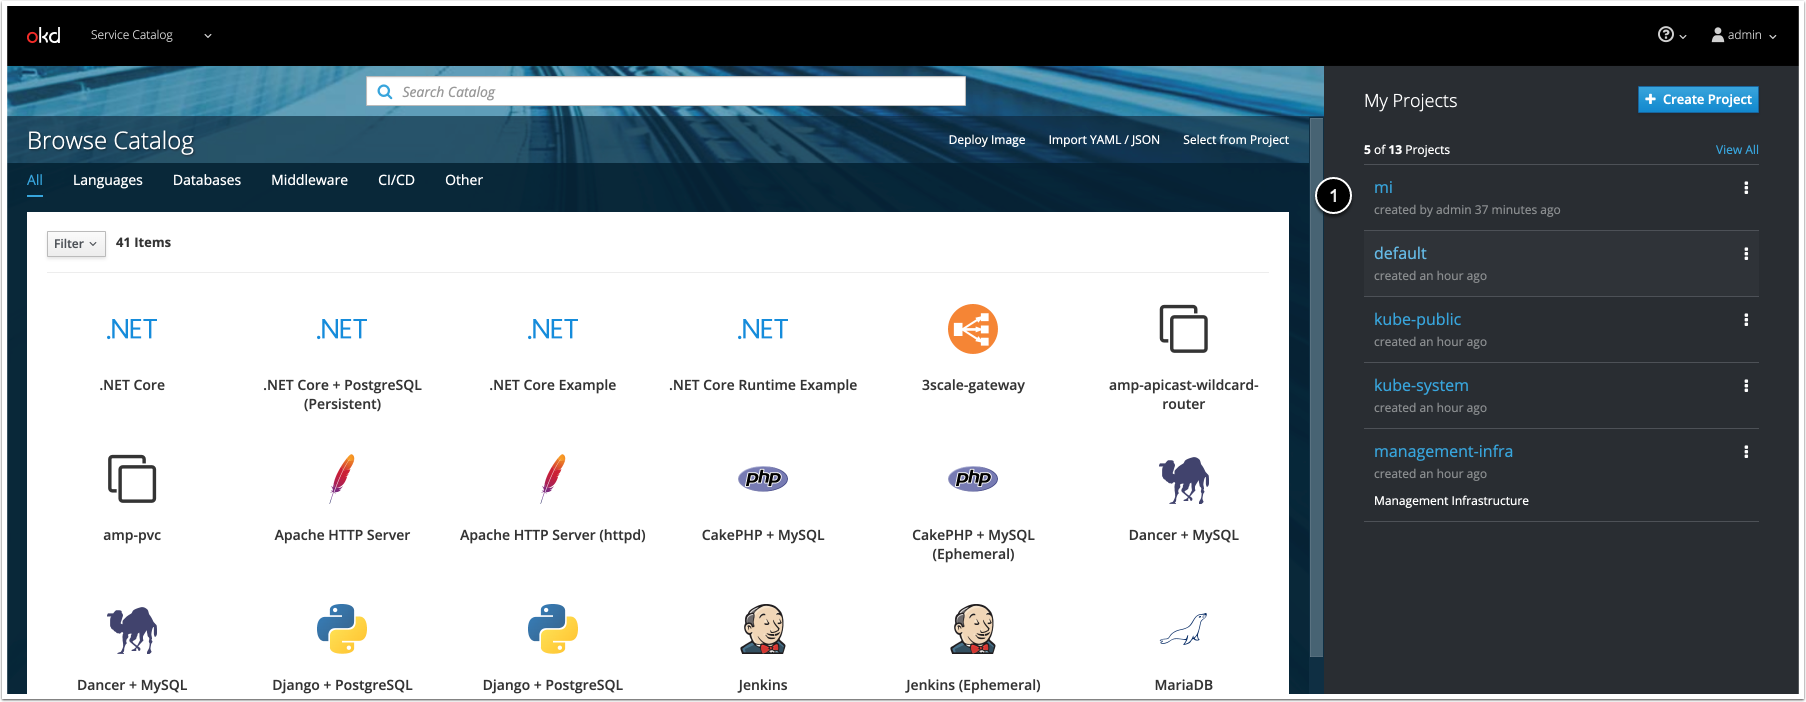
- Select the project.
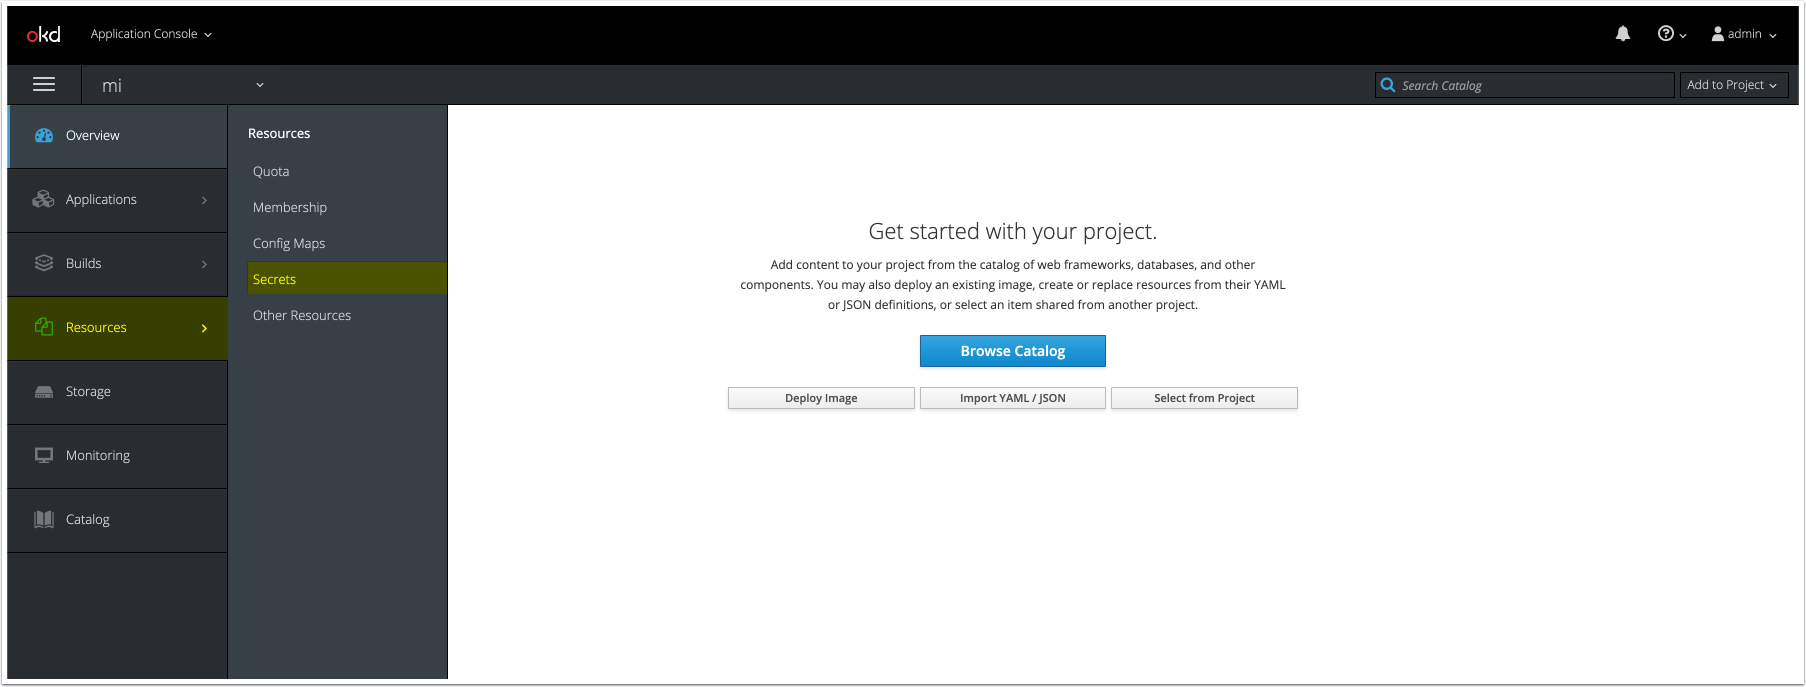
6.2. Access Resources > Secrets
6.3. Create the Secret to Pull the Docker Image
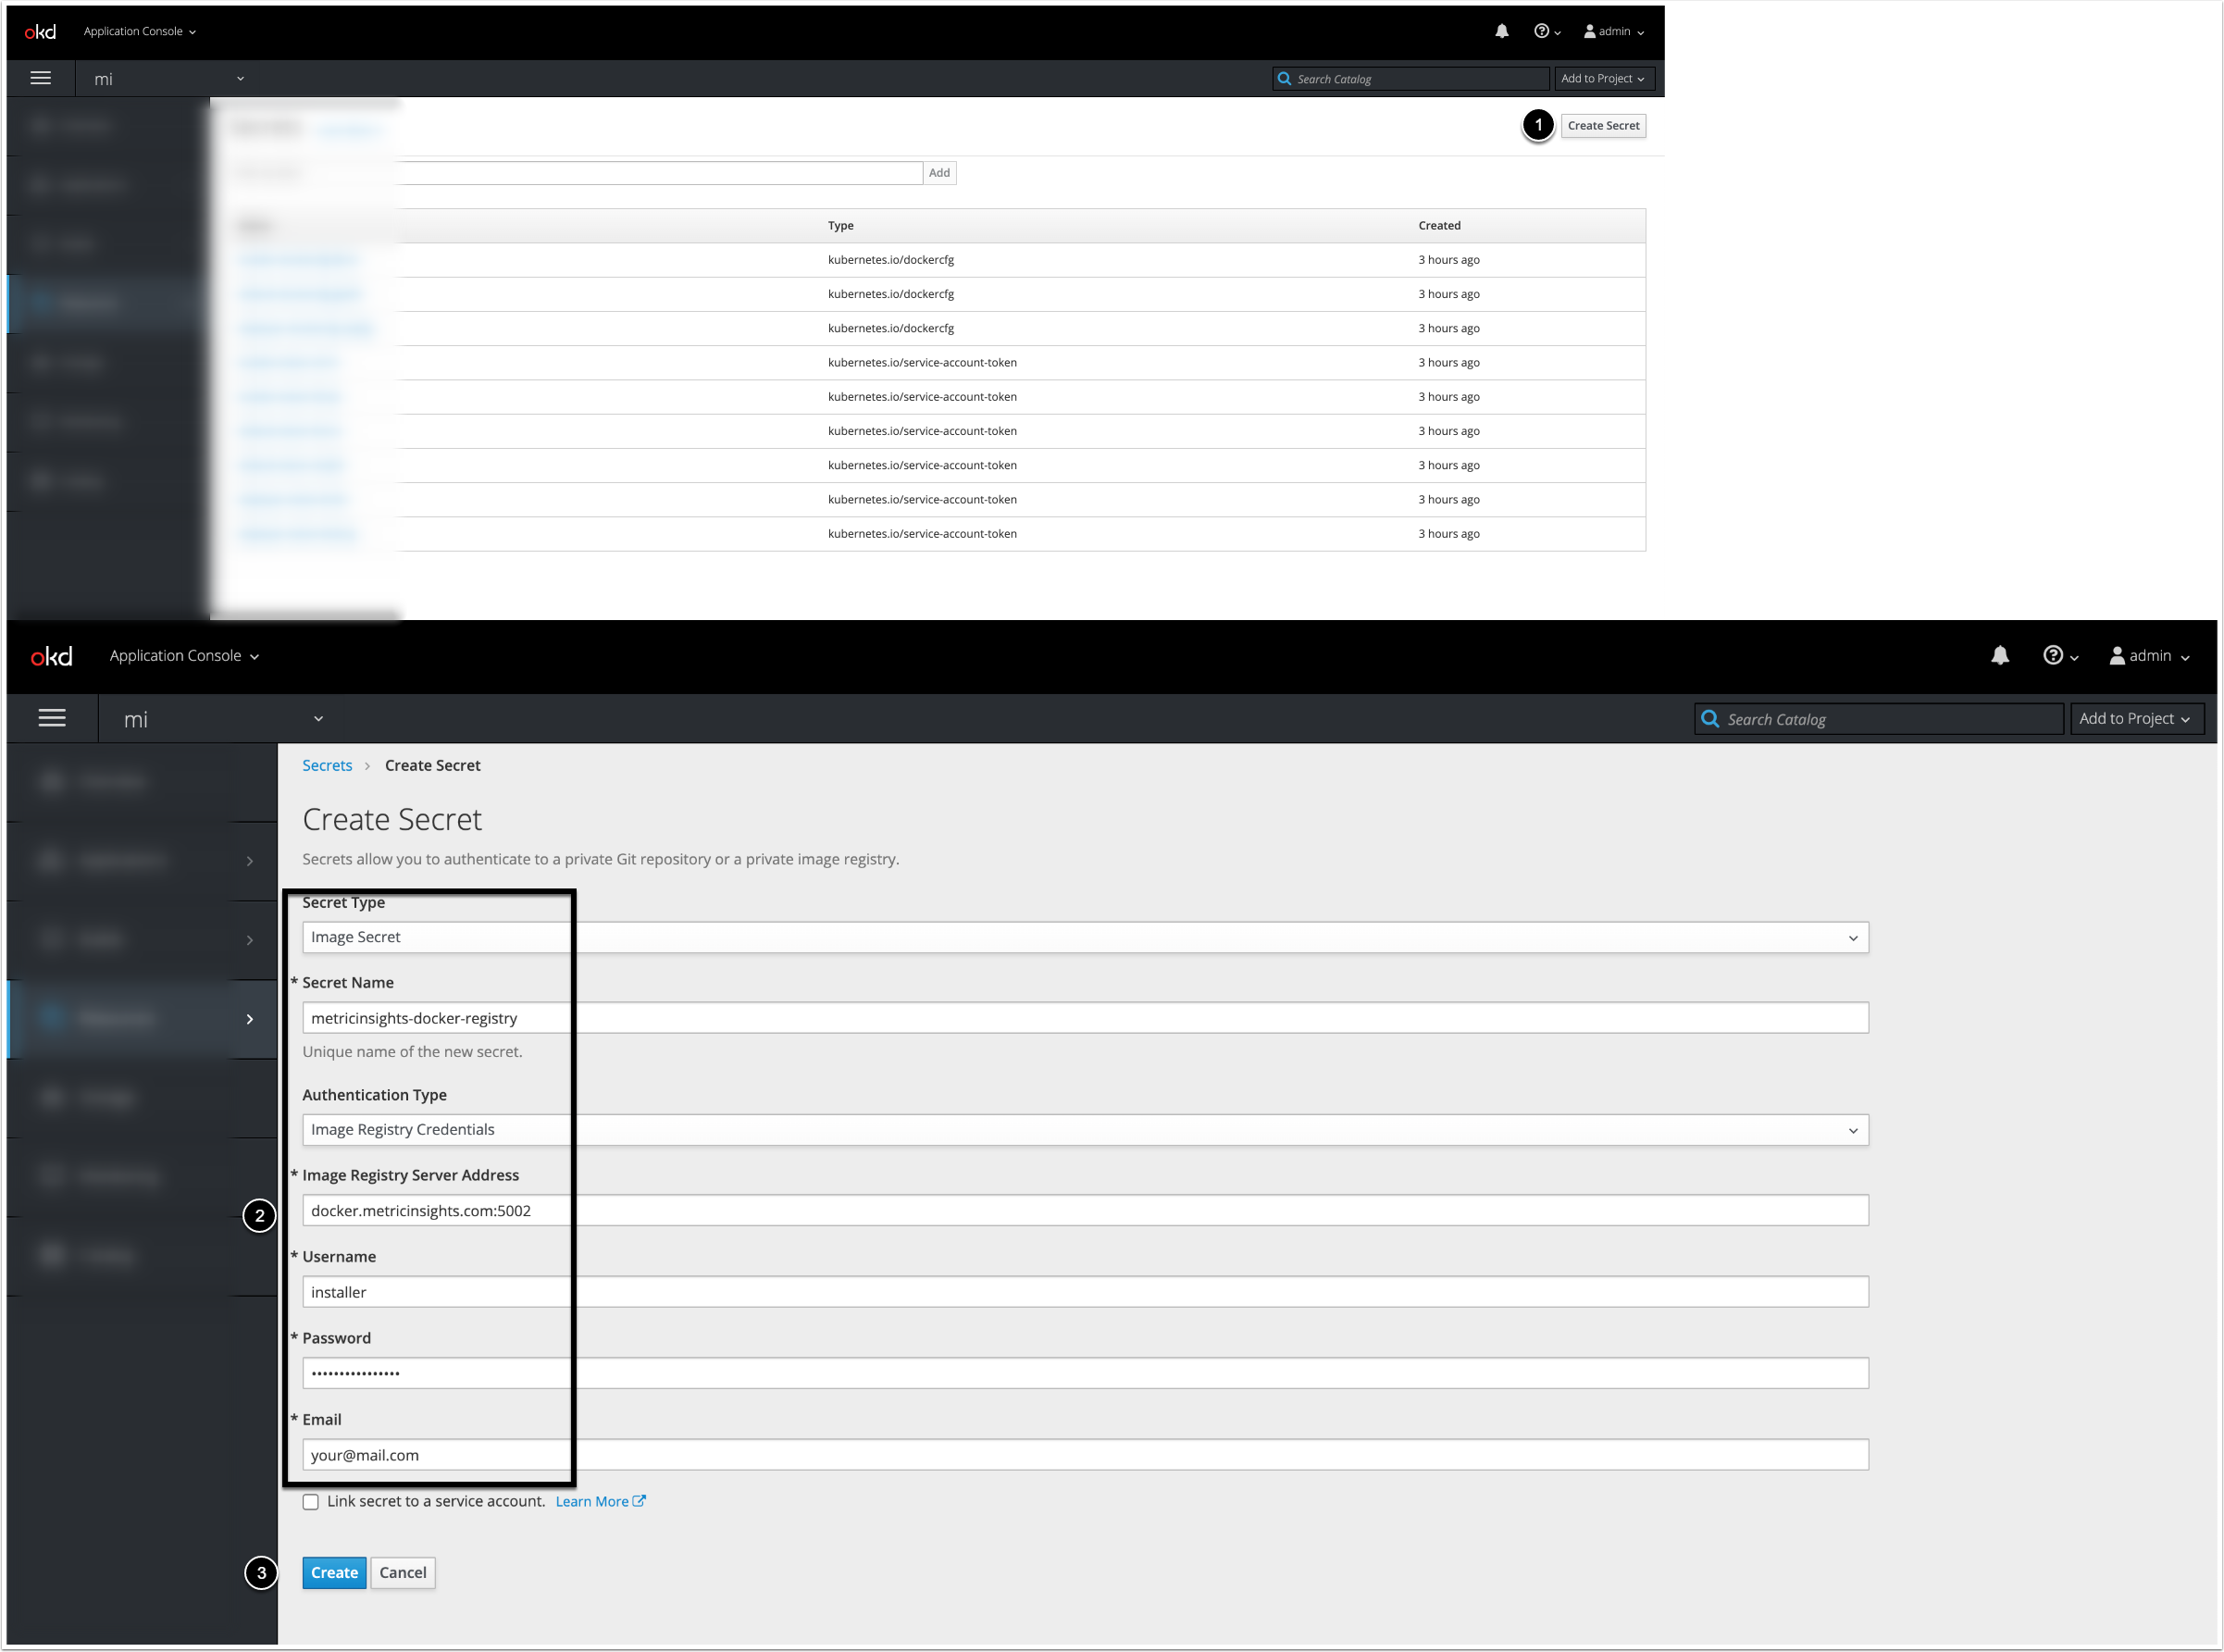
- [Create Secret]
- Complete the fields.
- [Create]
6.4. Create the Secrets for the Metric Insights Services
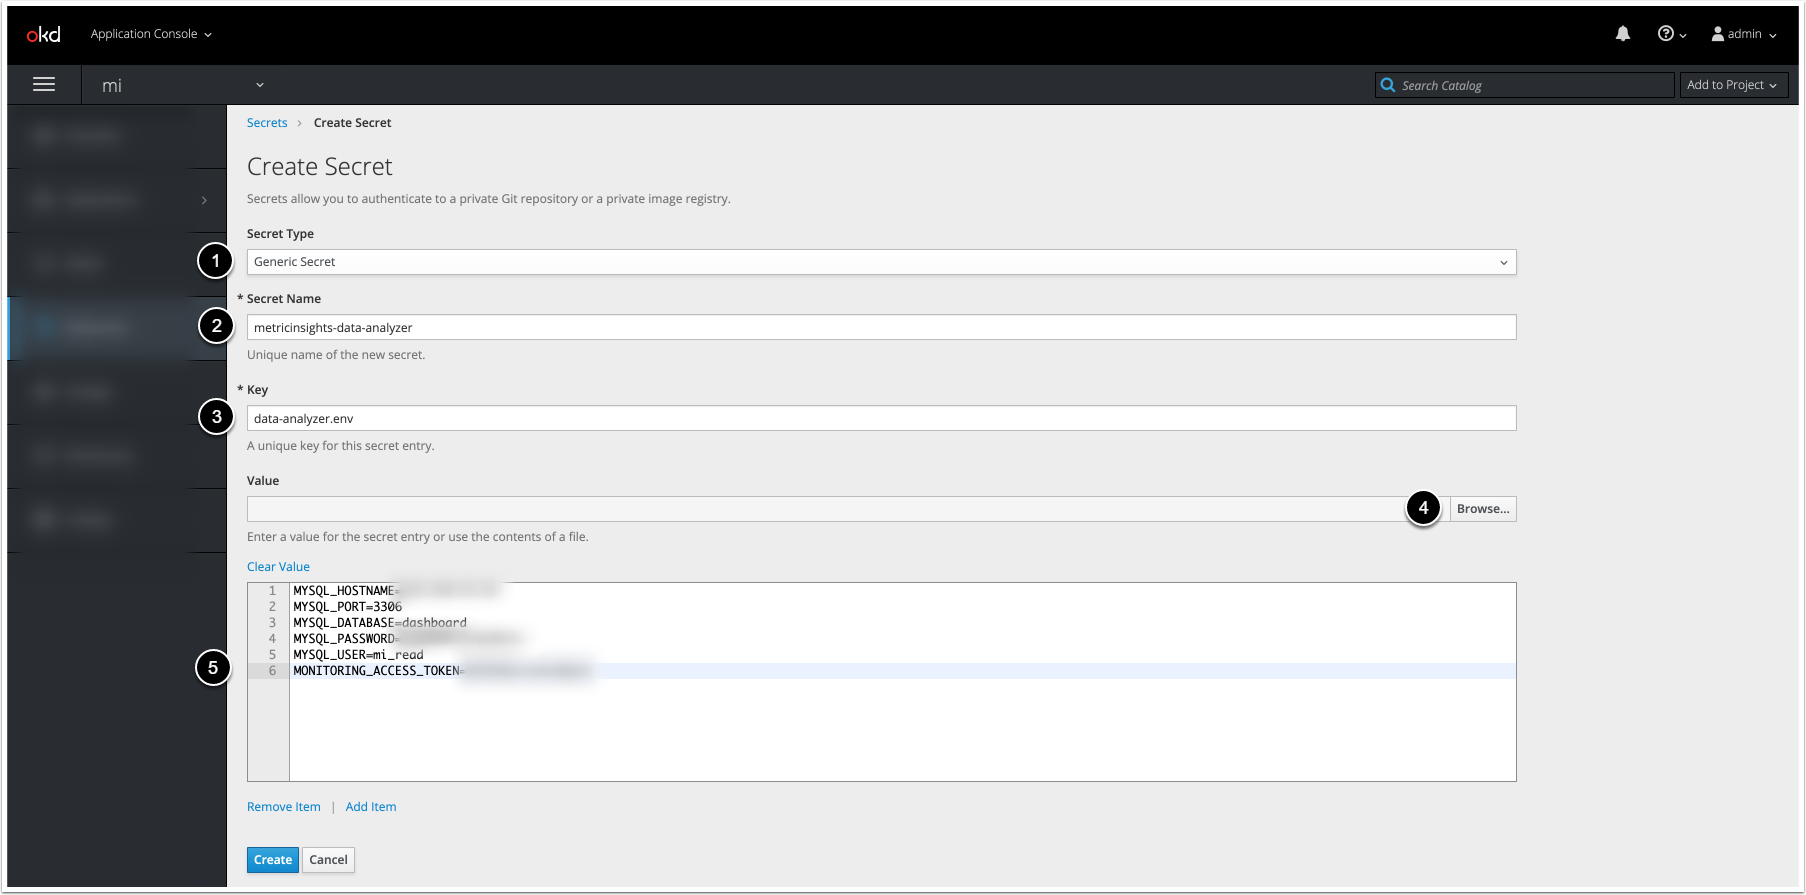
The screenshot displays an example of how the fields must be completed to create the secret for Data Analyzer Service (data-analyzer.env). Follow the steps below to create the secrets for the remaining services: Web, Data Processor, Seed, Monitoring, MySQL.
- Choose "Generic Secret" from Secret Type drop-down list.
- Enter a unique secret name.
- Enter a unique key for the secret.
- To upload a file template, [Browse].
- If you have uploaded the file template, you do not need to copy and paste its content into the field.
7. Deploy the Metric Insights Application
NOTE: For OpenShift (CRI-O container runtime) deployments, edit each securityContext block in the generated manifest before applying it and change readOnlyRootFilesystem from "true" to "false". Apply this change to the web, dataprocessor, data-analyzer, image-generator, redis, mysql, and console deployments:
        securityContext:
          readOnlyRootFilesystem: false
This change is required since Metric Insights' approach to dynamic volumes is not compatible with CRI-O security rules when the root filesystem is read-only.
7.1. Access Add to Project > Import YAML / JSON
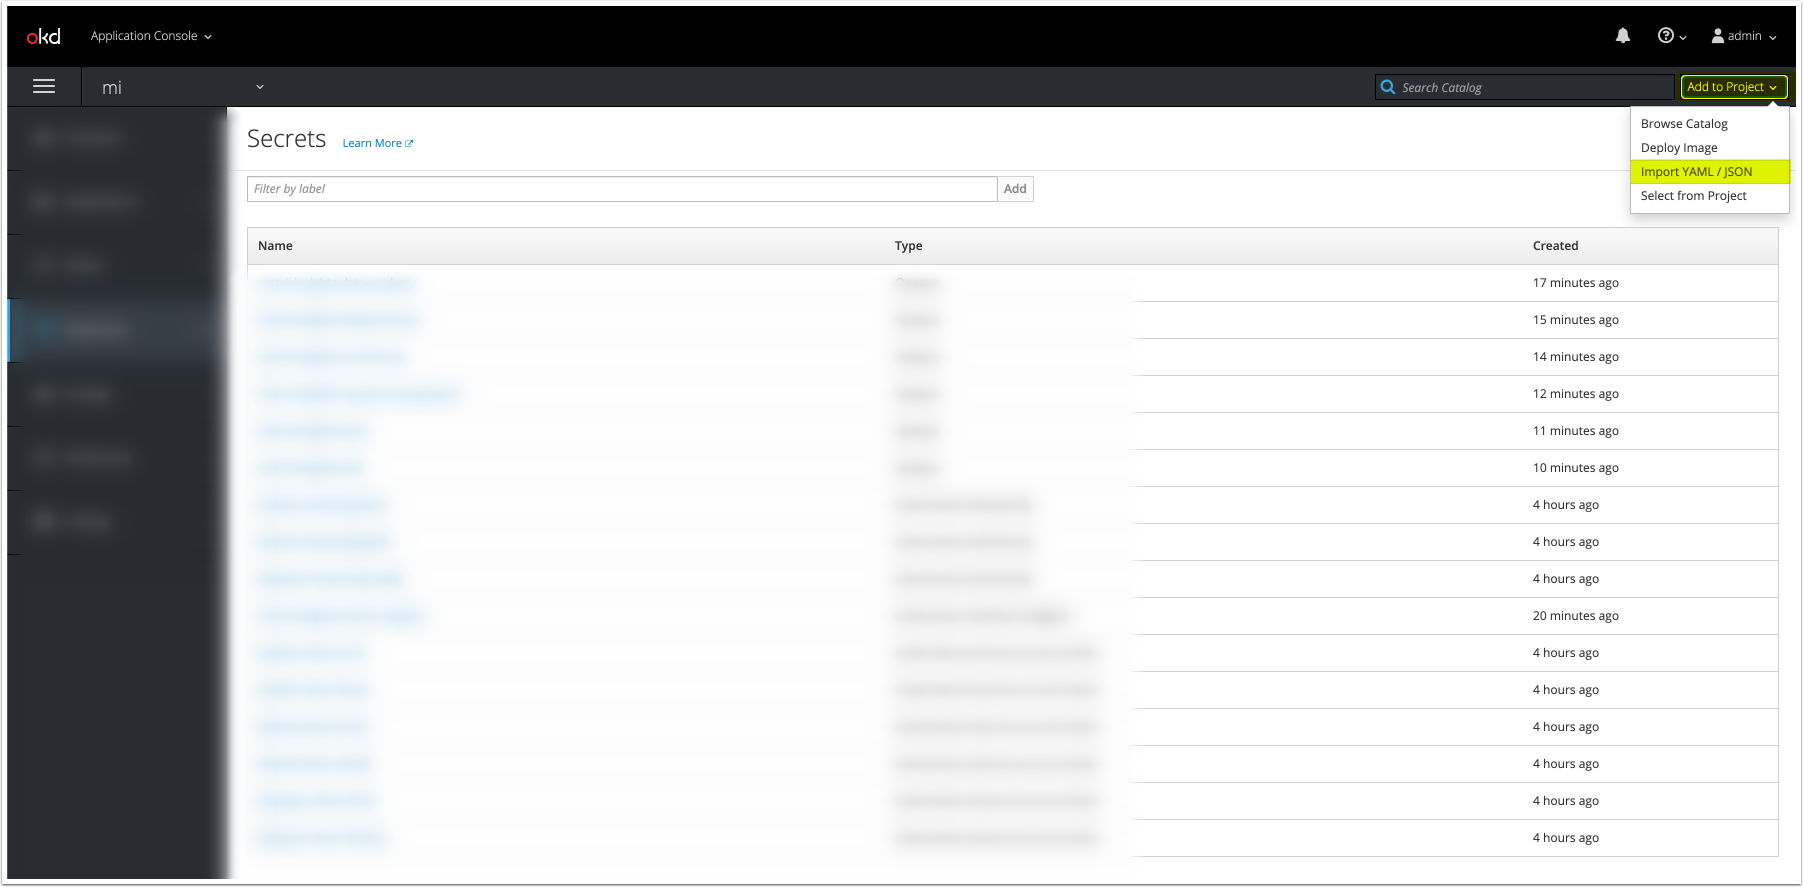
7.2. Upload the Deployment File
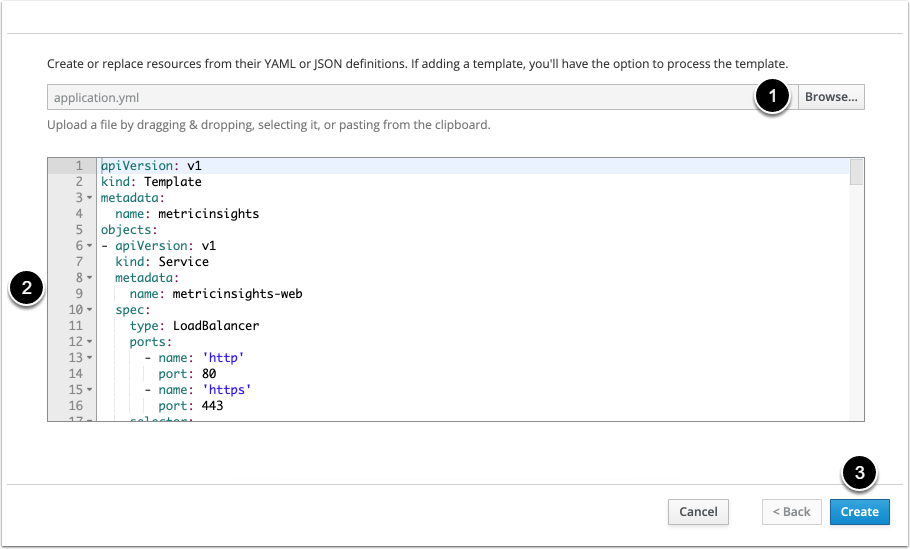
- To upload the deployment file, click [Browse].
- Optionally, copy and paste the YAML file content in the field. This step is appropriate if you have not uploaded it using [Browse]
- [Create]
7.3. Deploy the Metric Insights Application
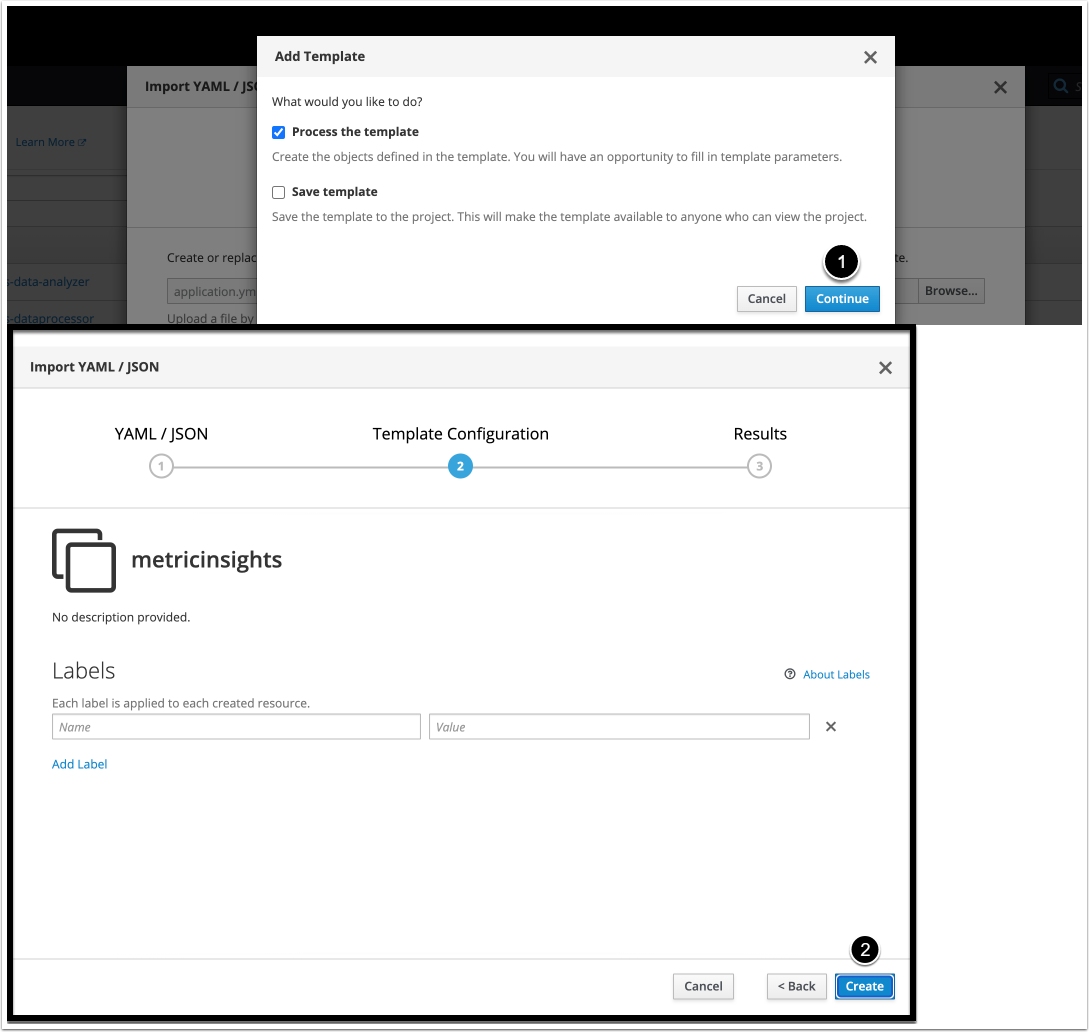
- [Continue]
- [Create]
7.4. Confirm the Deployment of the Metric Insights Application
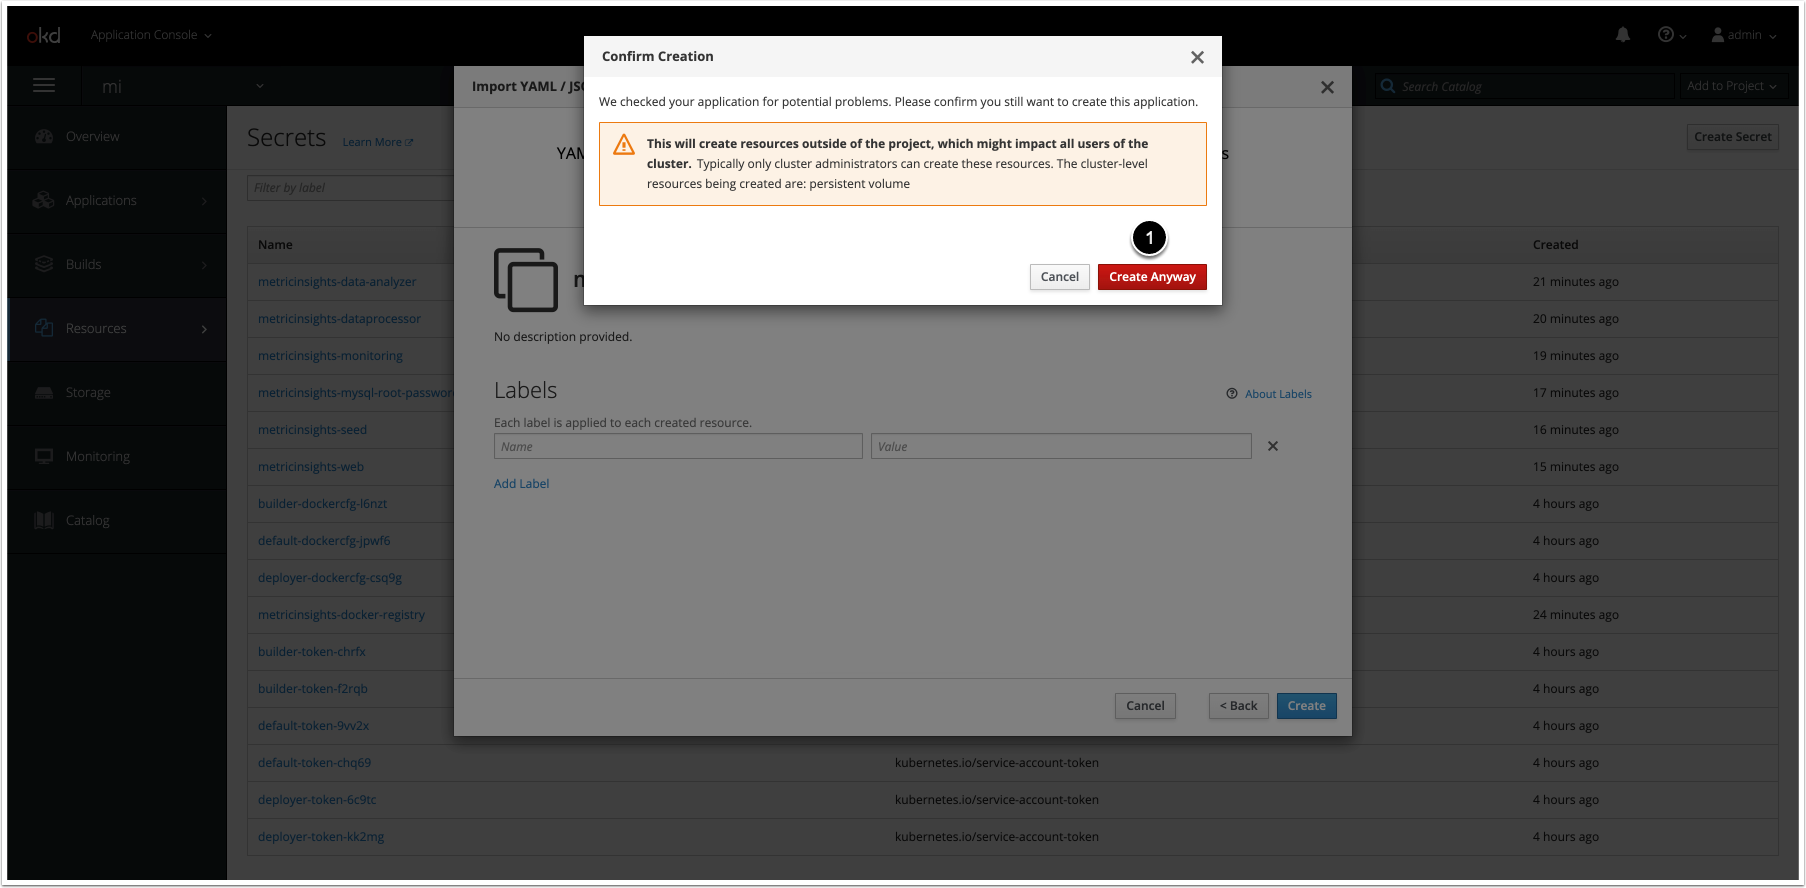
- [Create Anyway]
7.5. Finish the Deployment of the Metric Insights Application
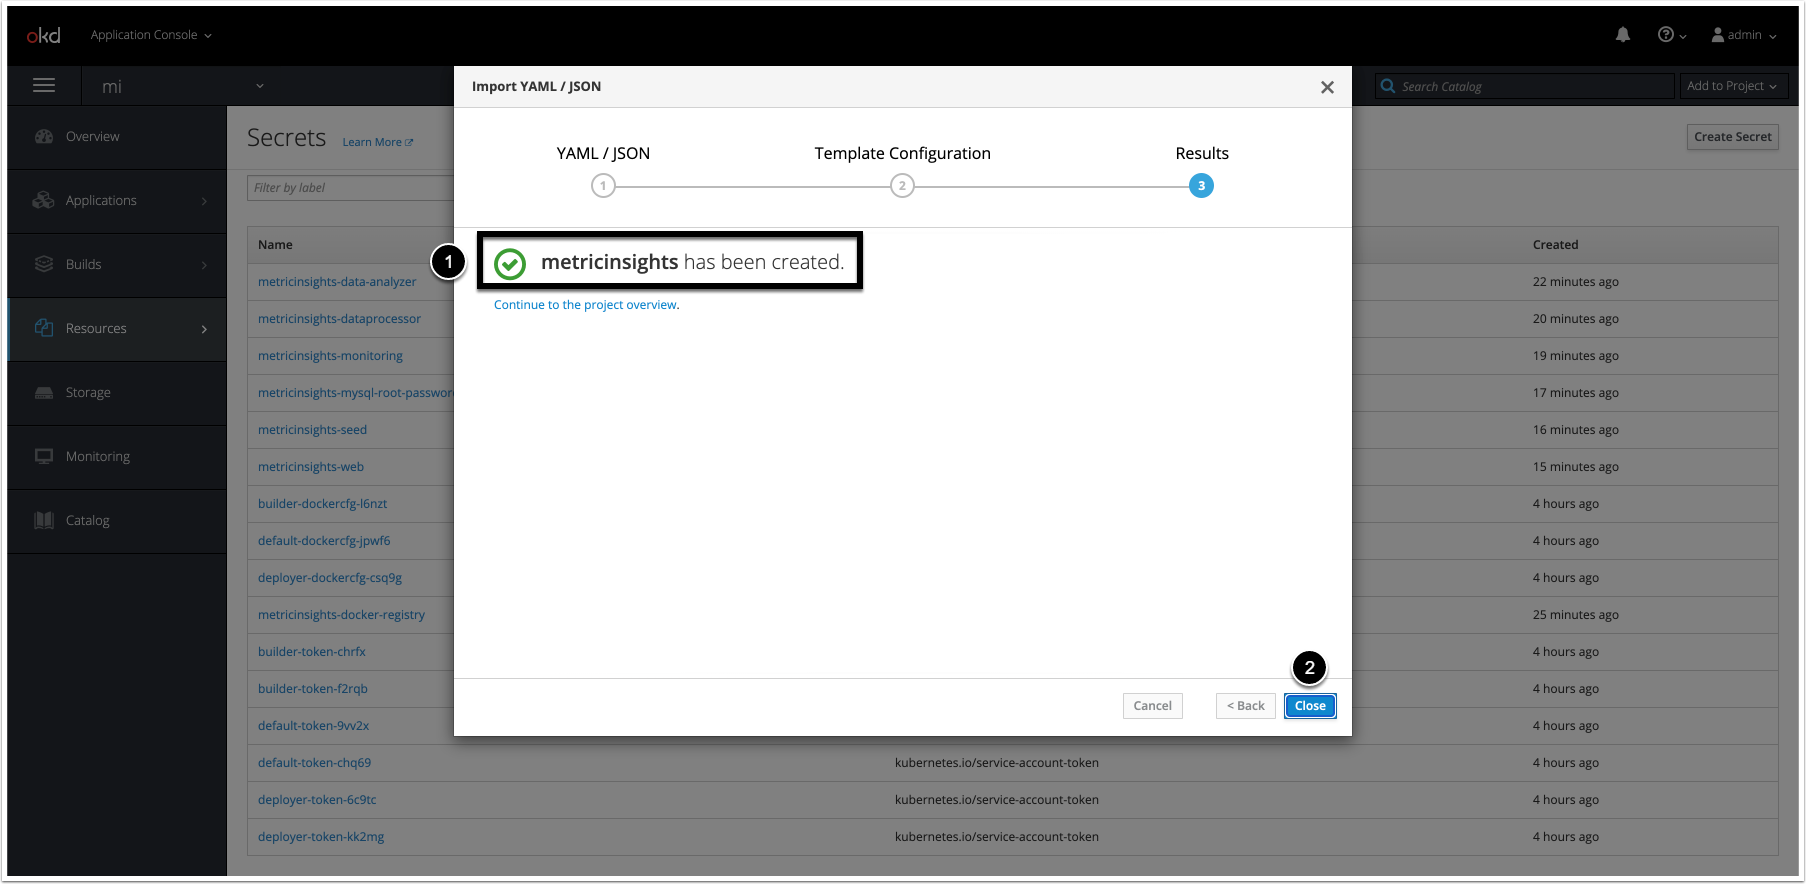
- The confirmation message must be visible.
- [Close]
To deploy the application, apply the deployment file:
oc --namespace <namespace> apply -f <deployment_file>.ymlNOTE: If <deployment_file>.yml is updated, run the following command to apply the changes:
$ oc process -f <deployment_file>.yml | oc apply -f -
service/metricinsights-web unchanged
deployment.apps/metricinsights-web-master unchanged
deployment.apps/metricinsights-web-slave unchanged
service/metricinsights-seed unchanged
deployment.apps/metricinsights-seed unchanged
service/metricinsights-dataprocessor unchanged
deployment.apps/metricinsights-dataprocessor unchanged
service/metricinsights-data-analyzer unchanged
deployment.apps/metricinsights-data-analyzer unchanged
service/metricinsights-monitoring unchanged
deployment.apps/metricinsights-monitoring unchanged
persistentvolume/metricinsights-default-data configured
persistentvolumeclaim/metricinsights-default-data unchanged
8. Check if the Application Has Been Deployed
To check if the application has been deployed, run oc get pods -n <namespace>.
9. Create Routes for the Web Service and the Monitoring Service
9.1. Access the Routes Creation Form
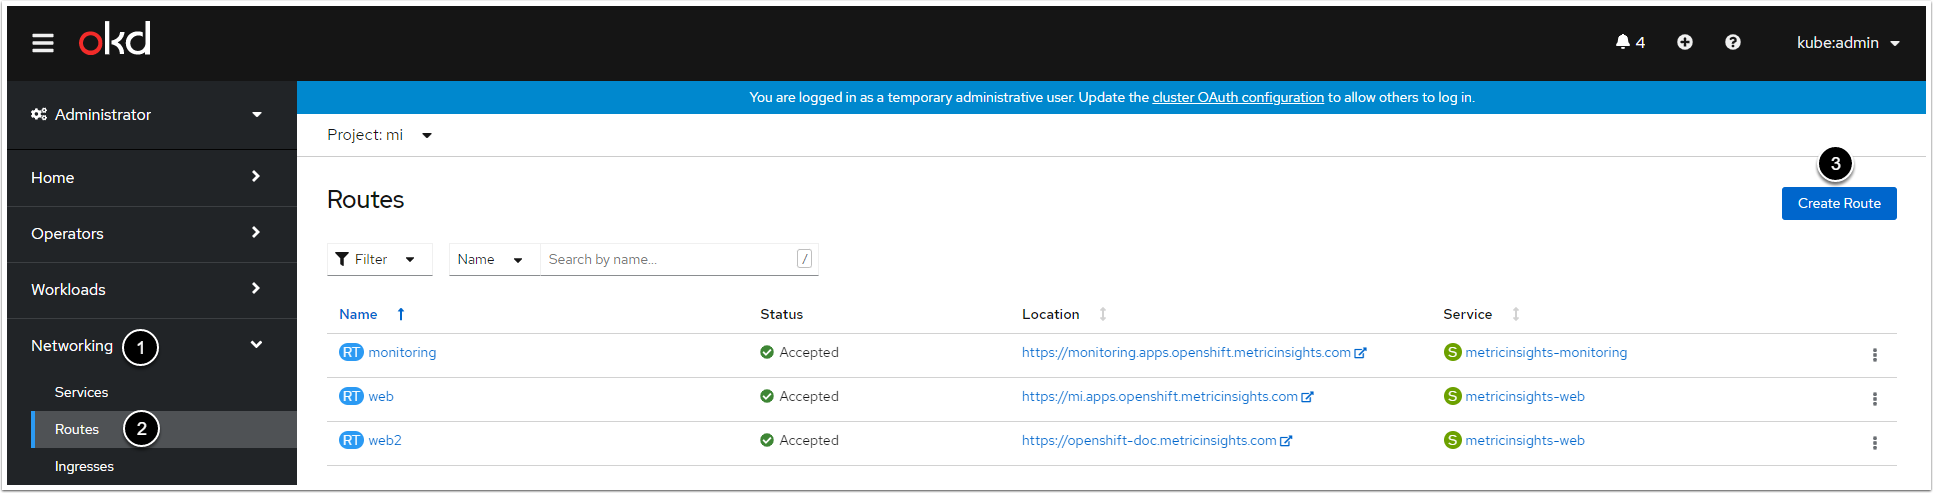
- Click Networking.
- Click Routes.
- [Create Route]
9.2. Fill in the Routes Creation Form
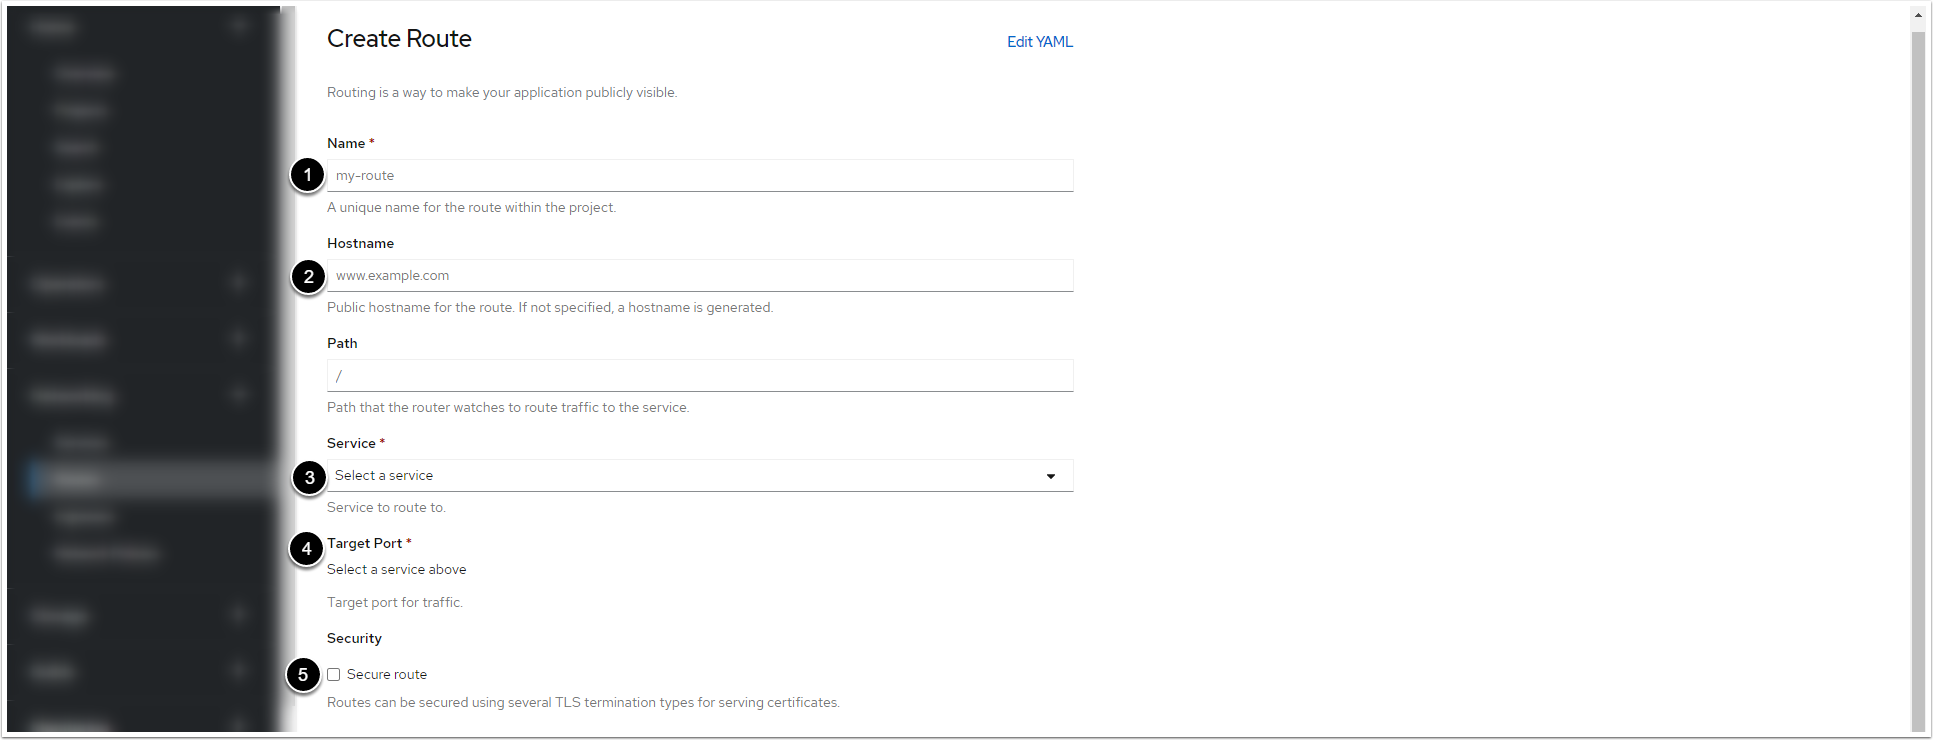
- Enter a name for the Web Service/the Monitoring Service within the project.
- Enter a hostname for the Web Service/the Monitoring Service within the project.
- Select the pod of the Web Service/the Monitoring Service from the drop-down list.
- After you select the pod, the drop-down list becomes active. For the Web Service, select "443 -> 443 (TCP)". For the Monitoring Service, select "8081 -> 8081 (TCP)".
- Activate the checkbox.
9.3. Apply the Valid Certificate and Private Key for the Web Service and the Monitoring Service
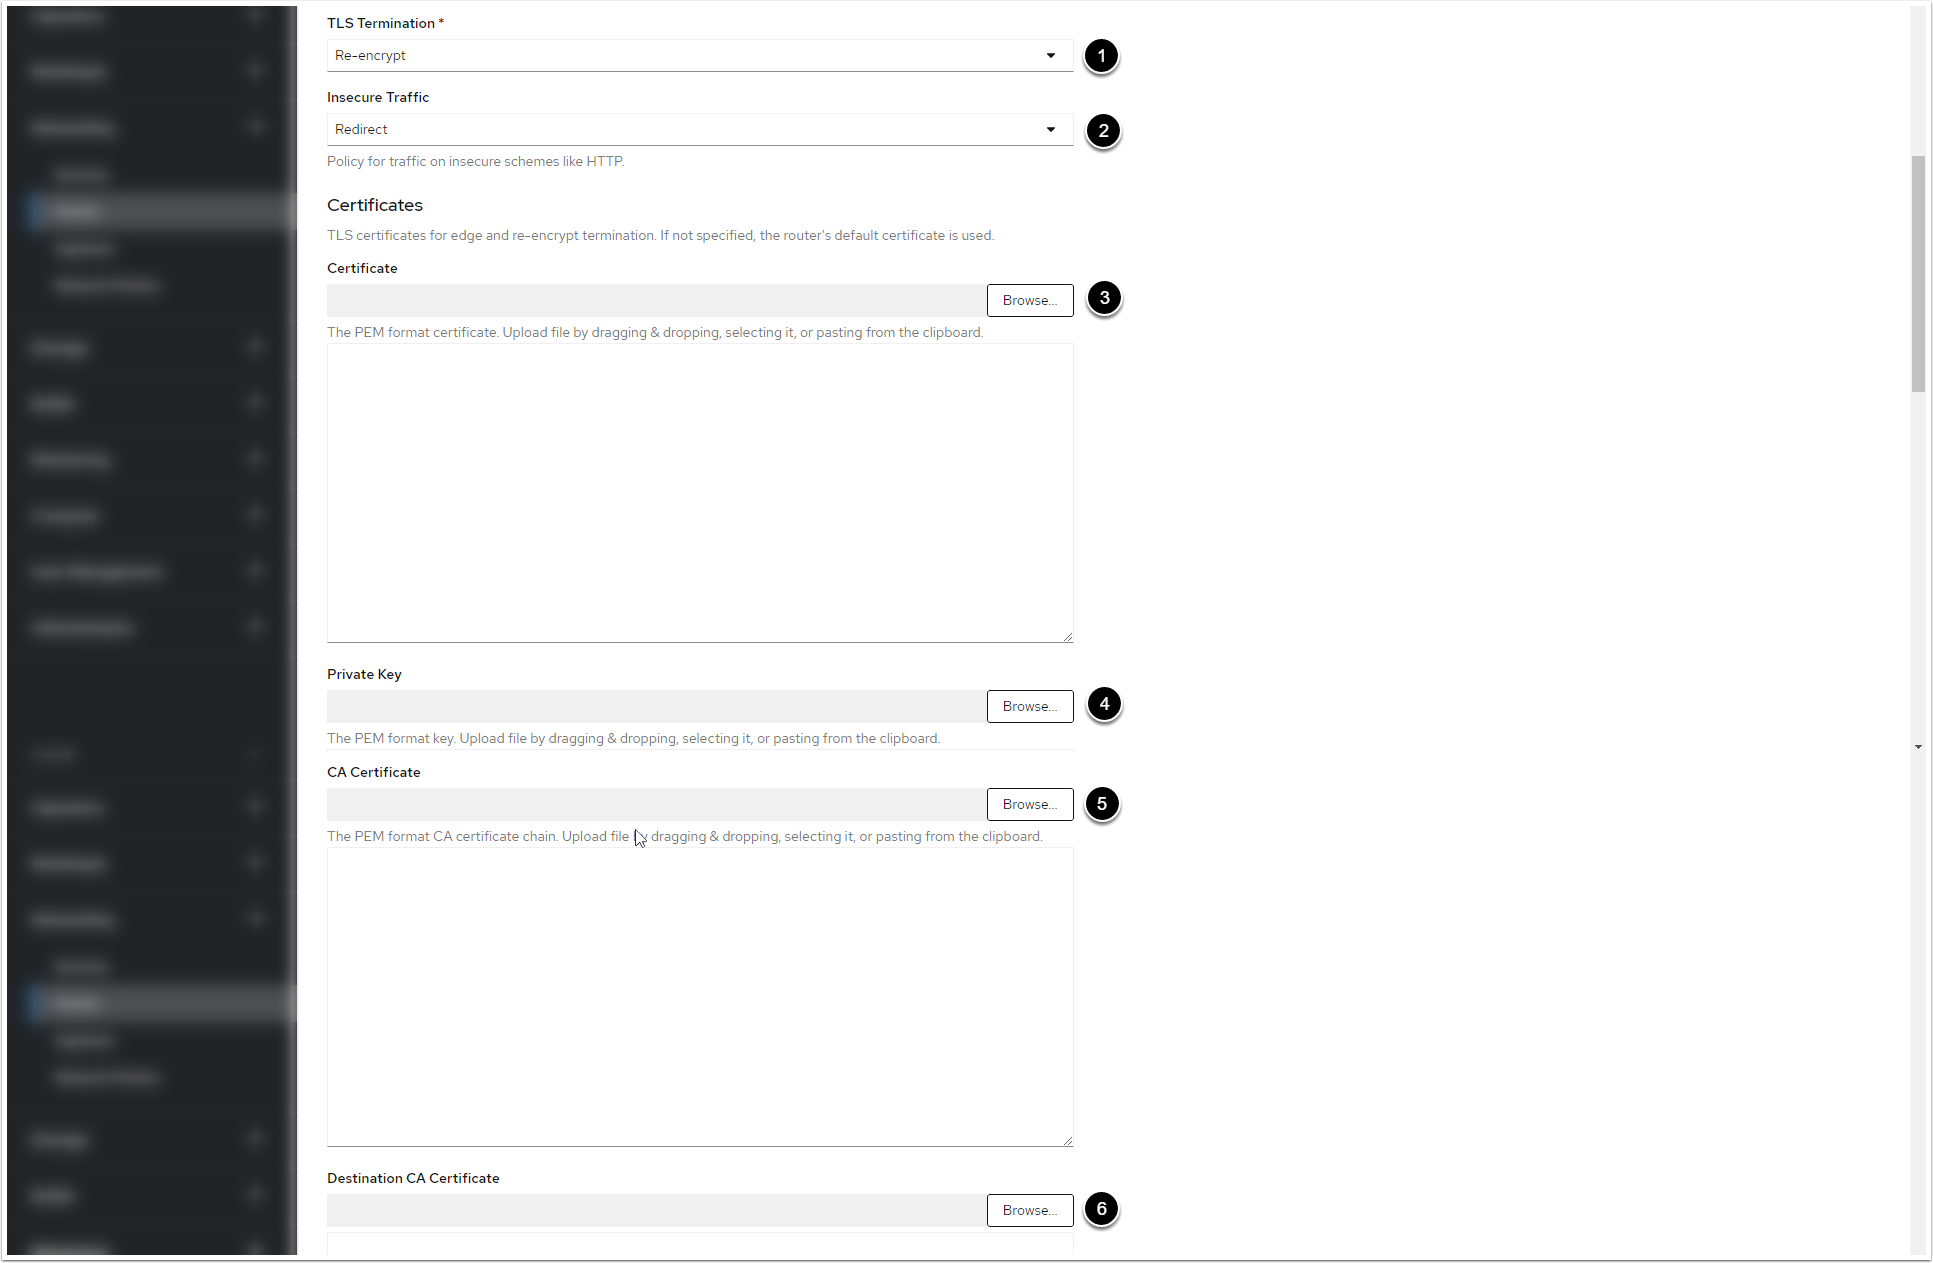
- Select "Re-encrypt" from TLS Termination drop-down list.
- Select "Redirect" from Insecure Traffic drop-down list.
- [Browse] to select the certificate in PEM format.
- [Browse] to select the Private Key.
- [Browse] to select the CA certificate.
- [Browse] to select
ca.crtcertificate. Retrieve the certificate from the web pod:/opt/mi/ssl/ca.crt.
9.4. Create and Check the Routes
Click [Create] at the bottom. To check the routes, open the Web Service and the Monitoring Service hostnames in a browser. You will see the login pages.
10. Basic Console Commands
Check basic console commands by running ./installer.py kubernetes --help.
The following utilities are available to use on the host.
NOTE: All of these tools become available only if the Web Component is installed.