Monitoring Service is a special process for displaying registered application services and resources usage statistics, collecting metrics from all application services, viewing event history, and providing the access to all application logs. The service supports downloading a selected log file or all logs in a single compressed file.
The document contains the information on how to access and login to the Monitoring Service UI for the following installation types:
A description of the Monitoring Service UI can be found in the corresponding section.
1. Simple Installation
1.1. Accessing the Monitoring Service UI
The Monitoring Service UI is available at https://<address>:8081/status. If there is a load balancer or a proxy server in front of the application server, then it is required that 8081 port be opened externally. If it is not possible, then you can connect to the Monitoring Service via the server address. If ssh connection is available, forward the Monitoring Service port to a local host; e.g.:
$ ssh -L 8081:127.0.0.1:8081 root@<address> -vv 1.2. Logging to the Monitoring Service UI
If you established custom credentials during the application installation, then use them to login. If not, by default, the credentials are the following:
Username: admin
Password: <some_auto_generated_value>At any time, the username and password can be changed using the following command:
--monitoring-username <custom_username> --monitoring-password <custom_password>If you do not remember the password, there are three ways to retrieve it:
Retrieve the password from /opt/mi/config/deployment/credentials/monitoring.env:
$ cat /opt/mi/config/deployment/credentials/monitoring.env | grep MONITORING_PASSWORD2MONITORING_PASSWORD=<password>Retrieve the password from the Web Service container:
$ mi-console
2Welcome to Metric Insights, v6.2.33
root@web:/opt/mi# env | grep
MONITORING_PASSWORD4MONITORING_PASSWORD=<password> Retrieve the password from the Monitoring Service container:
$ docker exec -it mi-monitoring-1 env | grep
MONITORING_PASSWORD2MONITORING_PASSWORD=<password> In this case, the Monitoring Service UI is available at https://127.0.0.1:8081/status.
2. Orchestration Installation
2.1. Docker Swarm
2.1.1. Accessing the Monitoring Service UI
The Monitoring Service is available at https://<swarm_master_node_address>:8081/status. If there is a load balancer or a proxy server in front of the Metric Insights application nodes, then the 8081 port must be opened externally. If it is not possible, then you can connect to the Monitoring Service via the address of Docker Swarm master node. If you can connect to Docker Swarm master node via ssh, then you can forward the Monitoring Service port to a local host; e.g.:
$ ssh -L 8081:127.0.0.1:8081 root@<swarm_master_node_address> -vvThe Monitoring Service UI is available at https://127.0.0.1:8081/status.
2.1.2. Logging to the Monitoring Service UI
The default username is admin. You can retrieve the password from monitoring.env file. Alternately, connect to Docker Swarm master node and run the command:
$ docker exec $(docker ps -q -f name=mi_monitoring) cat /var/run/secrets/monitoring.env | grep MONITORING_PASSWORD2.2. Kubernetes or OpenShift
2.2.1. Accessing the Monitoring Service UI
The Monitoring Service is available at https://<dns>/status.
2.2.2. Logging to the Monitoring Service UI
The default username is admin. There are four ways to retrieve the password:
You can find the password in the initial deployment file monitoring.env.
Connect to Kubernetes Master Node and retrieve the password from the web-master pod:
$ kubectl exec -n mi -it $(kubectl get pod -n mi -l name=<name> -o jsonpath='{.items[0].metadata.name}') -- cat /opt/mi/config/insight.conf | grep -A 4 monitoring

[monitoring]
server = https://metricinsights-monitoring
port = 8081
username = <username>
password = <password> The credentials for the Monitoring Service UI are stored as secrets ,and you can decrypt them from the Kubernetes secret. It is required to have the access to Kubernetes or OpenShift via ssh or kubectl. To retrieve the username and password, run the command:
$ kubectl get secret -n <namespace> metricinsights-monitoring -o go-template='{{range $k,$v := .data}}{{printf "%s: " $k}}{{if not $v}}{{$v}}{{else}}{{$v | base64decode}}{{end}}{{"\n"}}{{end}}'
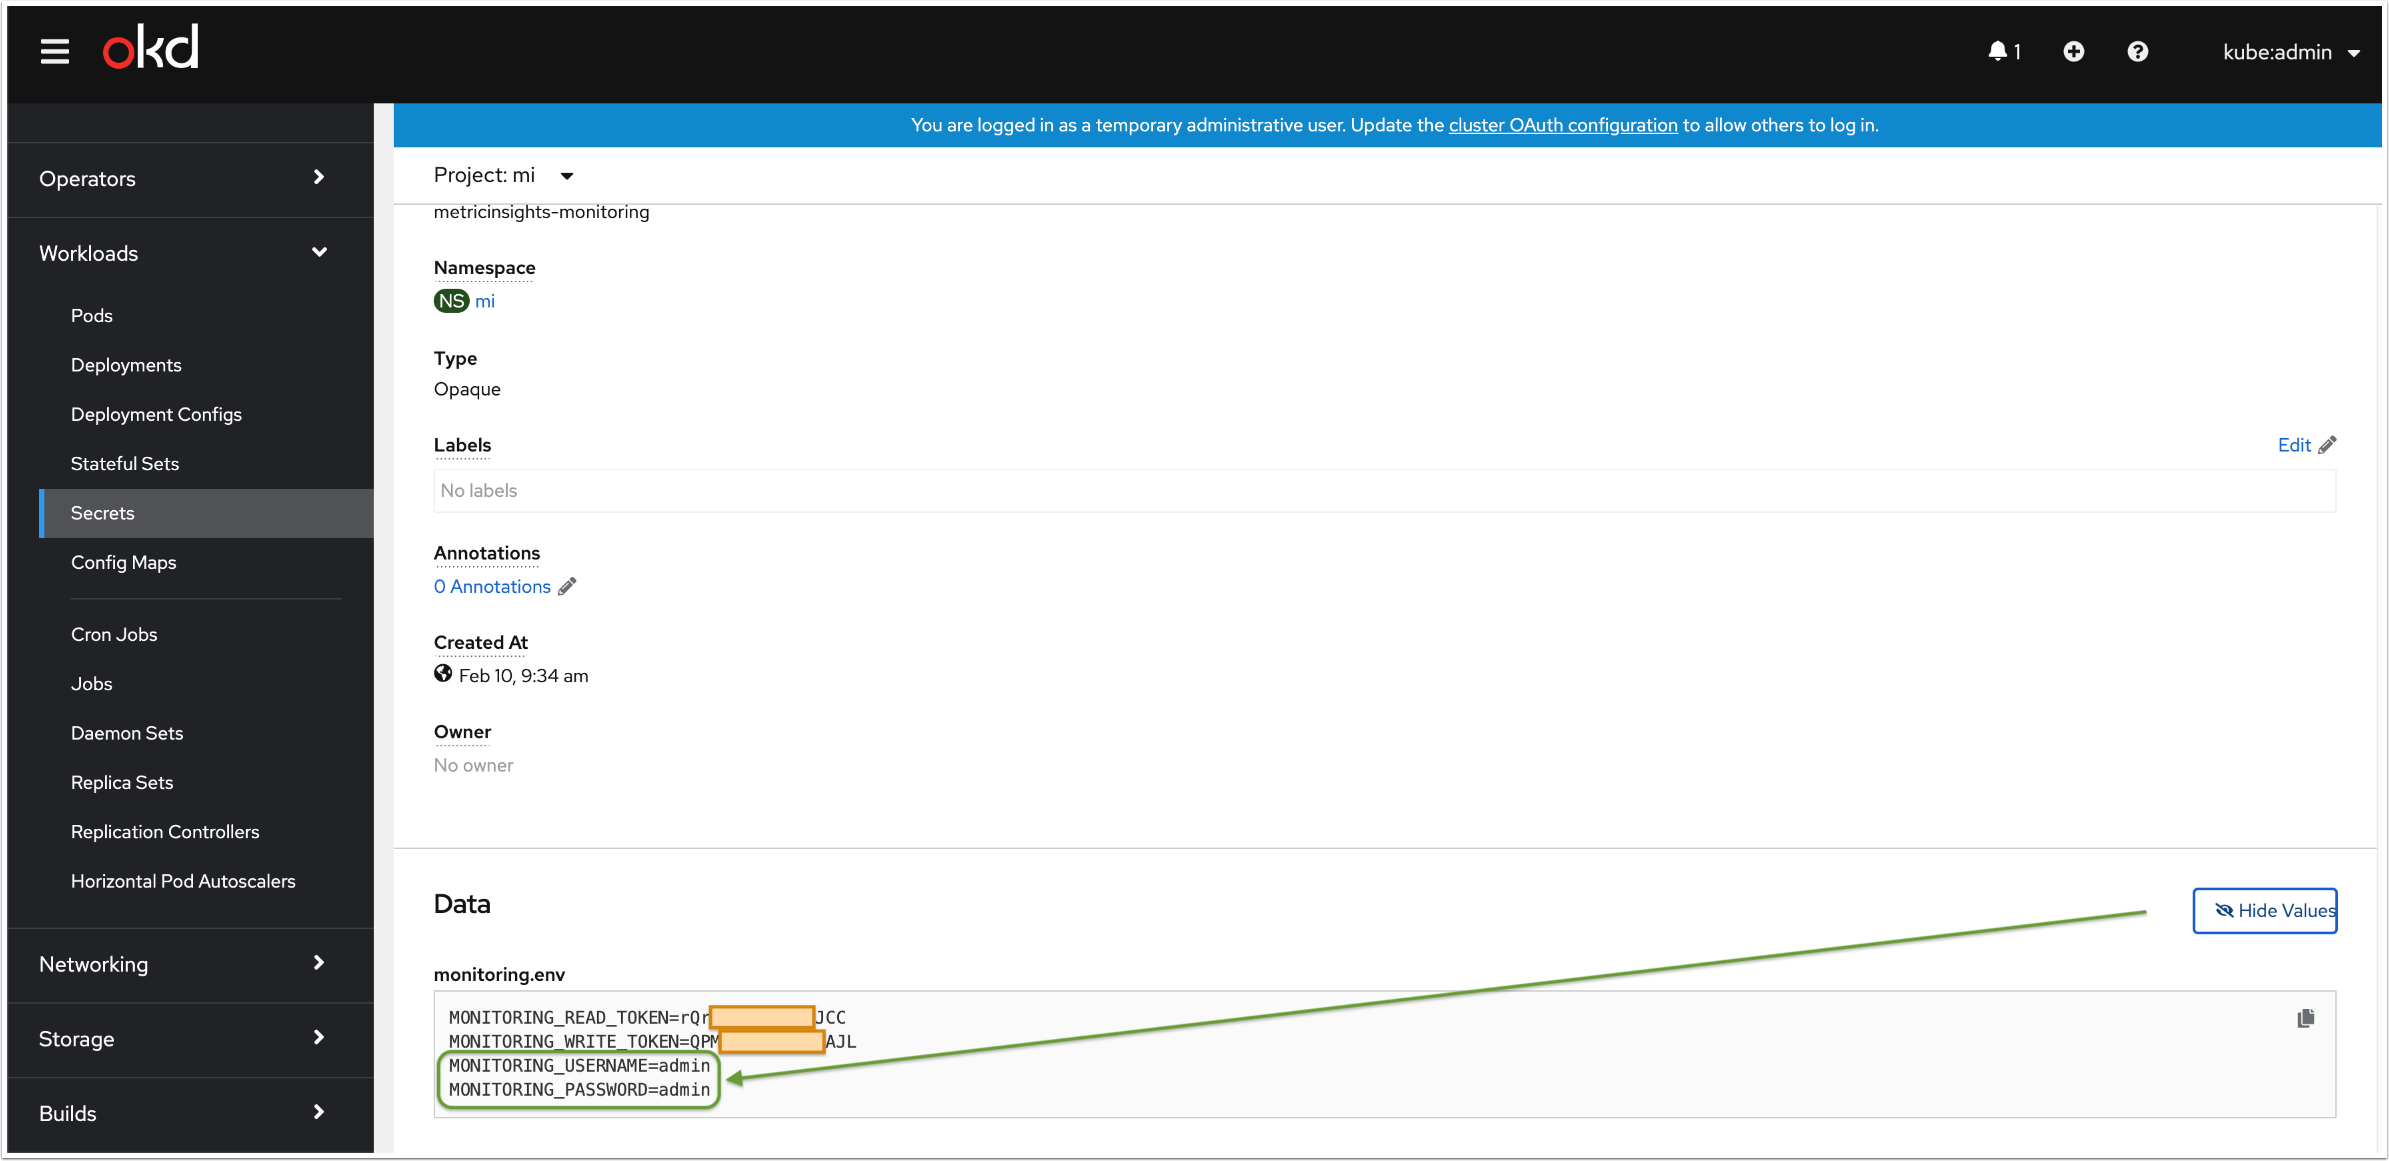
monitoring.env: MONITORING_READ_TOKEN=<read_token>
MONITORING_WRITE_TOKEN=<write_token>
MONITORING_USERNAME=<username>
MONITORING_PASSWORD=<password>2.2.2.4.1. Access "metricinsights-monitoring" secret
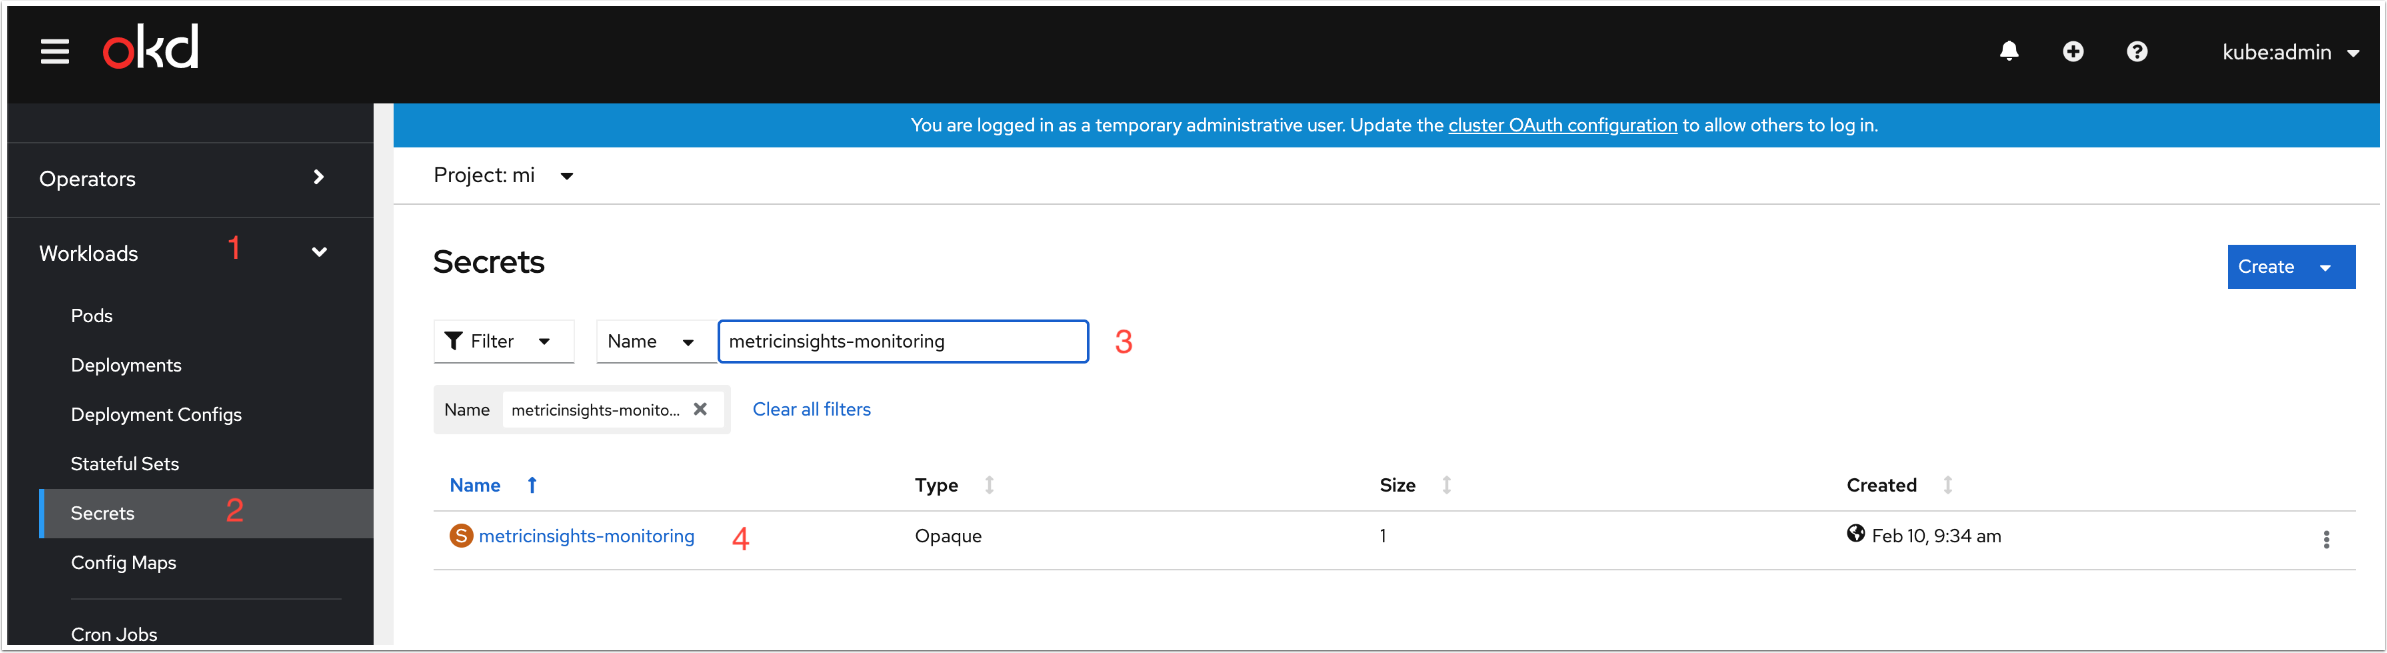
- In the OpenShift Container Platform console, click Workloads
- Click Secrets
- Enter "metricinsights-monitoring" to the search field
- Click "metricinsights-monitoring"
Access the metricinsights-monitoring secret
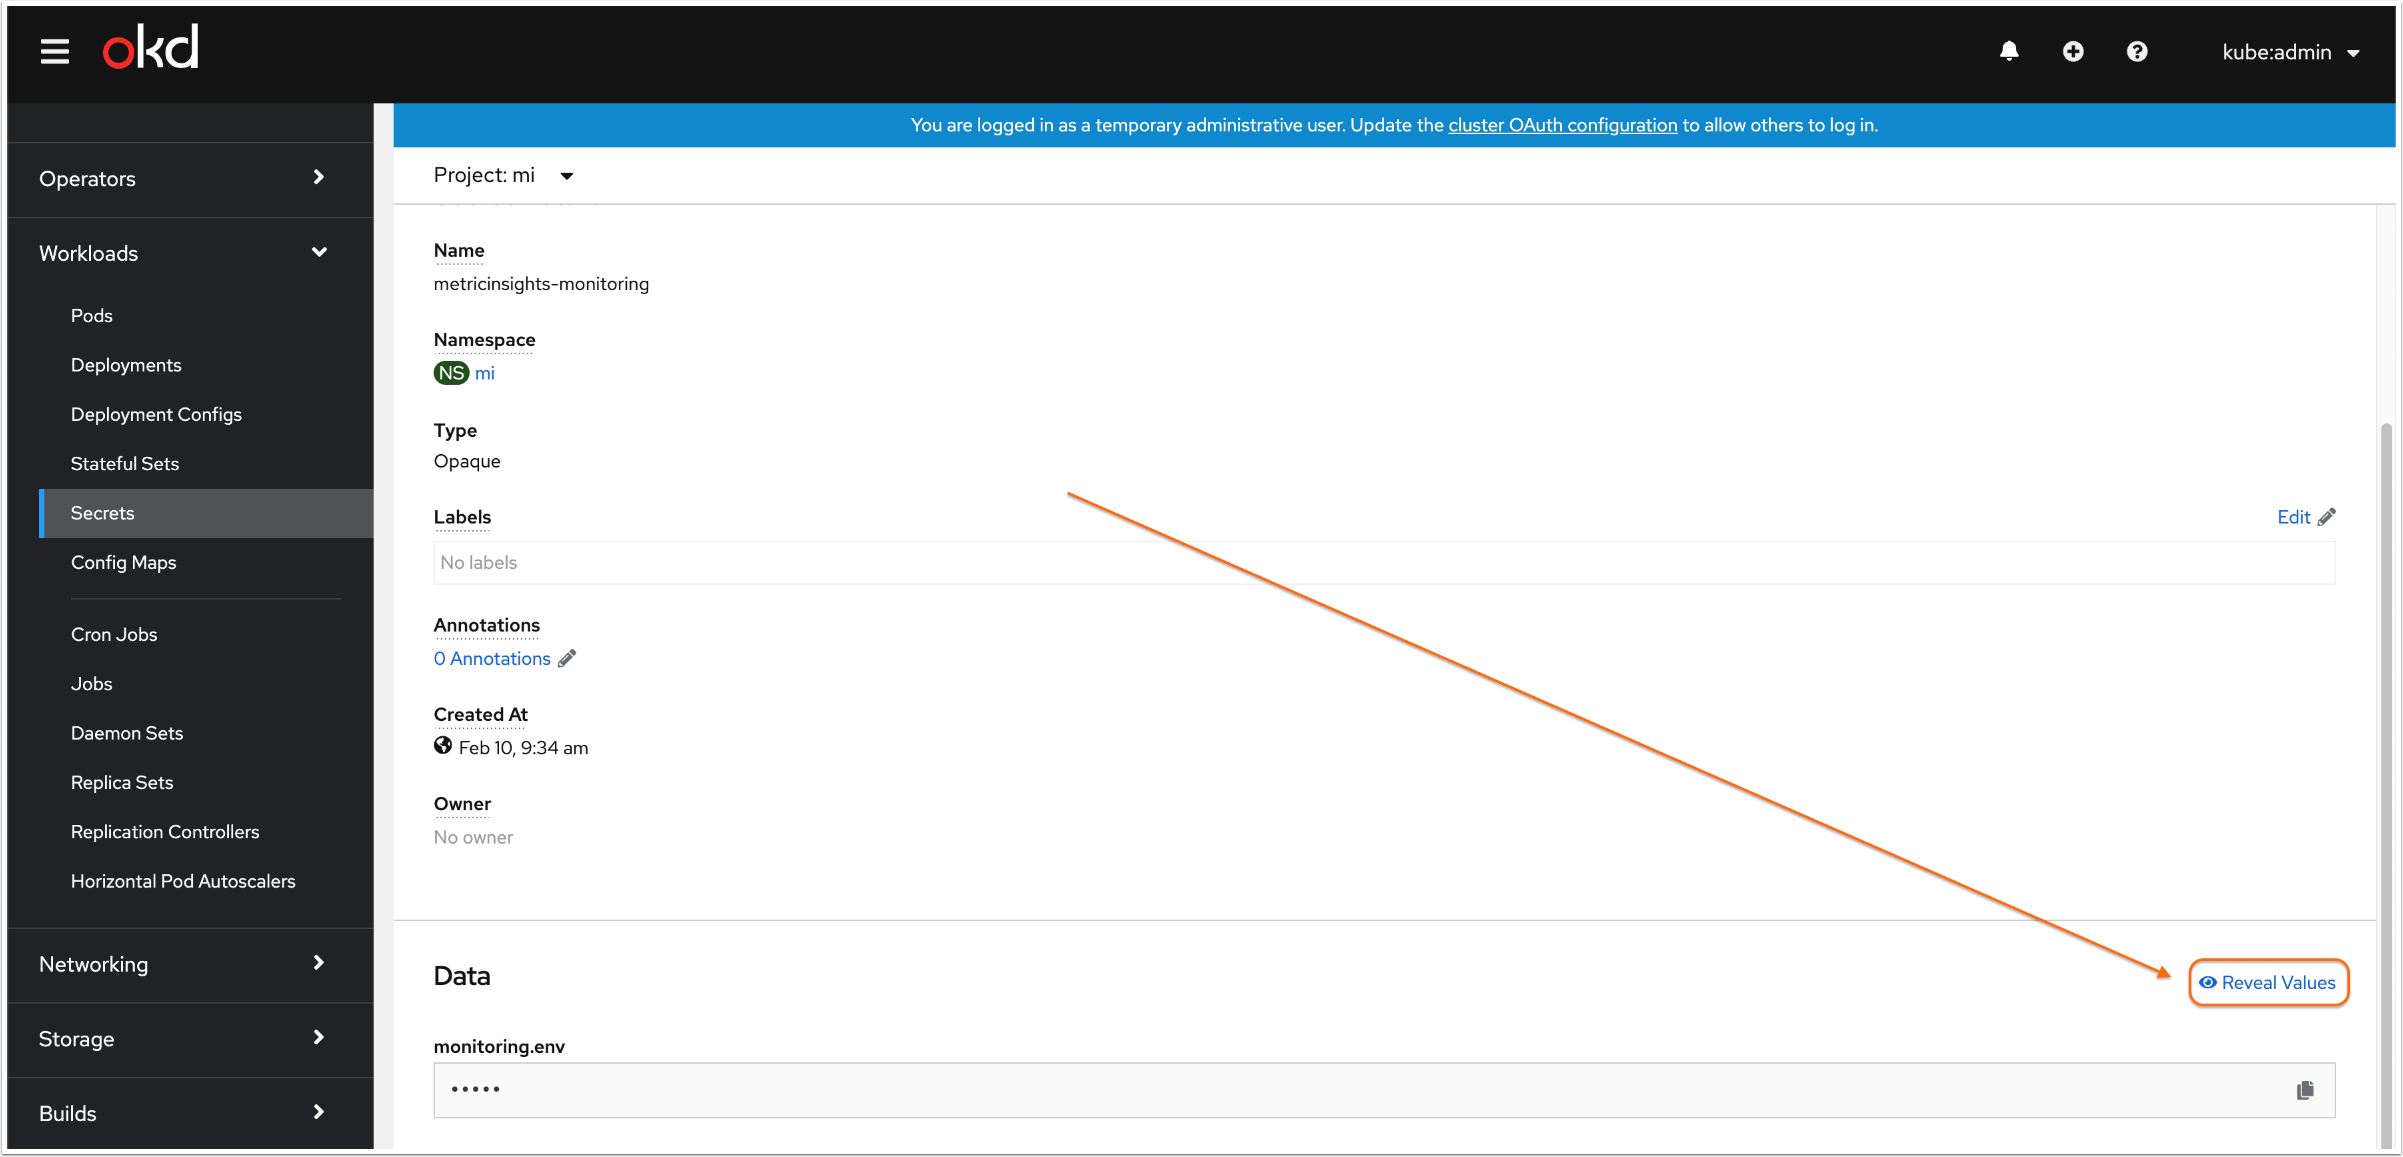
2.2.2.4.2. Retrieve the credentials
Click [Reveal Values]:
You will see the username and password:
2.3. AWS ECS
2.3.1. Accessing the Monitoring Service UI
The Monitoring Service is available at https://<load_balancer_dns>:8081/status or at https://<dns>:8081/status if a DNS points to <load_balancer_dns>.
2.3.2. Logging to the Monitoring Service UI
If the application is deployed by Terraform, retrieve the credentials from variables.tf file, in monitoring_username and monitoring_password variables.
In case the application is deployed by the CloudFormation, the credentials are set during the creation of the CloudFormation stack. You can retrieve the username and password using either:
2.3.2.1.1. Access Secrets Manager
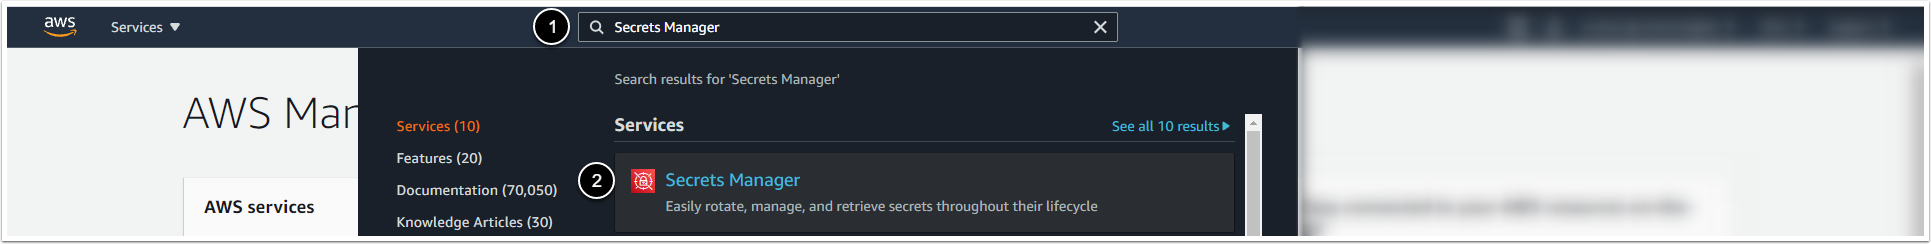
- In AWS Management Console, enter Secrets Manager in the search field
- Click Secrets Manager
2.3.2.2. Retrieve the Secret Value
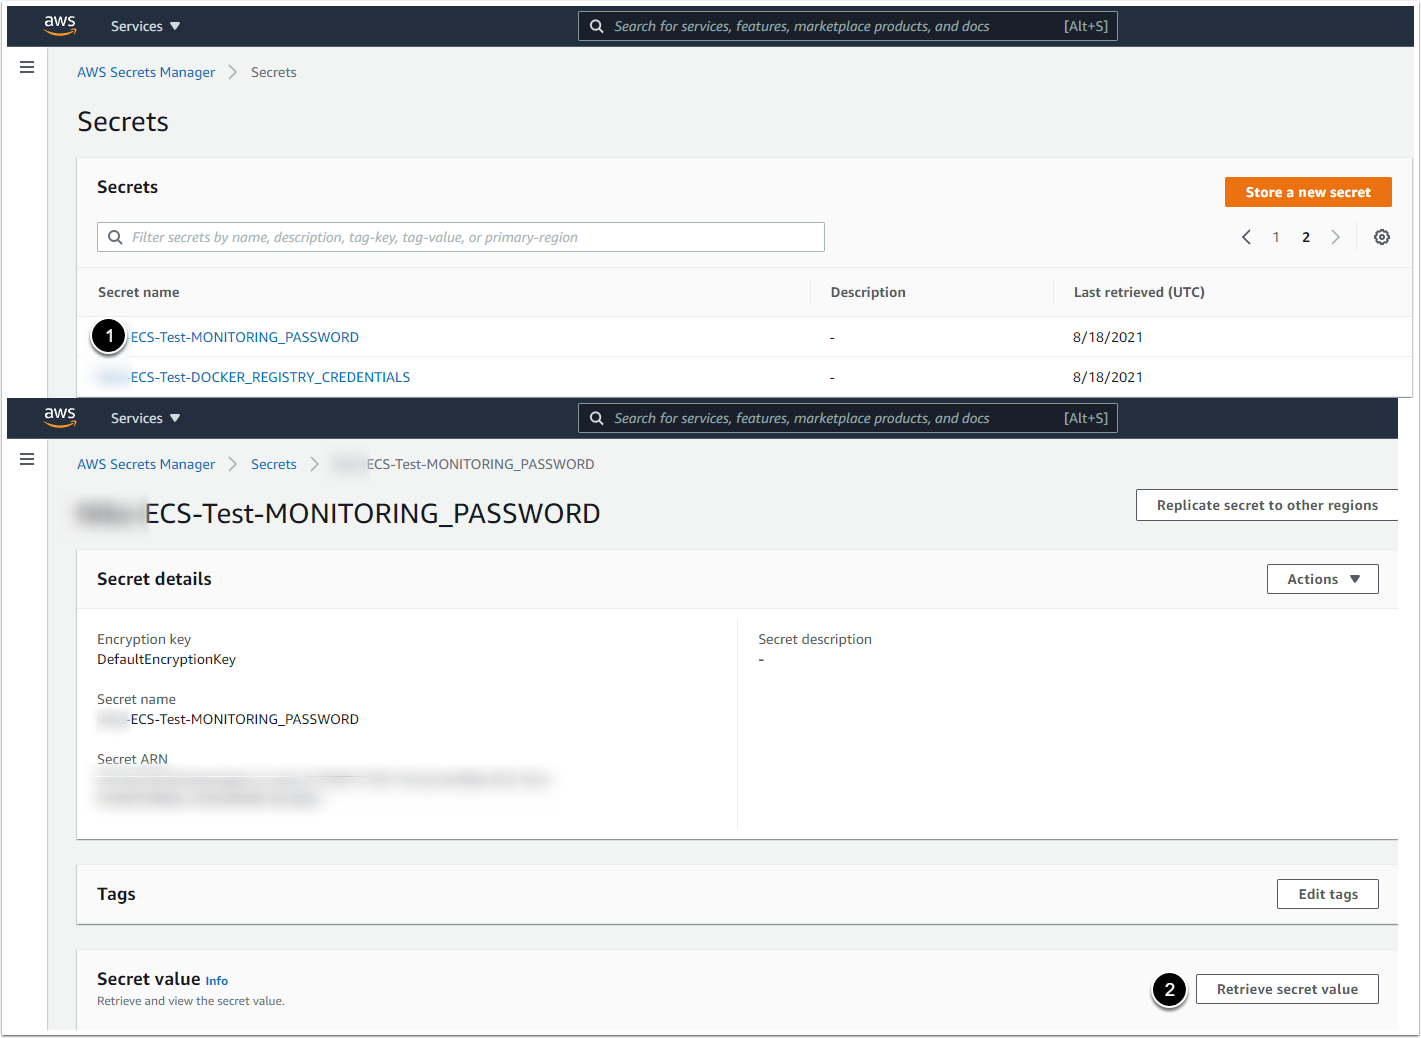
- Click ECS-Test-MONITORING_PASSWORD
- [Retrieve secret value]
1. Connect to the AWS ECS worker node via ssh.
2. Identify required container name:
$ docker ps3. To retrieve the credentials, run the commands with web or monitoring container:
$ docker exec -it <container_name> env | grep MONITORING_USERNAME
$ docker exec -it <container_name> env | grep MONITORING_PASSWORD2.4. The Monitoring Service UI
The monitoring data is stored in Docker container memory. If the Monitoring container is restarted, all stored data is erased!
After login, the following information is available:
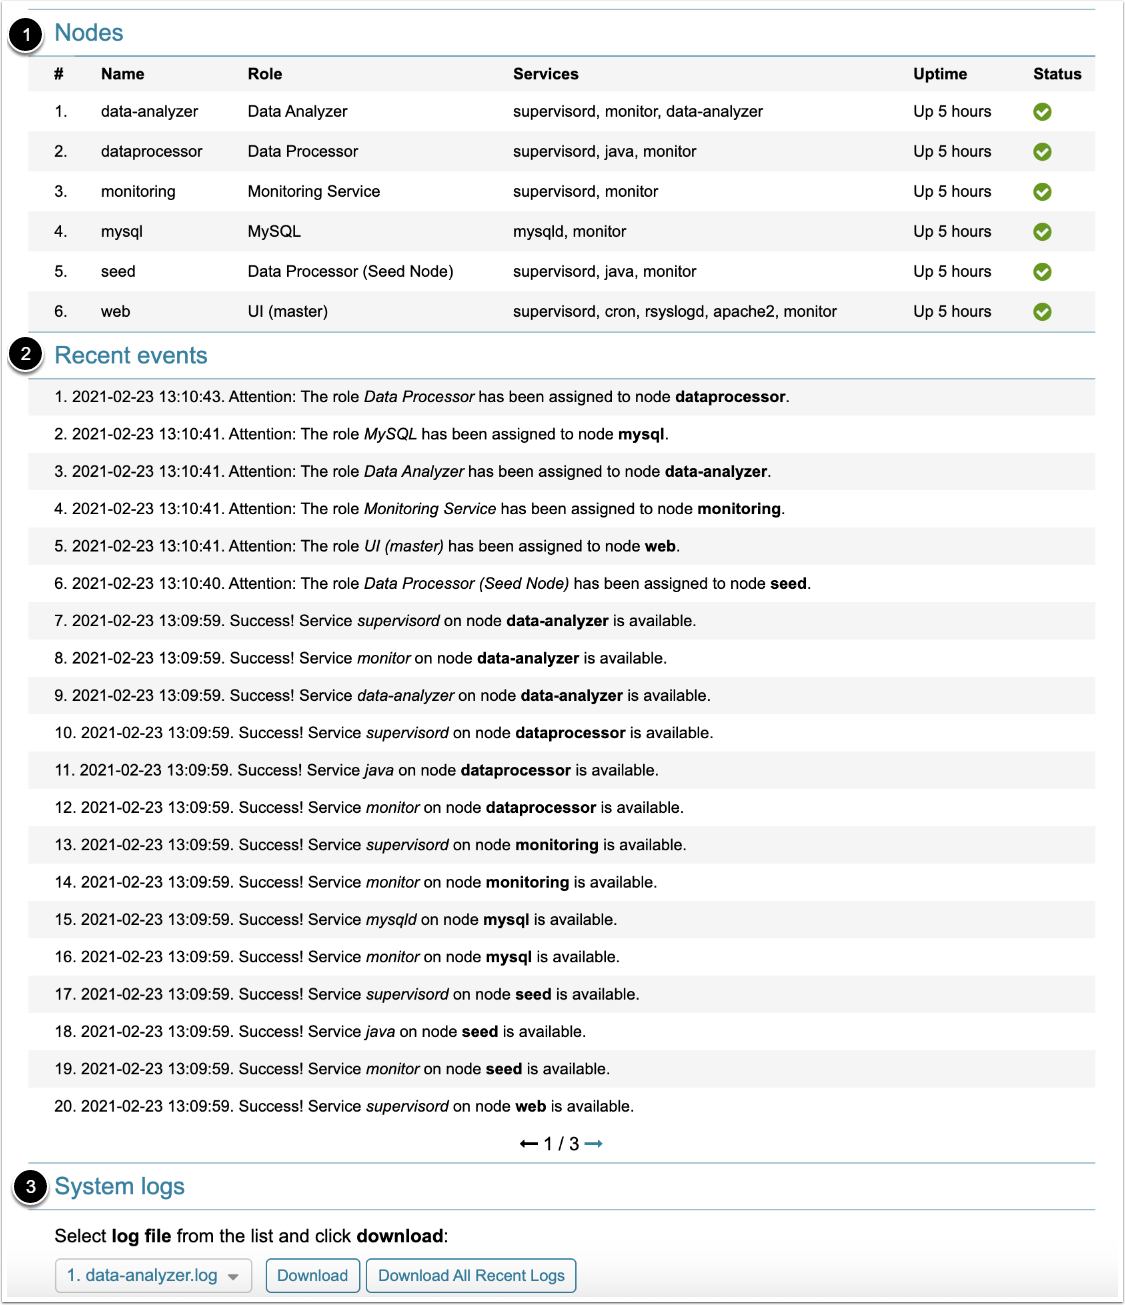
- Nodes: displays registered application services with uptime and status information
- Recent events: displays recent events with registered application services
- System logs: provides the functionality to download a selected log file or all logs in a single compressed file
If you click any node, you can see more detailed information about it, e.g.:
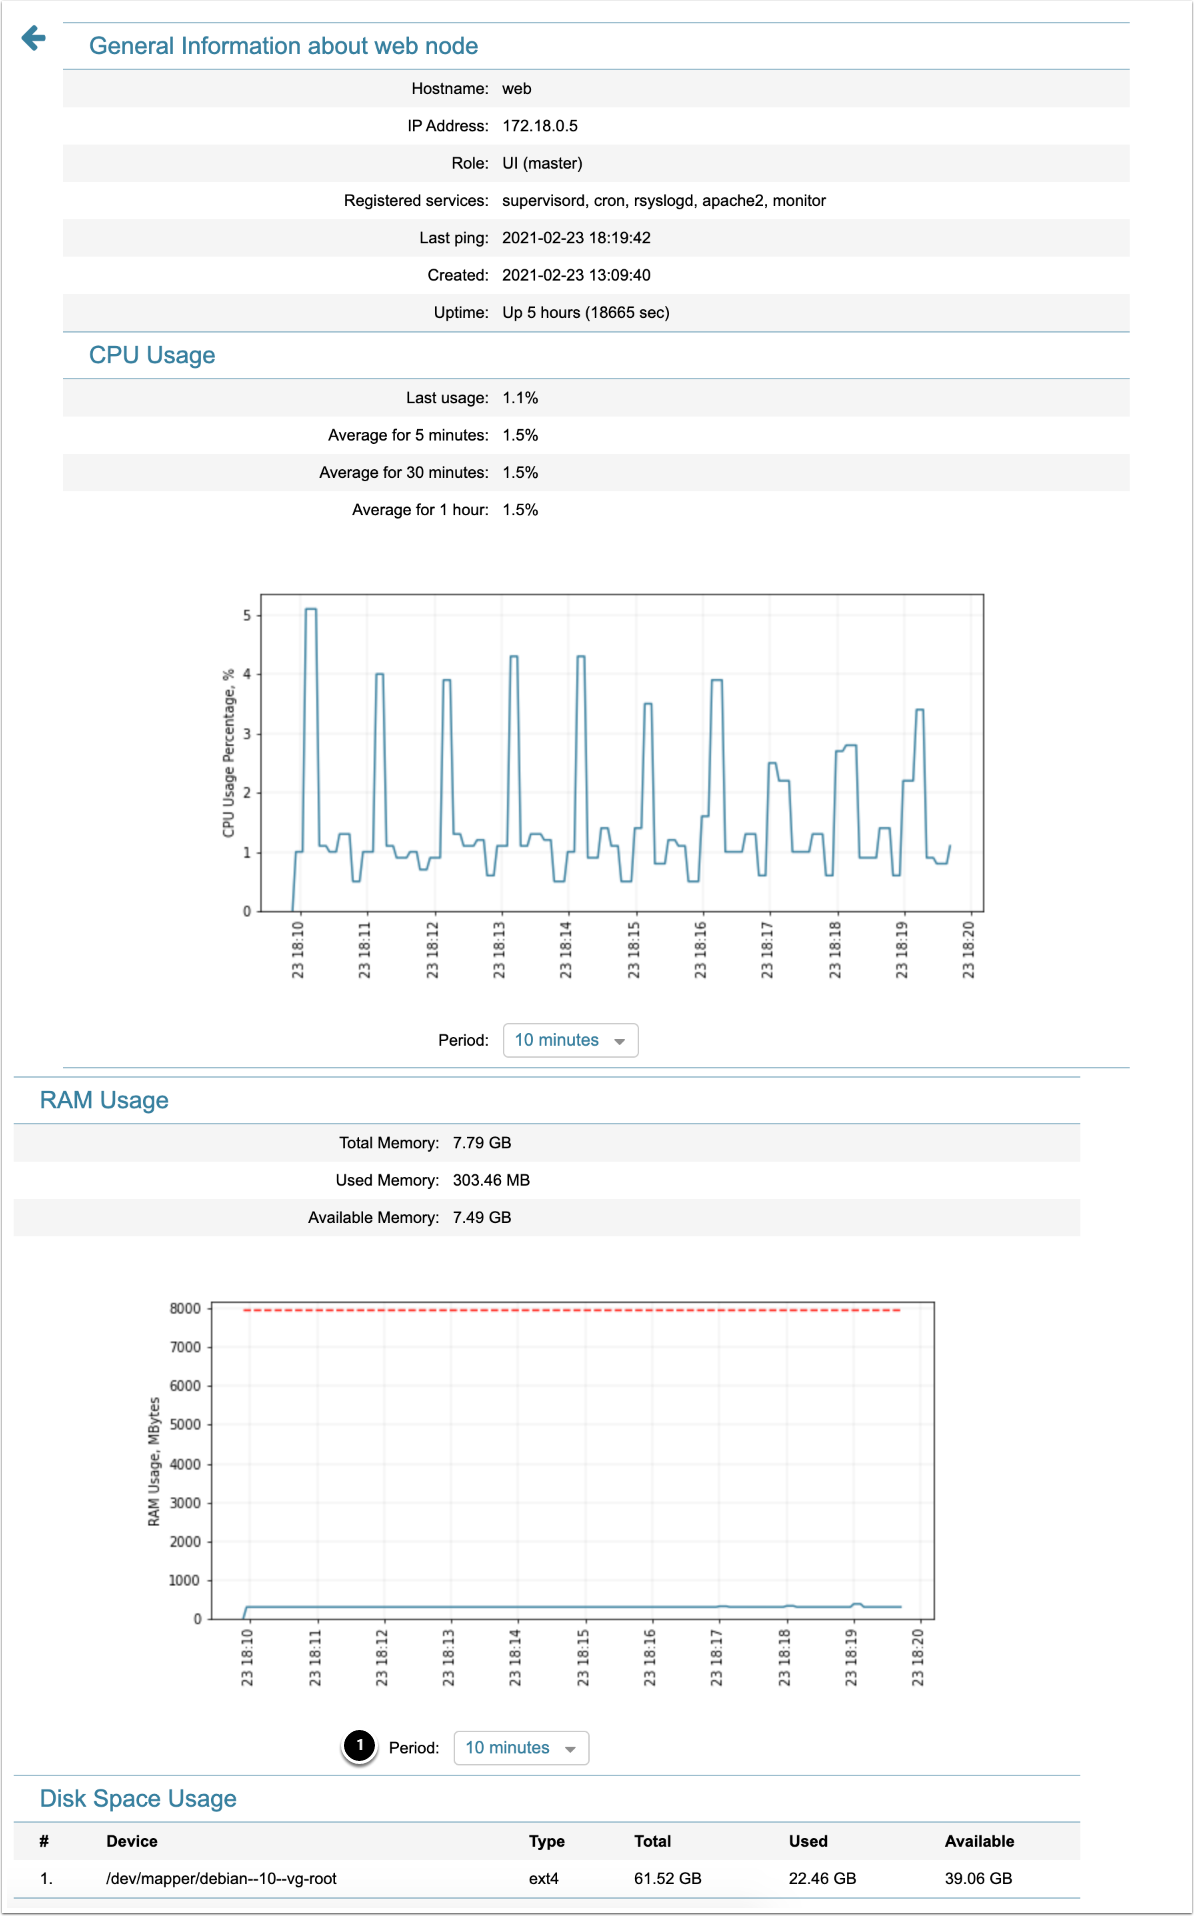
- The time period for data, displayed on the chart, can be customized. "Period" drop-down menu suggests the following options: 10 minutes, 30 minutes, 1 hour, 12 hours, One day.