NOTE: Beginning in v7.2.0, OpenTelemetry is supported by more Metric Insights application services, see Send OpenTelemetry Traces to Azure Monitor (v7.2.0+) for details.
Beginning in v7.1.1, the Metric Insights platform can be configured to export application performance telemetry to external monitoring systems using OpenTelemetry. This optional integration allows you to monitor the Metric Insights application in an APM tool of your choice. This article describes how to enable this feature using Splunk Observability Cloud (formerly SignalFx) as an example.
To configure the OpenTelemetry integration, you will need to obtain a pre-configured web Docker image from Metric Insights Support, copy Splunk Ingest Token, Endpoint and Realm values, and update the environment variables of the web service with those values.
NOTES:
- This integration requires a Metric Insights
webcontainer that has the OpenTelemetry libraries installed. Contact support@metricinsights.com to obtain awebDocker image with OpenTelemetry enabled for your version. - Currently, only the Metric Insights
webservice is instrumented for OpenTelemetry. - The example below uses Splunk Observability Cloud, but you can adapt the configuration for any OpenTelemetry-compatible backend.
Table of contents:
1. Prepare Splunk Observability Cloud for Data Ingest
1.1. Access Splunk Observability Cloud
Access https://www.splunk.com/
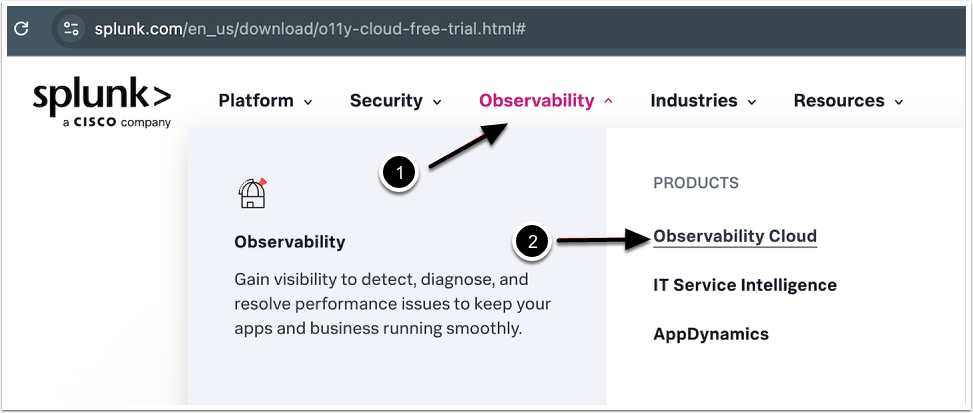
- Access Observability
- Access Observability Cloud
NOTE: If you don’t already have one, create a Splunk Observability Cloud account (a free trial can be obtained via Splunk’s website). Once logged in to the Splunk Observability portal, ensure you have appropriate admin rights to create tokens.
1.2. Create an Ingest Token
1.2.1. Access Settings
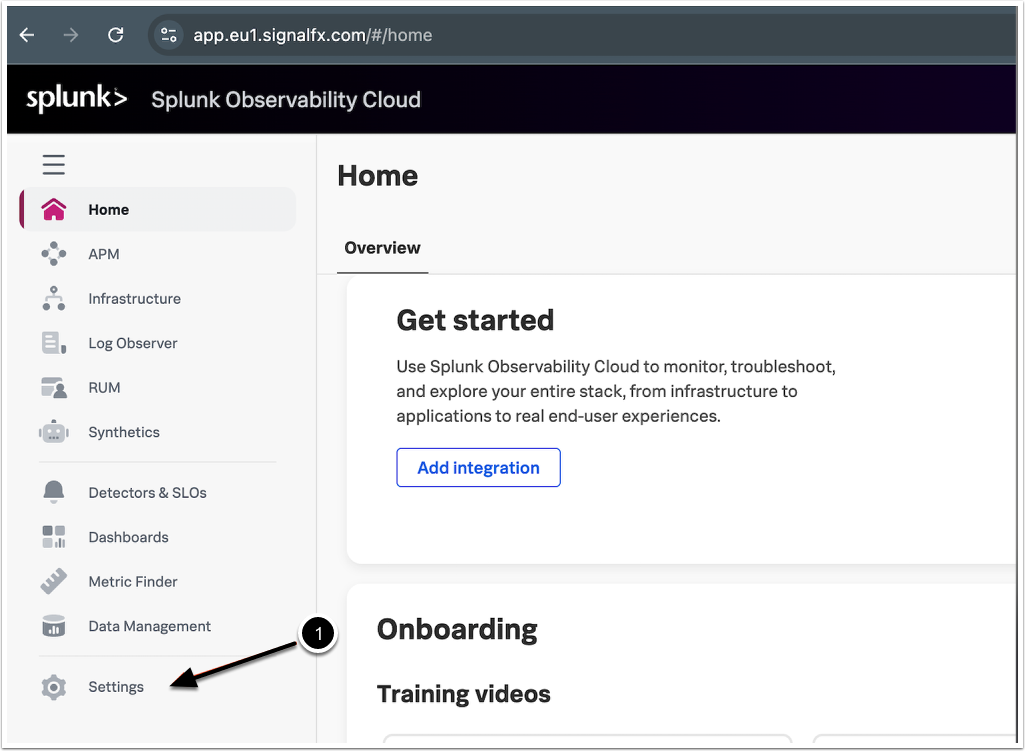
- Access Settings
1.2.2. Create New Token
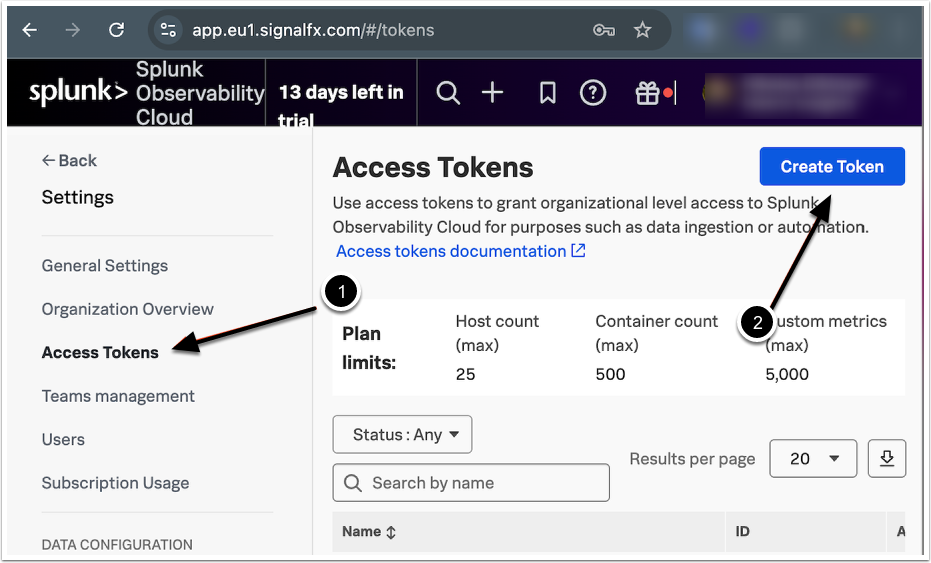
- Access Access Tokens
- [Create Token]
1.2.3. Enter Token Details
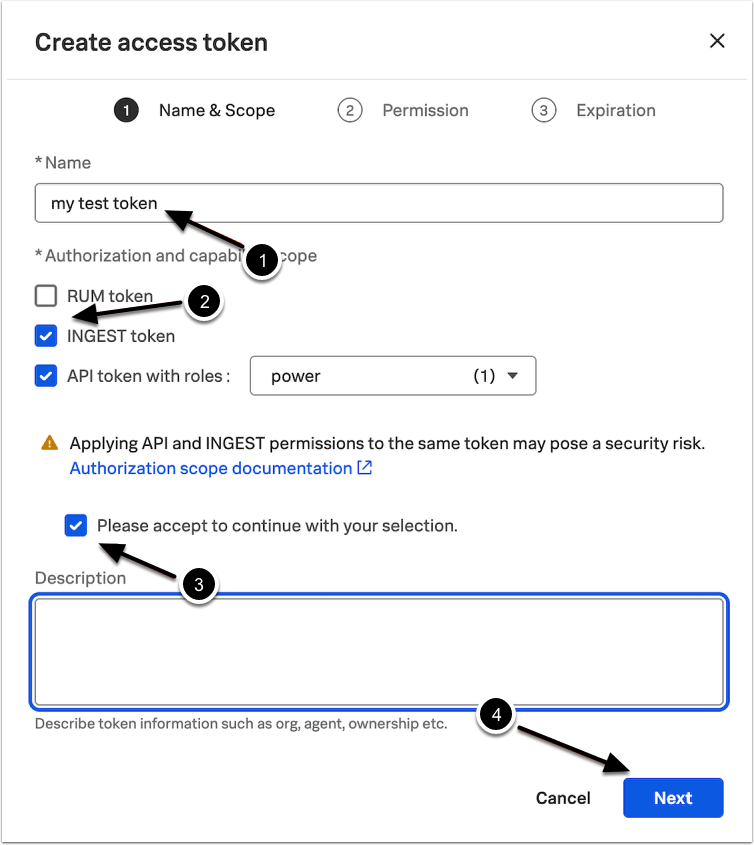
- Enter Token Name
- Activate the INGEST token checkbox
- This grants permission to send metric and trace data
- Activate the Please accept to continue with your selection checkbox
- [Next]
1.2.4. Proceed with Token Creation
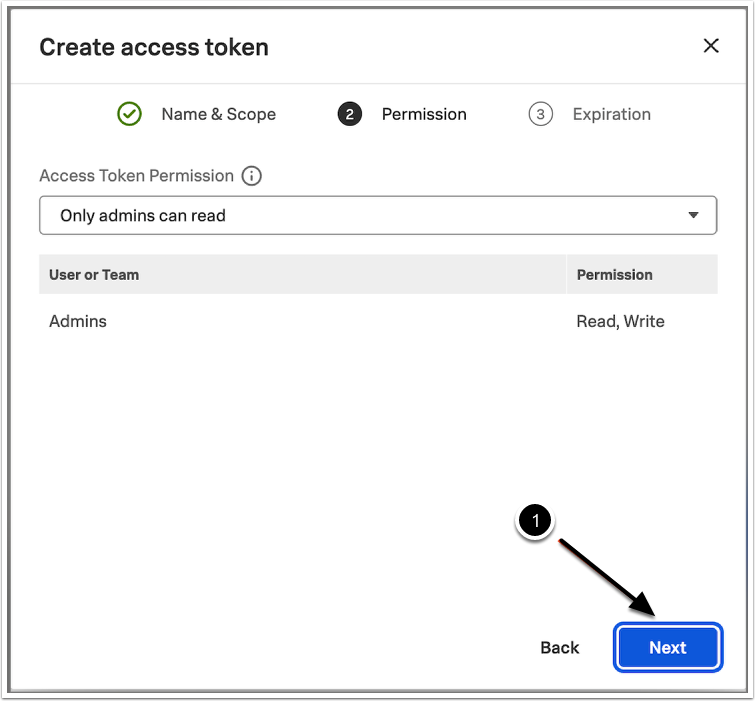
- Accept the defaults, [Next]
1.2.5. Set Expiration Date
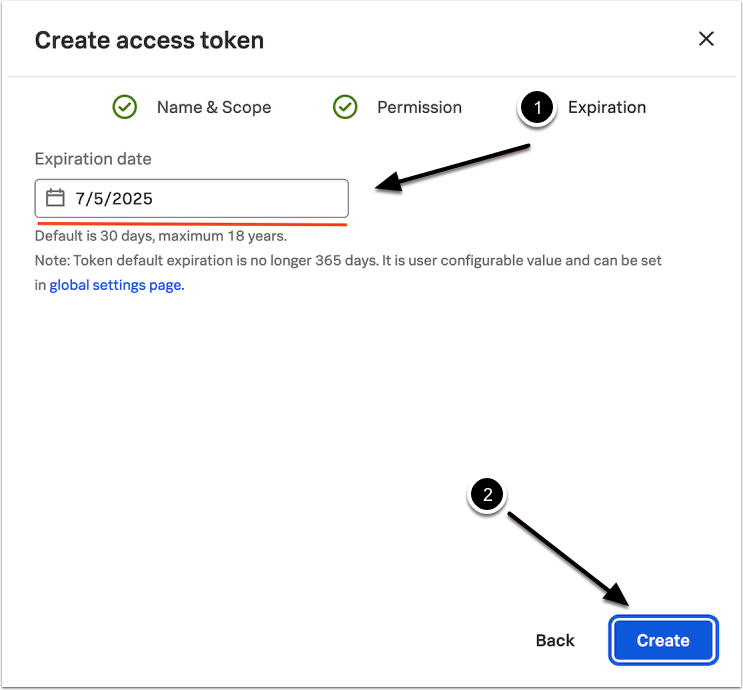
- Set Token Expiration date
- [Create]
1.3. Copy Token Value
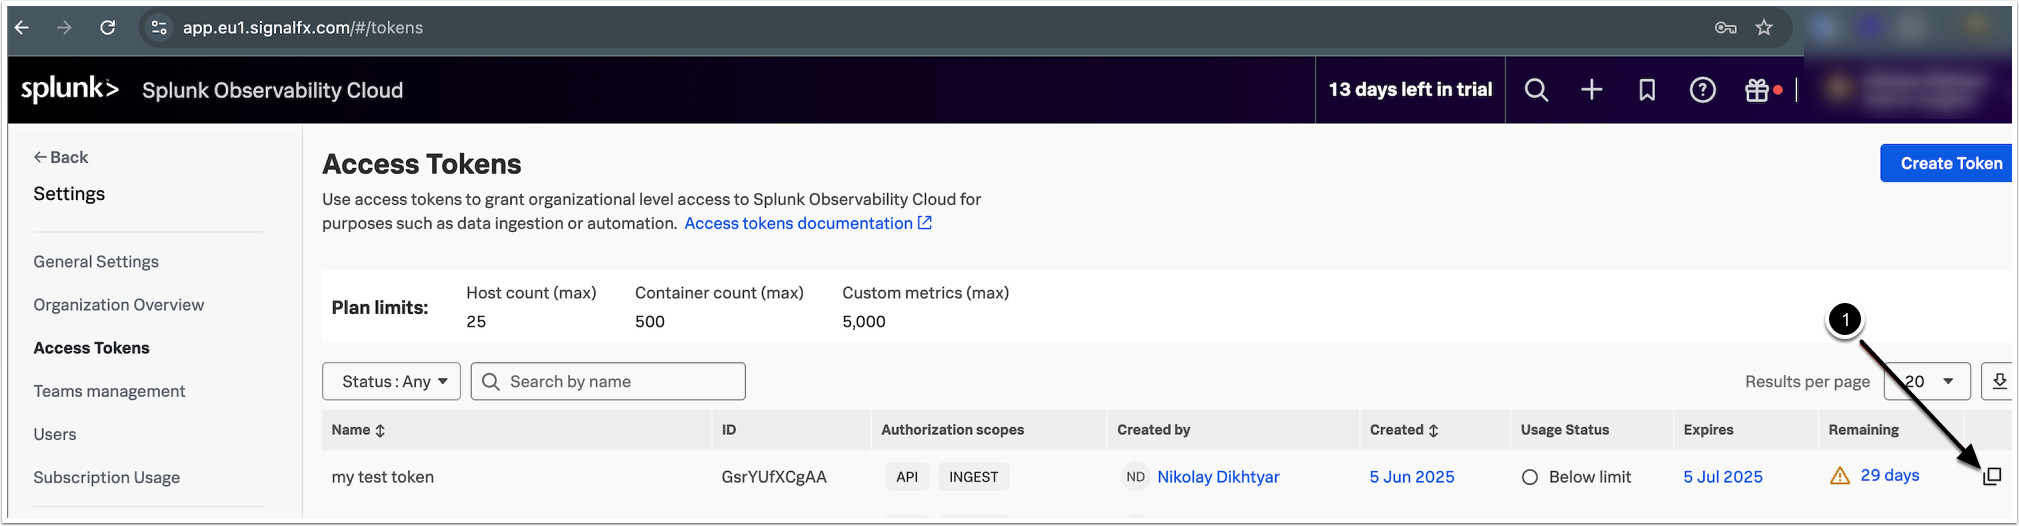
- Copy the Token value, it is required for the
OTEL_EXPORTER_OTLP_HEADERSenvironment variable- The Splunk ingest token corresponds to the OpenTelemetry header for authentication
1.4. Copy Real-Time Data Ingest Endpoint
1.4.1. Access My Profile
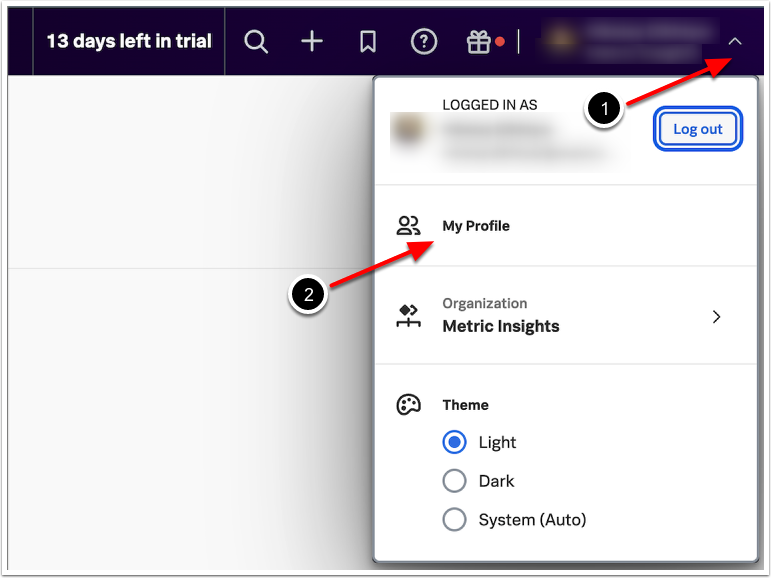
- Open the User menu at the top-right of the page
- [My Profile]
1.4.2. Copy Endpoint Value
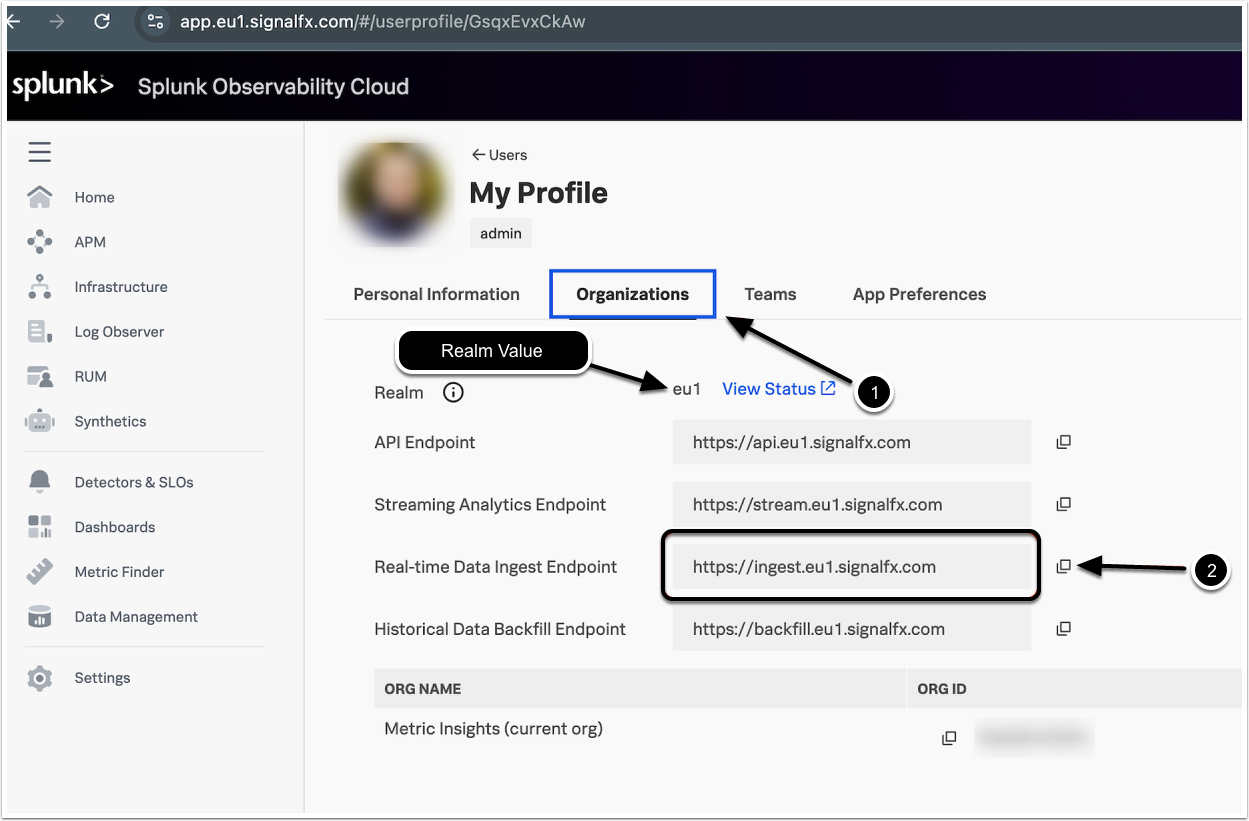
- Access Organizations
- Copy the Real-time Data Ingest Endpoint value, it is required for the environment variable
OTEL_EXPORTER_OTLP_TRACES_ENDPOINT- Copy the Realm value as well.
With the Ingest Token and Realm/Endpoint in hand, you have the two pieces of information needed to configure Metric Insights:
- Access Token – will be used in
OTEL_EXPORTER_OTLP_HEADERS(as the Splunk token header). - Ingest Endpoint, Realm – will be used in
OTEL_EXPORTER_OTLP_TRACES_ENDPOINT(the URL for sending trace data).
2. Configure Metric Insights Web Service Environment Variables for OpenTelemetry
NOTE: By default, the Metric Insights application does not support OpenTelemetry. You will need a pre-configured web Docker image, which can be requested from support@metricinsights.com. Set the correct environment variables to enable the OpenTelemetry integration.
Configure the required environment variables of the Metric Insights web service to enable and direct the OpenTelemetry data to Splunk.
| Parameter Name | Required/Optional | Description |
|---|---|---|
OTEL_PHP_AUTOLOAD_ENABLED |
Required | Set to |
OTEL_SERVICE_NAME |
Required |
Logical name for your service (e.g., "
|
OTEL_RESOURCE_ATTRIBUTES |
Required |
Resource tags for your service, such as deployment environment or other identifiers.
|
OTEL_EXPORTER_OTLP_TRACES_HEADERS |
Required |
Authentication header for the OTLP exporter.
|
OTEL_EXPORTER_OTLP_ENDPOINT |
Required |
Endpoint URL for sending traces. NOTES:
|
OTEL_SDK_DISABLED |
Optional | Set this to |
Example configuration:
OTEL_PHP_AUTOLOAD_ENABLED=true
OTEL_SERVICE_NAME="metric-insights"
OTEL_RESOURCE_ATTRIBUTES="deployment.environment=dev,service.version=7.1.1"
OTEL_EXPORTER_OTLP_TRACES_ENDPOINT=https://ingest.us1.signalfx.com/v2/trace/otlp
OTEL_EXPORTER_OTLP_TRACES_HEADERS="X-SF-TOKEN=ABC123XYZ0000000000"Simple Install
2.1. Set Environment Variables
- On the Metric Insights host server, open the file
/opt/mi/config/deployment/credentials/web.env- This file contains environment settings for the Metric Insights
webcontainer.
- This file contains environment settings for the Metric Insights
- Add the OpenTelemetry configuration variables as identified above.
2.2. Recreate the Web Container
Apply the changes by restarting the web container. Run the following command on the Metric Insights host:
mi-control up -d --force-recreate webThe web service should start up again and begin sending telemetry data to the specified endpoint.
Orchestrated Environments
2.1. Set Environment Variables
Modify the environment variable settings for the Metric Insights web service in your orchestration configuration. Add the OTEL_* variables as described above.
NOTE: Ensure you handle the OTEL_EXPORTER_OTLP_TRACES_HEADERS value (the Splunk token) securely. For Kubernetes, you might create a Secret for the token and reference it in the pod spec, rather than including the raw token in the manifest.
- For example, use a Kubernetes Secret with a key for the token and set
OTEL_EXPORTER_OTLP_TRACES_HEADERStoX-SF-TOKEN=<secretValue>via an environment variable reference.
2.2. Restart the Web Service
Apply the updated configuration so that the Metric Insights web container is restarted with the new environment. Once the new configuration is applied, the Metric Insights web application will launch with OpenTelemetry instrumentation active and pointed at Splunk Observability Cloud.
3. Verifying Data Ingestion in Splunk Observability
After configuring and restarting, you should confirm that Metric Insights telemetry is being received in Splunk Observability Cloud:
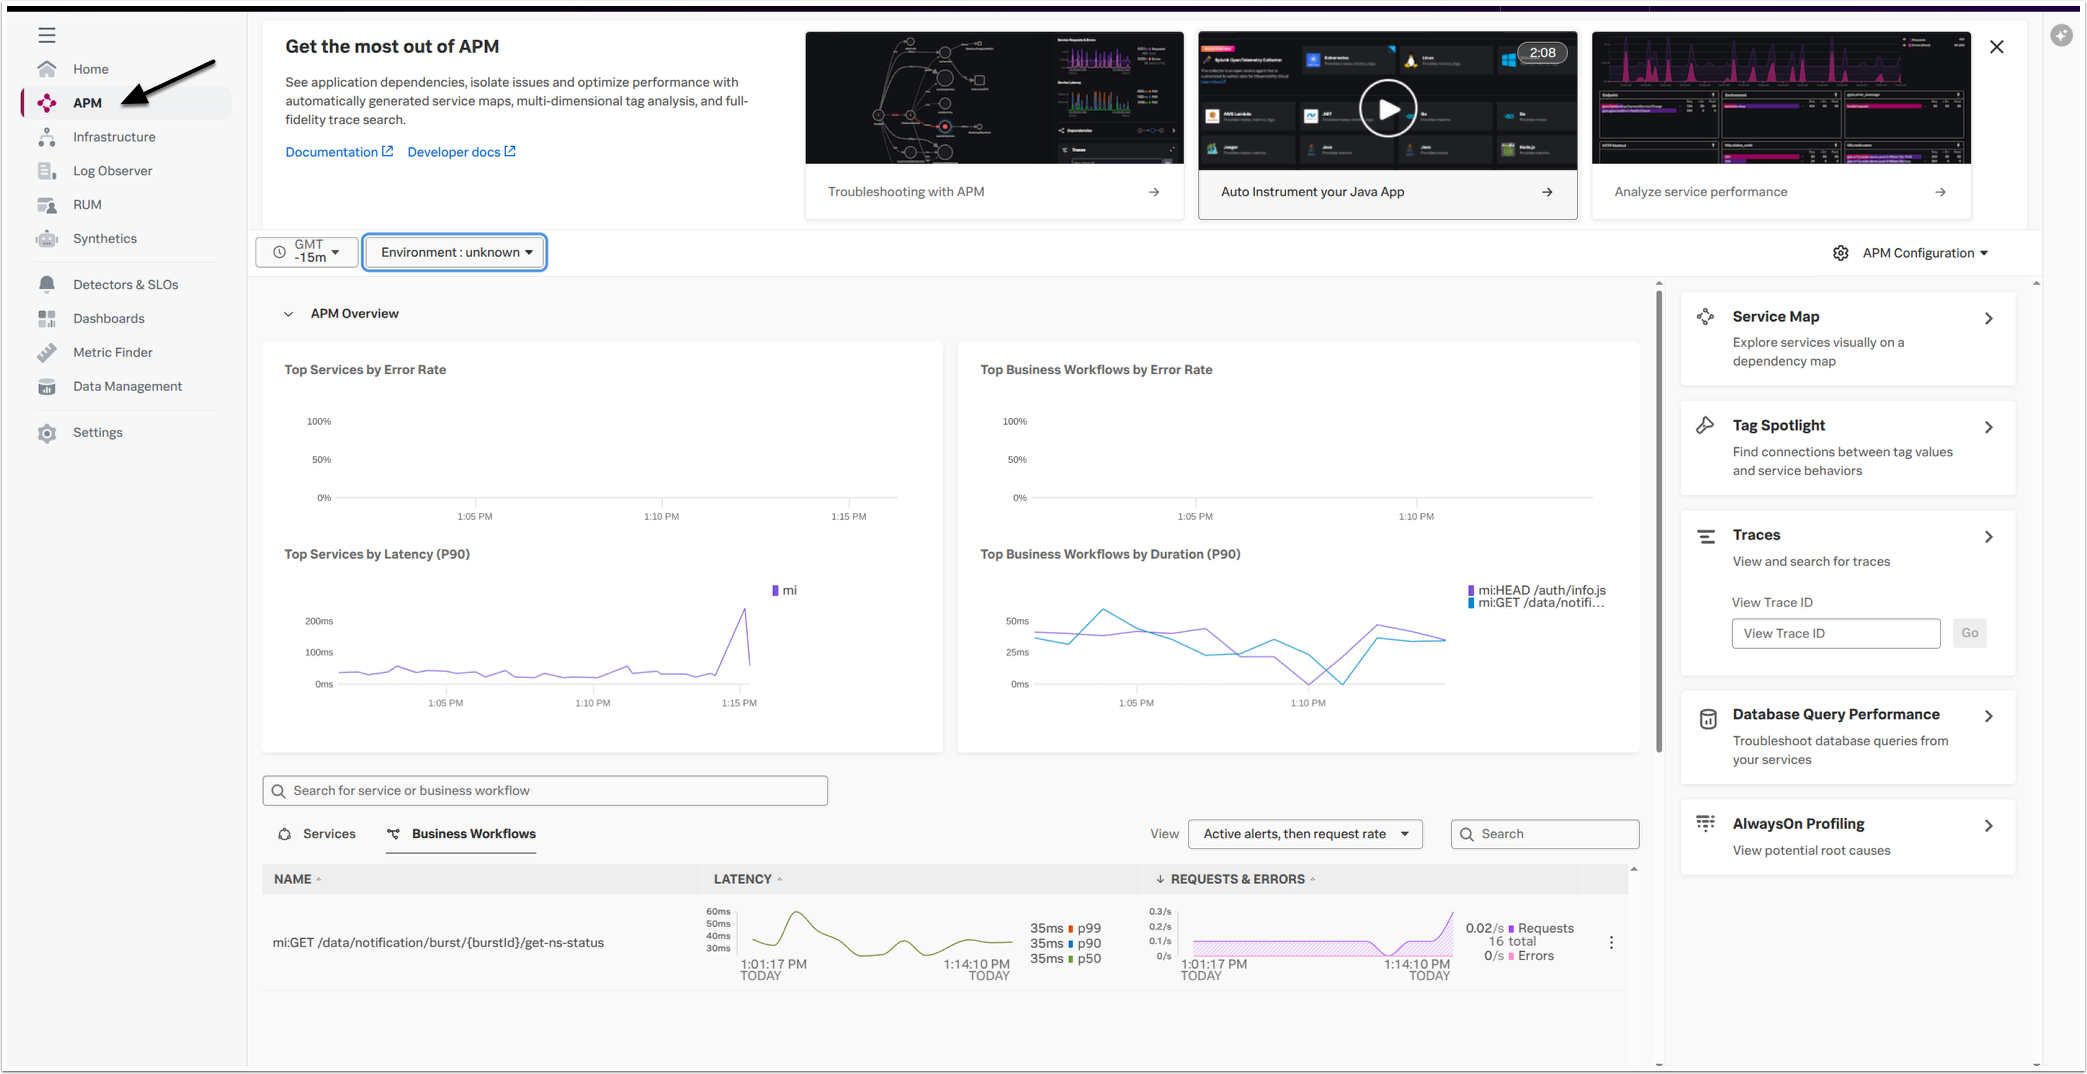
- Log in to Splunk Observability Cloud and navigate to the APM (Tracing) section or relevant dashboards.
- Use the service name you configured (e.g., "metric-insights") to filter or search for traces and metrics.
- You should begin to see data from Metric Insights appear, such as trace spans, service metrics, or other telemetry associated with the service name and environment you set.
- It may take a few minutes for data to first appear.
- If no data appears, double-check your configuration.
- Ensure that:
- the environment variables are correctly set,
- the token and endpoint are correct (with the proper realm and path),
- and that the Metric Insights web service has restarted on the OpenTelemetry-enabled image.
- Checking the web container logs can also provide clues (the OpenTelemetry agent may log initialization info or errors on startup).
- Ensure that: