This article details how to build an External Report in Metric Insights that is linked to a Dashboard on your Grafana server.
PREREQUISITE:
- Establish Connectivity to Grafana via the respective plugin connection profile.
1. Create New External Report
Access New > External Report > Grafana Dashboard
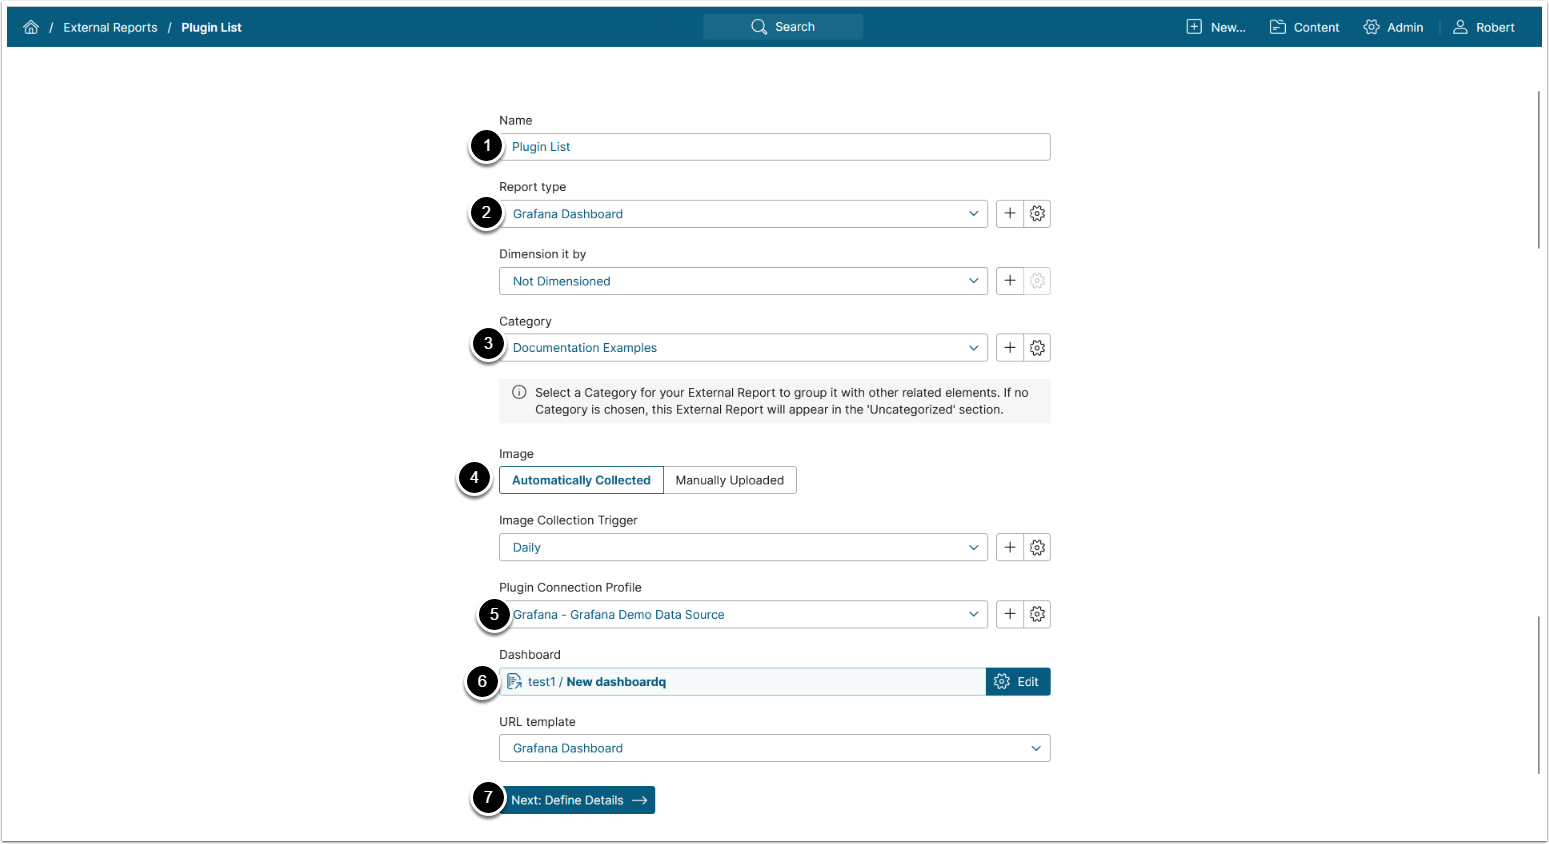
- Give your new External Report a descriptive Name
- Report Type: Grafana Dashboard
- Place your Report in a relevant Category
- Define whether you want the report Image to be uploaded manually or automatically. For Automated Collection, define the following settings:
- Choose the Report Image Trigger from the drop-down list.
- Select the Plugin Connection Profile you have created for Grafana
- Select the Grafana Dashboard from which the image will be collected
- [Next: Define Details] to proceed with Report creation
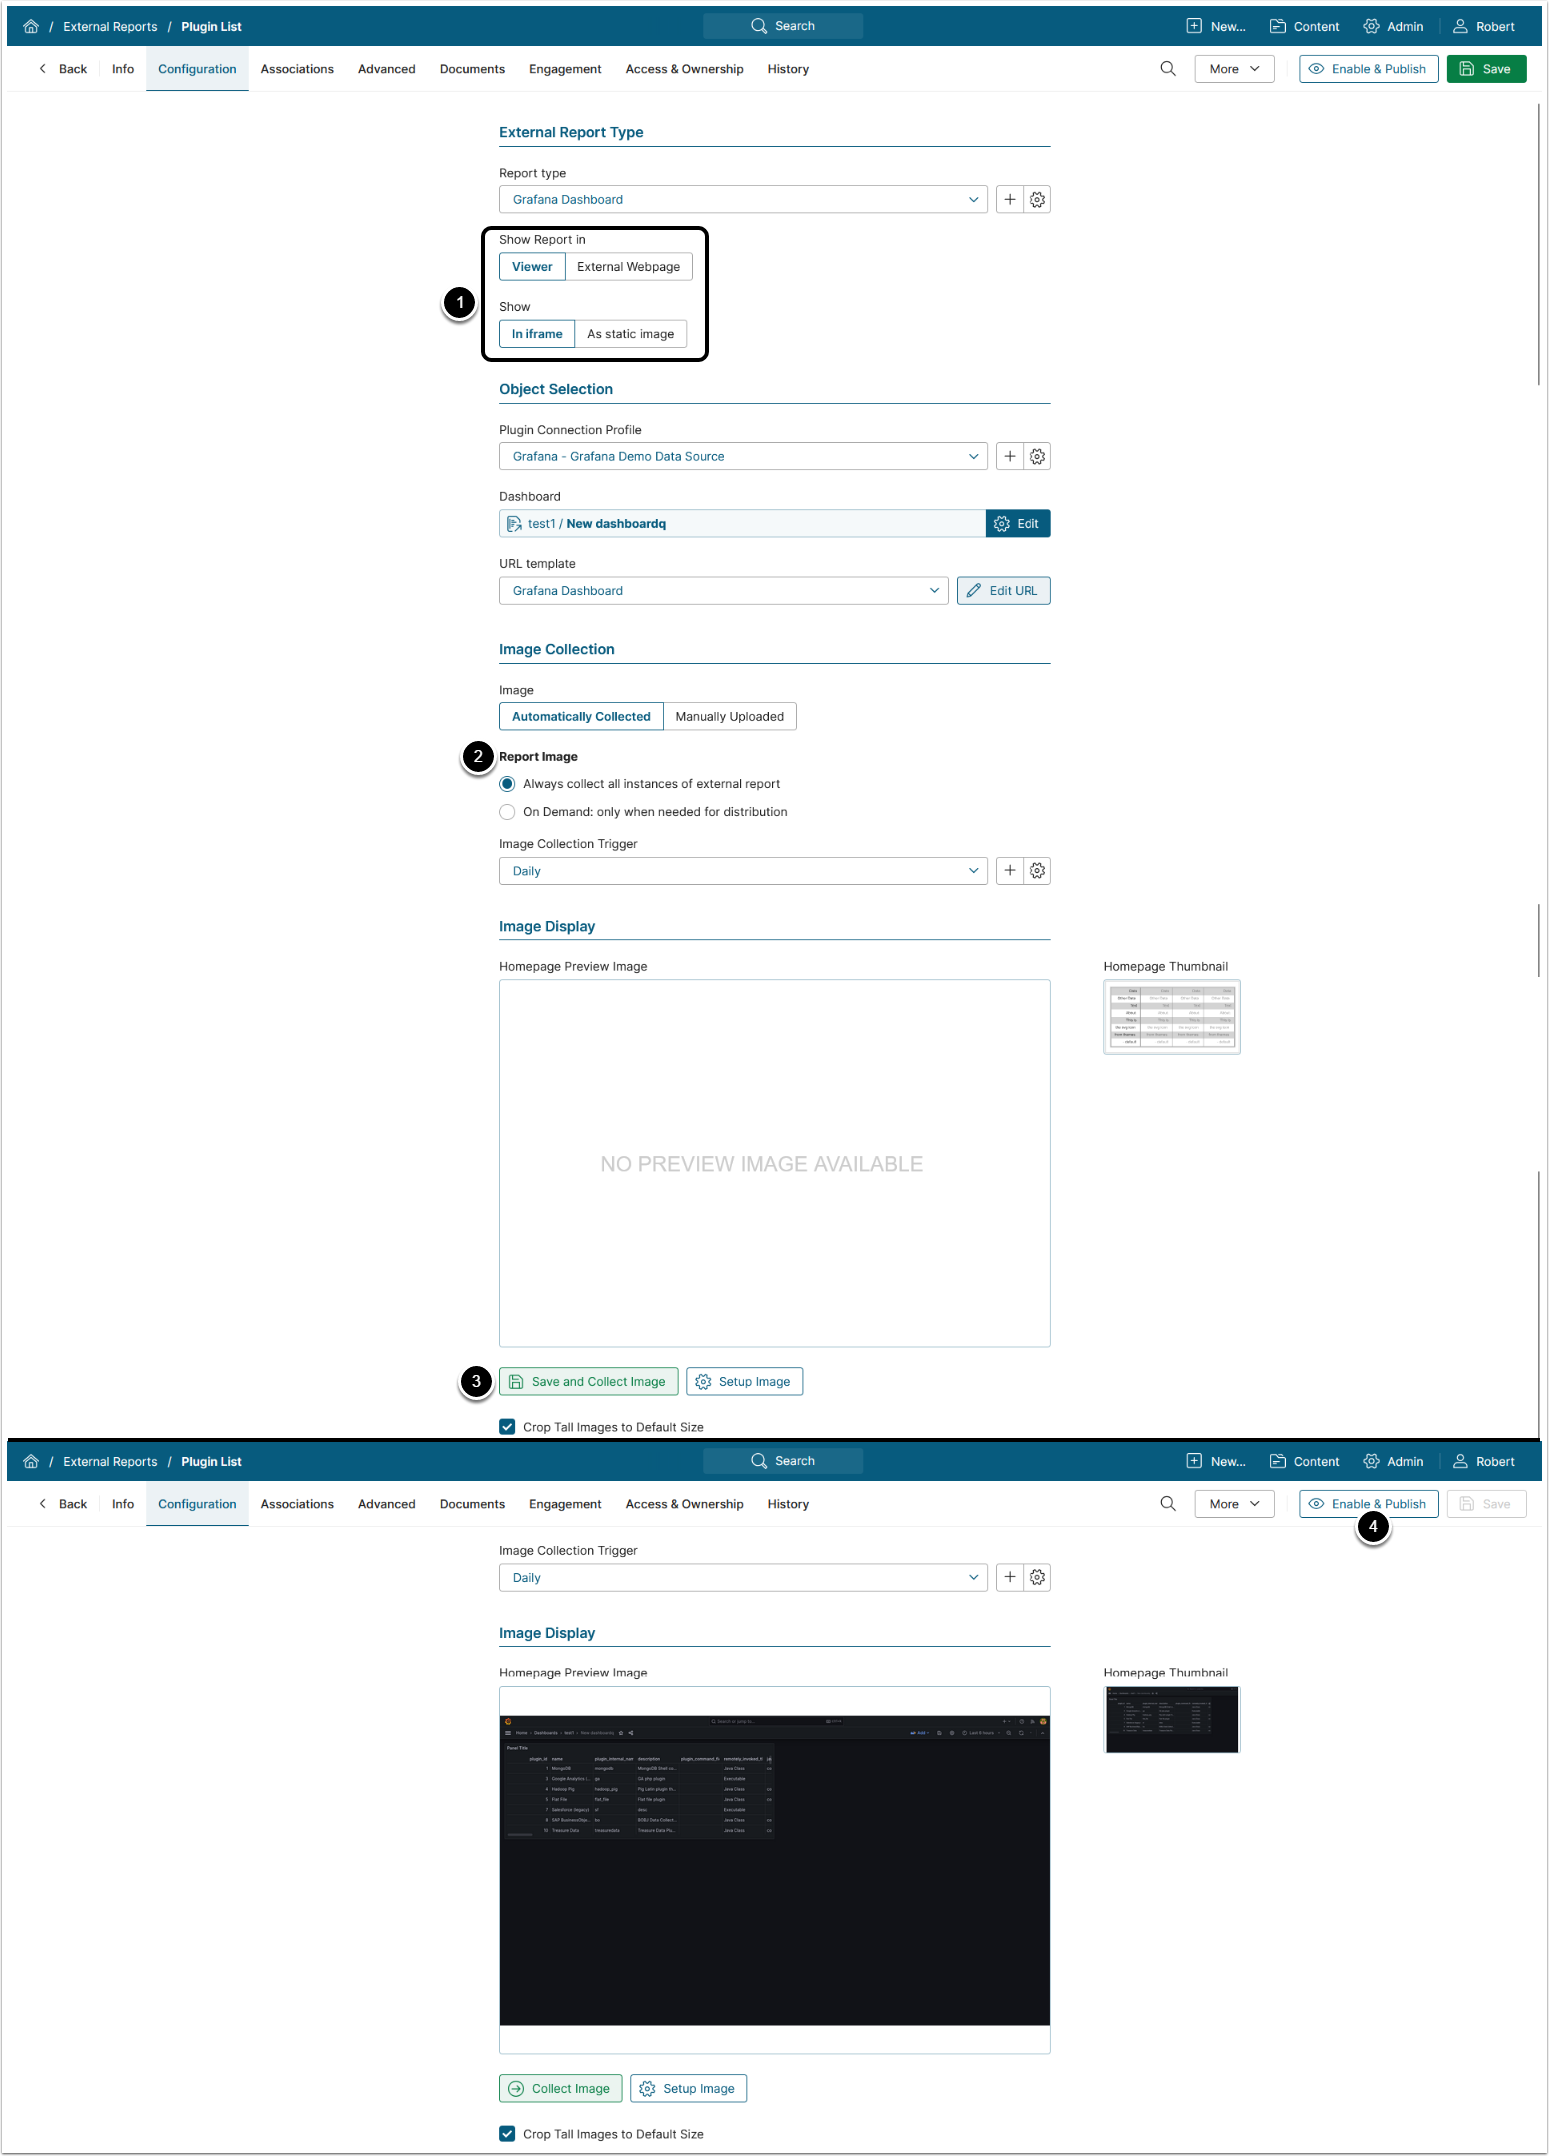
2. Configure External Report
-
Show Report in defaults to "External Webpage". For "Viewer", select to show the External Report:
- "In iframe": To embed the Report into Metric Insights,
-
"As static image": To show an image of the Report in Metric Insights.
- NOTE: For this option, make sure you Collect Image before going to Viewer.
- Select Report Image option:
- "Always collect all instances of external report": collect all images and cache them on a schedule,
- "On Demand: only when needed for distribution": individual images are only collected when they need to be included in an email.
- [Save and Collect Image]
- Once the image is collected, [Enable & Publish].
- This will open the External Report in Viewer or in External Webpage based on the display settings.