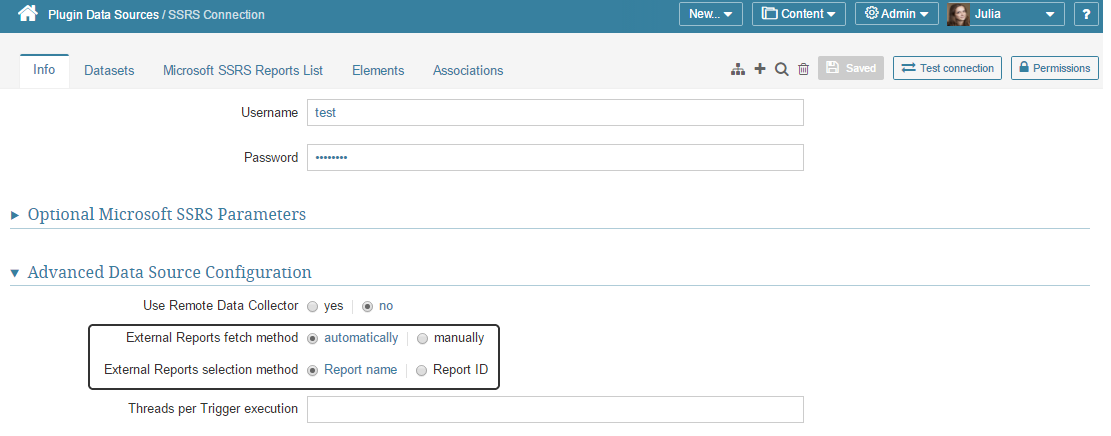
This article gives a behind the scenes look at how Metric Insights captures data from your SSRS reports. It covers how Metric Insights designates each SSRS report via an "id" and a name. It covers how Metric Insights identifies each chart or table within a SSRS report as a separate entity for pulling data. Finally, it covers how the fields are identified in each chart or table and how data is extracted.
SSRS Report ID and Report Name
Metric Insights captures the 'report name' and the 'report id' of each report in SSRS, and gives you the option of which to show in the Report dropdown list in the Element Editor. This is the list of SSRS reports.
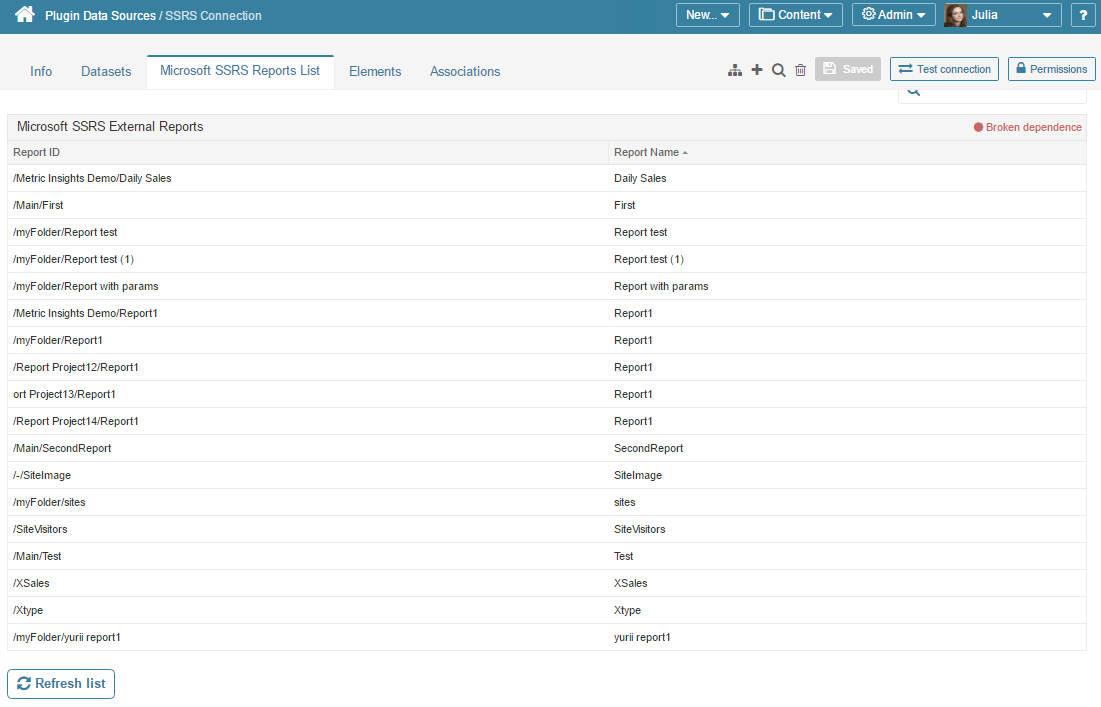
SSRS Report ID and Report Name
Here is an example listing of SSRS reports, designated by 'Report ID' and 'Report Name'. We will look specifically at the "/Metric Insights Demo/" reports.
How Does Metric Insights Get the List of SSRS Reports
Metric Insights obtains the list of SSRS reports by navigating through the SSRS folders.
It pulls each 'report id' and 'report name' from relative url:
/ReportServer?</path/to/report>&rs:Command=ListChildrene.g., for the "/Metric Insights Demo/" reports is uses:
http://ssrs.metricinsights.com/ReportServer?/Metric Insights Demo&rs:Command=ListChildren
In the resulting HTML (see screen shot) it then uses the url of each report for the 'report id', and the name of each report for the 'report name'.
You can view the HTML results via View Source in your browser and you will see the link (<A HREF> </A>) to the report. In this example one report name is Daily Sales:
<A HREF="?%2fMetric+Insights+Demo%2fDaily+Sales&rs:Command=Render">Daily Sales</A>In this example, 'report id' is "/Metric Insights Demo/Daily Sales" (url decode of "%2fMetric+Insights+Demo%2fDaily+Sales").
And 'report name' is "Daily Sales".
More than One Chart, Table in SSRS Report
If the SSRS report contains more than one chart or table, then Metric Insights will append the chart or table name to the 'report id' and 'report name'.
In this screen shot, the SSRS report contains one table and two charts (seen to the right).
In the next section we will describe how Metric Insights determines the internal name for the table and charts found in a SSRS report.
Get the Name of Each Chart or Table in SSRS Report
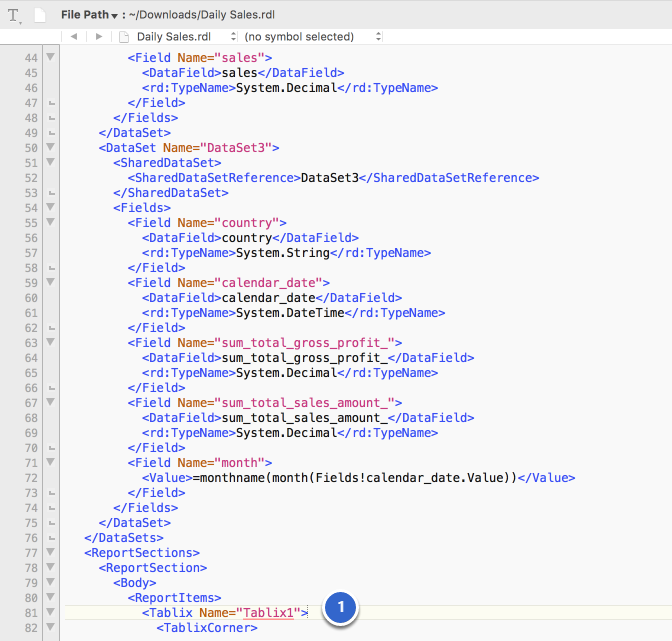
Metric Insights obtains the chart or table names for each SSRS report via the Report Definition Language (RDL).
You can see the RDL for the report by appending "&SelectedTabId=PropertiesTab&Export=true" to the url. For example:
1. The name of the table in this example is determined to be "Tablix1.quarter.month" (the full table name is constructed from more than one XML element in the RDL)
Thus, 'report id' for "/Metric Insights Demo/Daily Sales" for the table becomes "/Metric Insights Demo/Daily Sales&Tablix1.quarter.month", where it includes the table name of "Tablix1.quarter.month". And 'report name' is "Daily Sales&Tablix1.quarter.month".
Metric Insights will then be able to pull data for this table. Subsequently, it can do the same for the two charts as well.
Get the Name of Each Chart or Table in SSRS Report
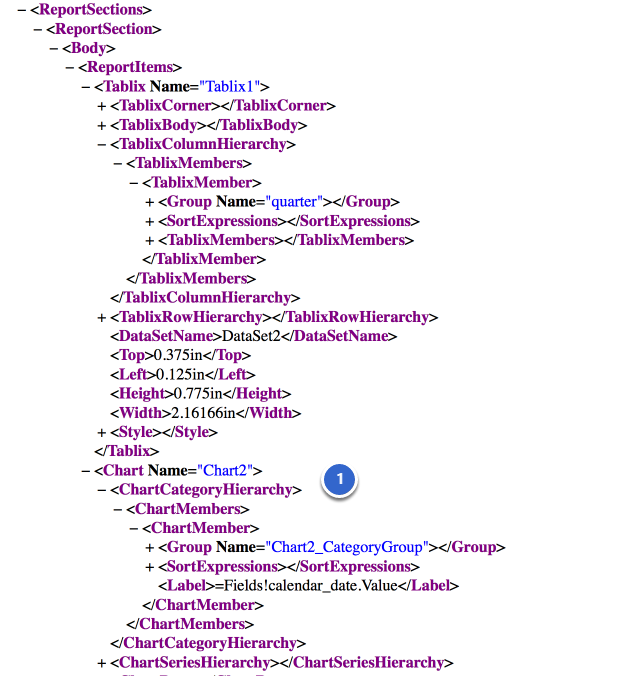
1. In this example of the RDL for SSRS report "/Metric Insights Demo/Daily Sales", you can also see the "Chart2.Chart2_CategoryGroup" chart name (the full chart name is constructed from more than one XML element in the RDL)
Get List of Fields in SSRS Report
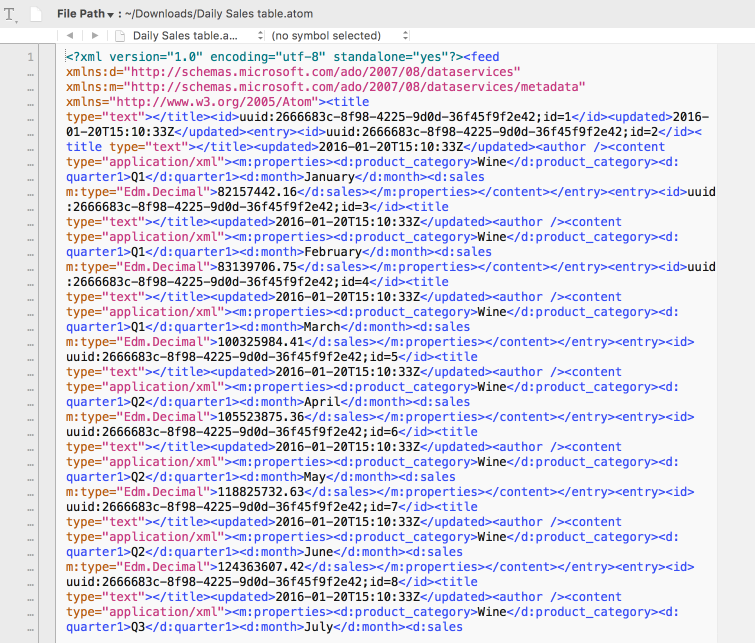
Metric Insights obtains names and data types for each field in a chart or table via the SSRS ATOM file for that chart or table.
You can see the ATOM file from the report chart or table by appending "&rs:Command=Render&rs:Format=ATOM&rc:ItemPath=<chart or table>" to the url. For example:
Metric Insights also uses the ATOM file to get the data for each chart or table in a SSRS report.
Get Data from SSRS Report
Metric Insights obtains the data for each chart or table via the SSRS ATOM file as in previous example.
However, you can see the similar data when you manually export the report to CSV.
Get Data from SSRS Report when More than One Chart, Table in SSRS Report
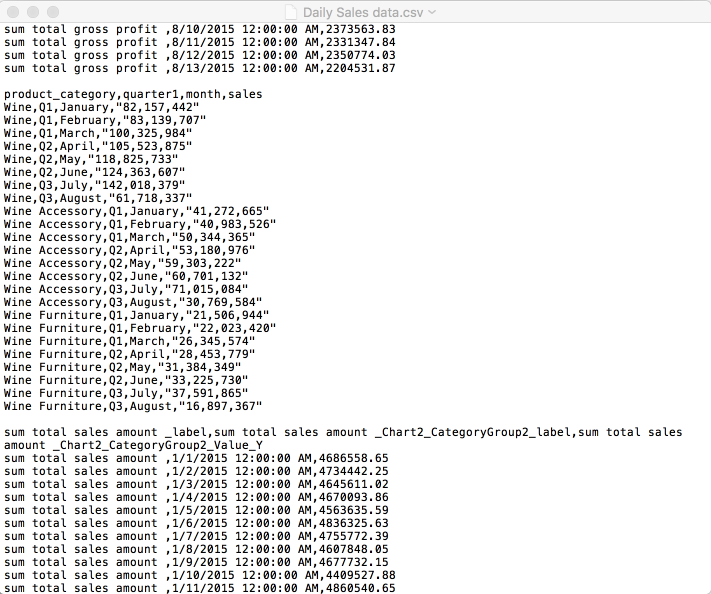
In this example, the SSRS report has one table and two charts.
If your SSRS report has more than one chart or table in it, then you will see a group of data in your exported CSV for each chart or table. In this example, the middle section of the CSV contains the data for the table.
Note: This is why Metric Insights identifies each chart or table in your SSRS report for data pull. Each chart or table contains a different set of data. And Metric Insights pulls the data via the ATOM file instead of CSV as explained earlier.
