This article provides an overview of External Reports within the Metric Insights system.
External Report in an Object that allows to display a visualization from an external BI tool (e.g., Tableau, Power BI, etc.). The difference between an External Report and an Element populated by External Content:
- External Content is an Object used to display data located on a web page.
- External Report allows not only to automatically gather and show data, stored in an external source, but also apply filters to that data and flexibly customize its display.
If there are multiple Reports in that need to be added to Metric Insights, they can be bulk-added all at once.
In this article:
- Creating an External Report
- Info Tab
- Configuration Tab
- Associations Tab
- Advanced Tab
- Documents Tab
- Engagement Tab
- Access & Ownership Tab
- History Tab
Note, that Metric Insights uses only https. If the web application that serves as the Data Source for your External Report uses ordinary http, the Report will not be displayed in the Metric Insights Viewer. For more information refer to this issues fixing article.
1. Creating an External Report
Access + New > External Report > BI tool.
This example is using Tableau as the BI tool. The configuration of External Reports is specific to each BI tool. Links to more specialized instructions based on a given BI tool can be found here: Metric Insights' Plugins.

- Name: Must be unique for every Report. It is impossible to proceed to next step if the Report Name is the same as an existing one.
-
Report Type: Is set automatically, according to the selected BI tool.
- For more information about Report Types refer to this article.
- Dimension it by: Optional. Choose a Dimension to be applied to the Report.
- Category: Choose the Category of the Report.
-
Tags: Optional. Tags are used to relate Elements to each other for purposes of identifying and searching for similar Elements.
- For details refer to Create Tag.
-
Glossary: Optional. It is possible to attach Glossary Terms to the Report for identification and search purposes.
- For more details check the Understanding Glossary article.
-
Image: Select how the images are collected:
- "Automatically Collected" requires that a Report Image Trigger is set. It defines when the image is updated.
- "Manually Uploaded" means the Admin uploads the image manually.
- Plugin Connect Profile: Select the Data Source from which the information is collected.
- Object: Choose the source object from the plugin. In this case its a Workbook.
- URL Template: Select a template for URL address.
- [Next: Define Details]
2. Info Tab
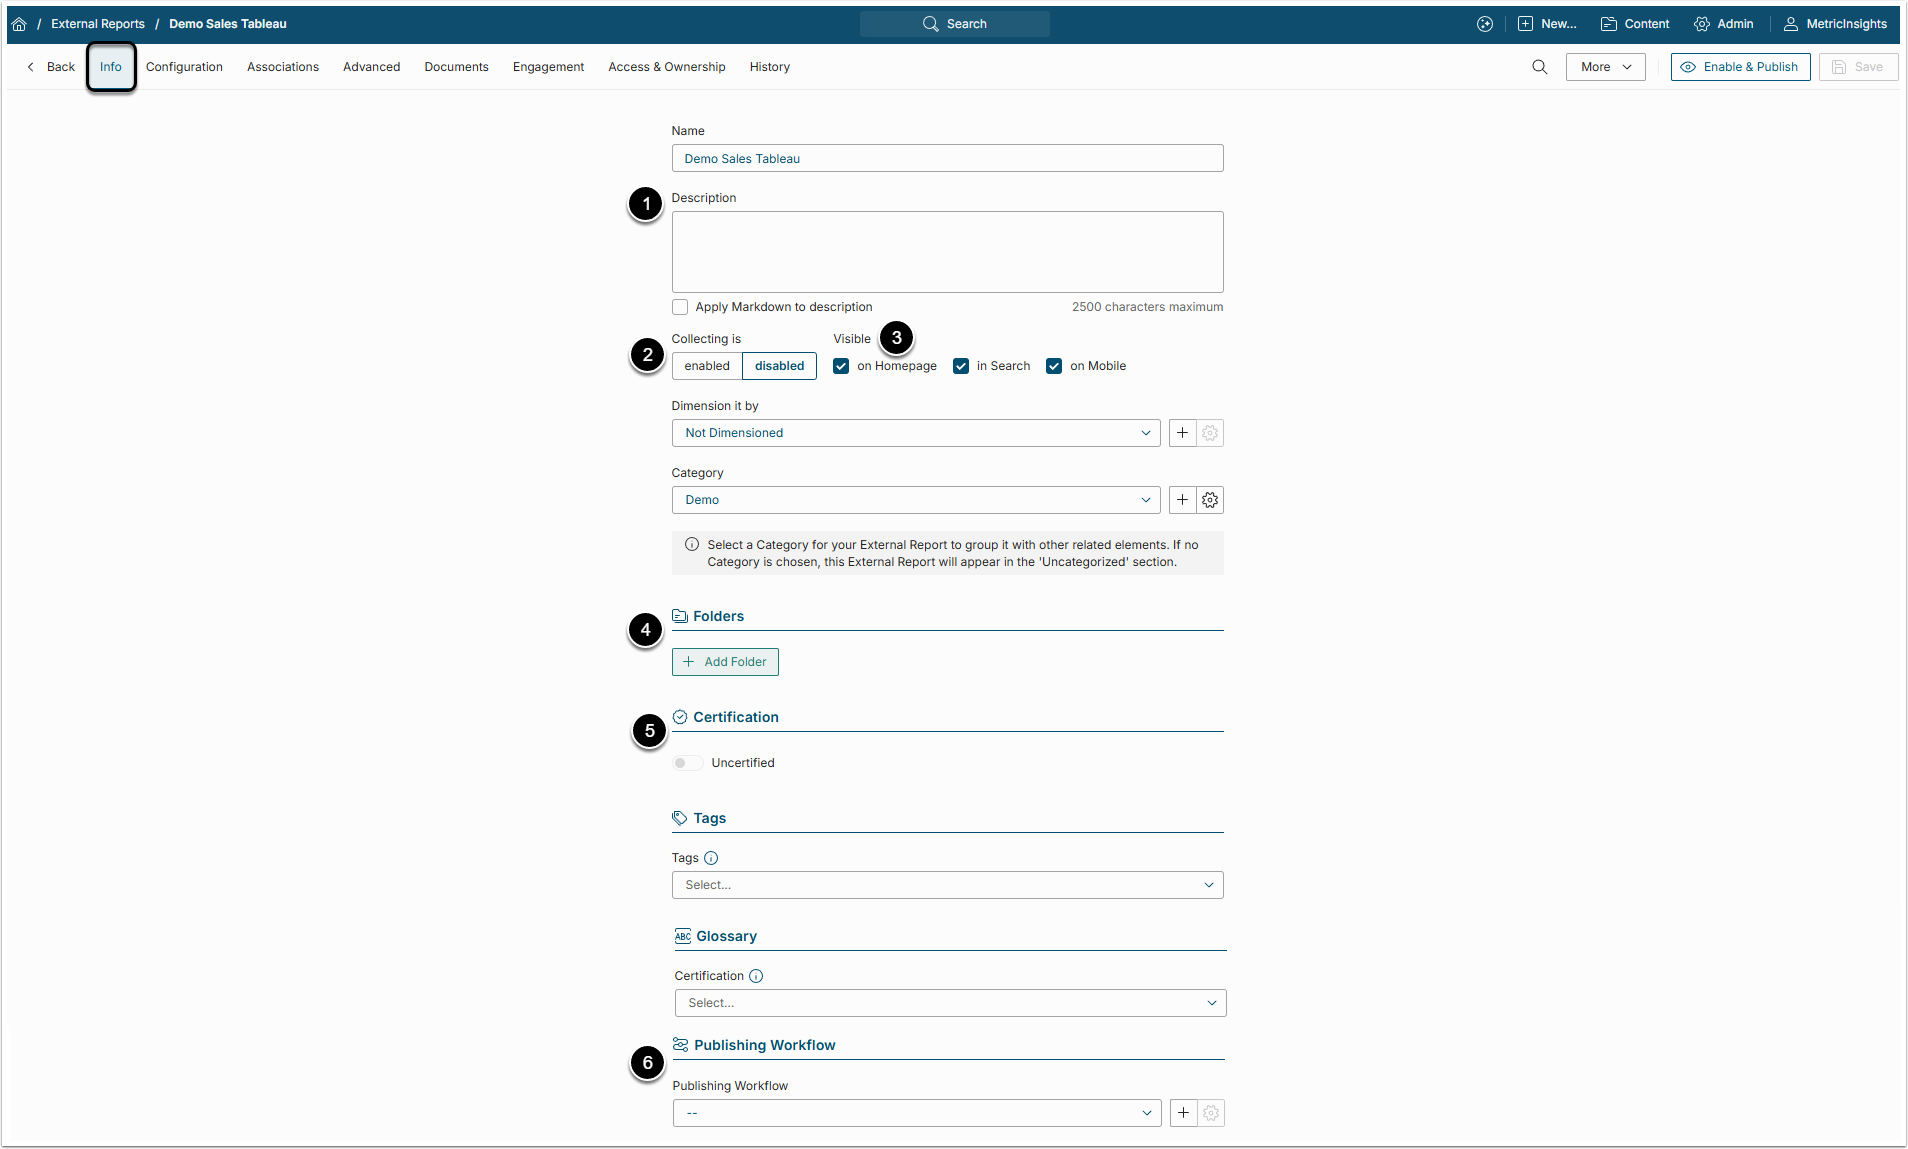
- Description: This text will be visible in the External Report Viewer.
- Collecting is: New Elements will be "disabled" until you publish the Report.
-
Visible: By default, Users can find newly created Elements via Search, Mobile and on the Homepage.
- Disabling these check boxes makes the element visible to the Admin and creator only.
- Folders: Optionally, select the Folder to which the External Report will be placed.
-
Certified: Certification allows Admins and Power Users to identify Elements that have been validated and deemed accurate.
- For details refer to the Certification Levels for Elements article.
-
Publishing Workflow: Publishing Workflows determine how the External Report is published.
- For more information check the Understanding Publishing Workflows article.
3. Configuration Tab
Its contents are based upon the specific BI Tool requirements. Below is an example using Tableau.
3.1. External Report Type, Object Selection and Filters
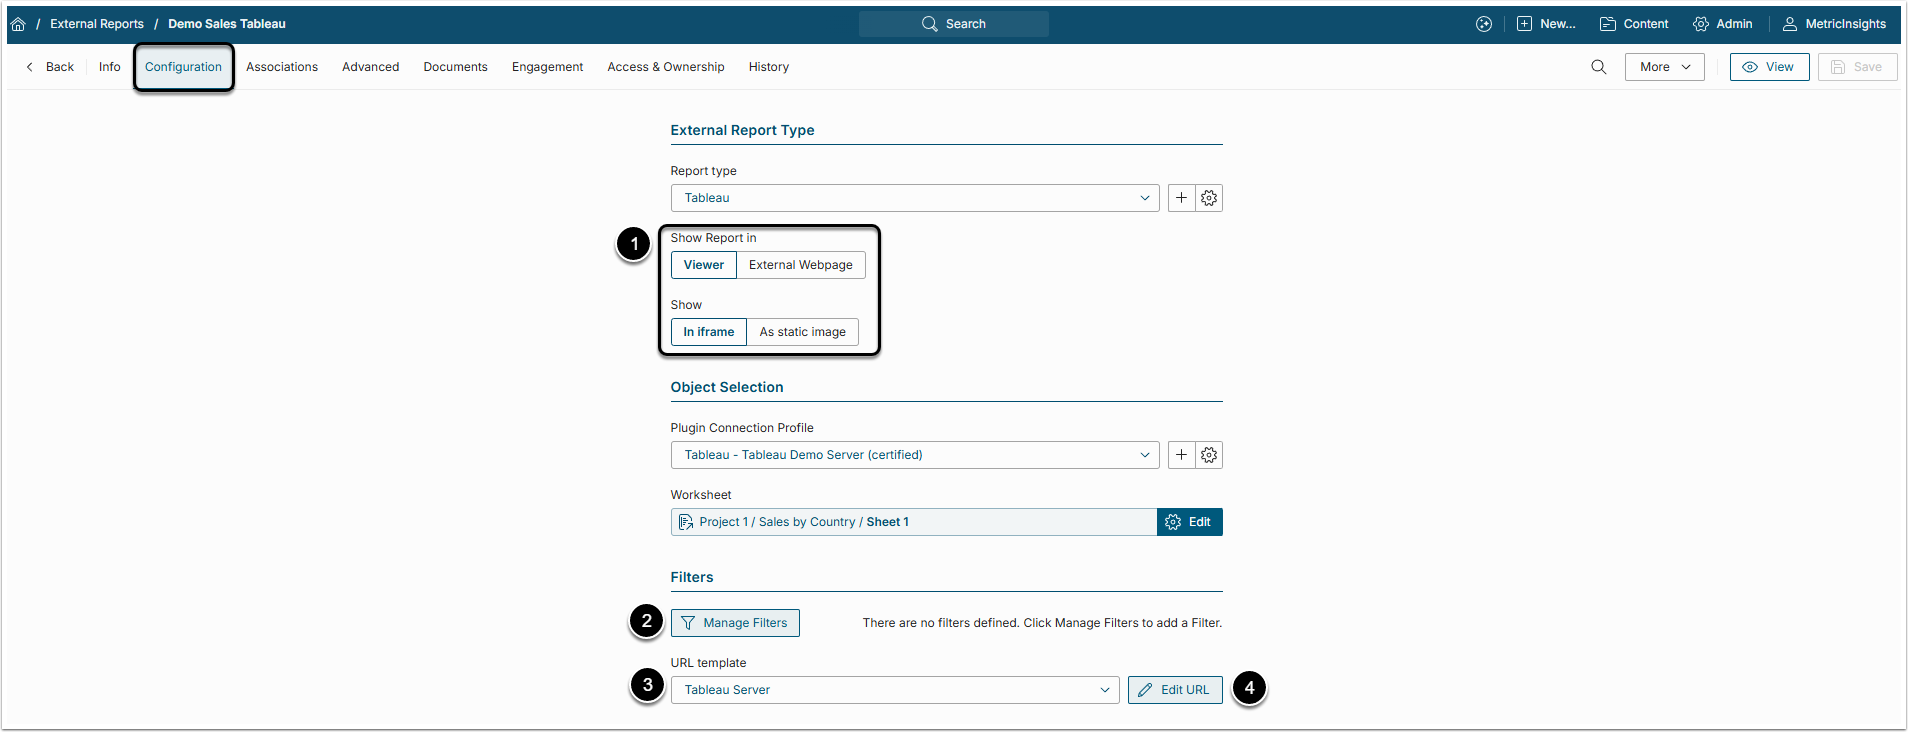
-
Show Report: Select where the External Report will be shown after the User clicks on it.
- "External Webpage"means that the Report will be shown on the webpage from which the data was collected.
- After choosing "Viewer", define either it will be shown "in iframe" or "as a static image".
- For more details about display options, check the Display Options on Advanced tab article.
-
[Manage Filters] to apply Filters to this Report prior to collecting data.
- For more information see Filtering in External Reports (Pre-filtering BI Tools).
- URL template: Ror more details, refer to Plugin URL Editor.
- [Edit URL] to edit the URL and use the Popup to create a Custom URL and test your changes.
3.2. Image Collection and Image Display
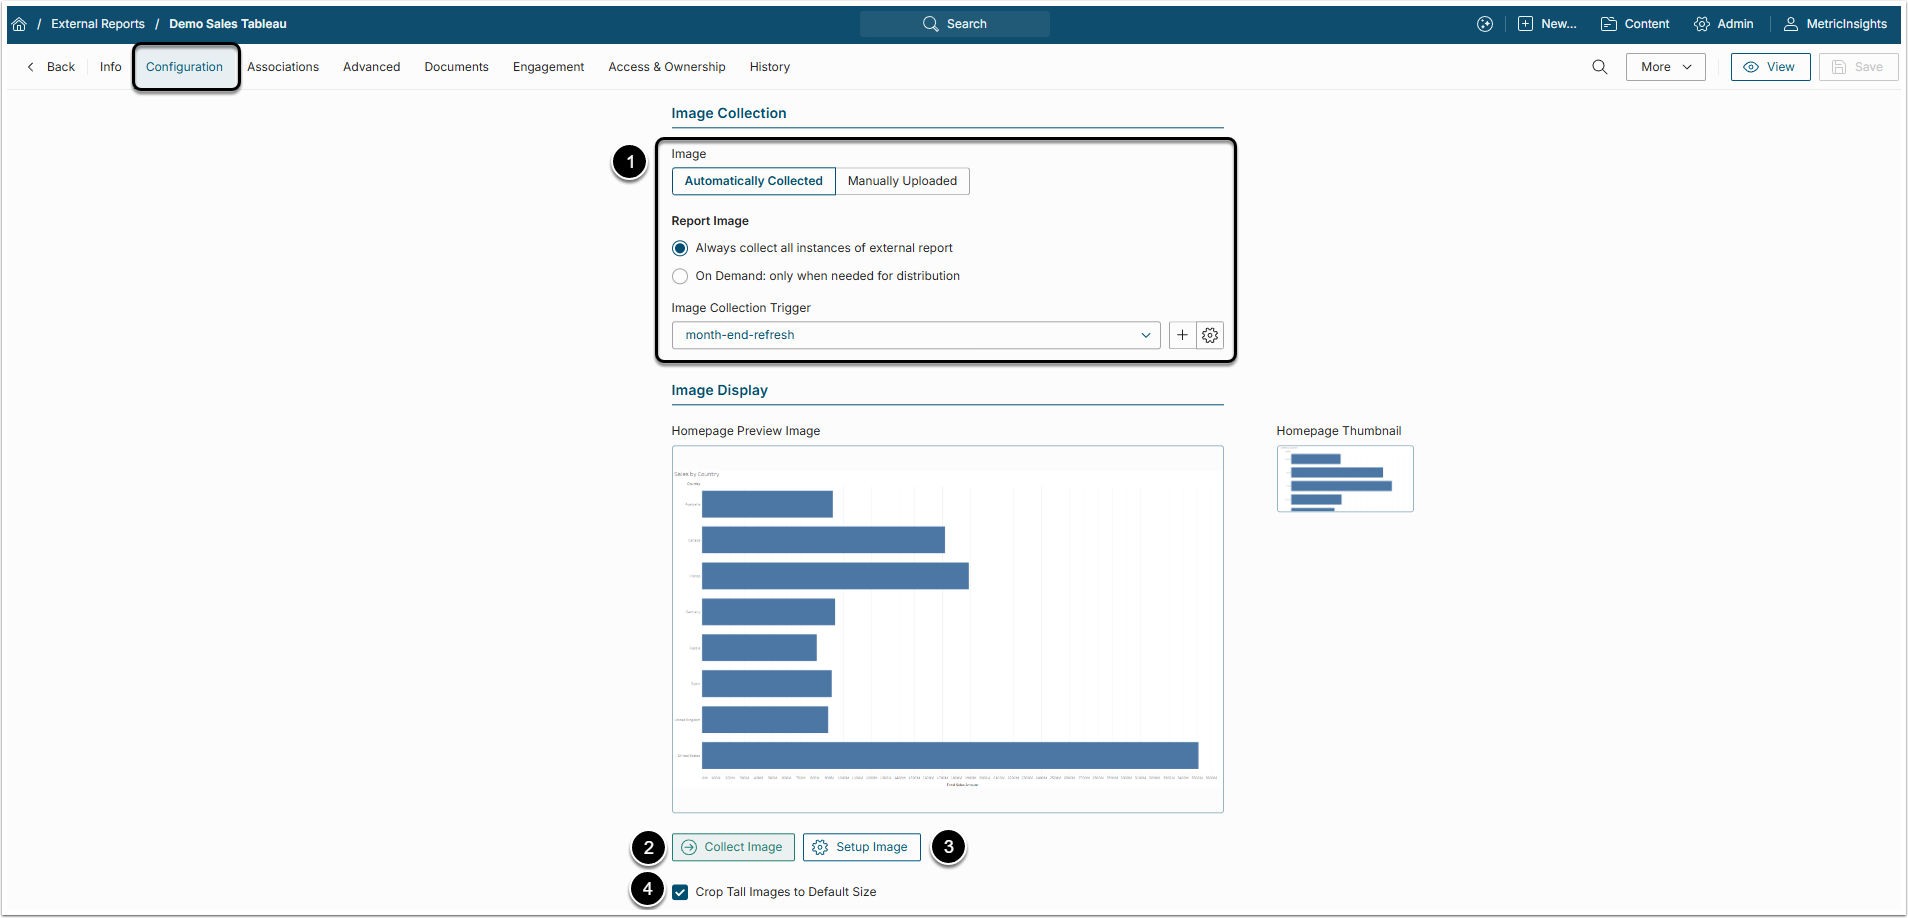
-
Image: Select how the images will be collected. If "Automatically Collected" is chosen also define:
- Report Image: Either the data is collected automatically and according to the Report Image Trigger, or by demand.
- Image Collection Trigger: Determines when and how often the data is collected.
- [Save And Collect Image] to collect the data, set the image and save it.
-
[Setup Image] to change the Homepage's preview image height and width.
- For more information, refer to Understanding Setup Image.
- Crop Tall Images to Default Size: If the image is tall, it would look clumsy on the tile. Enable this check box to crop it.
4. Associations Tab
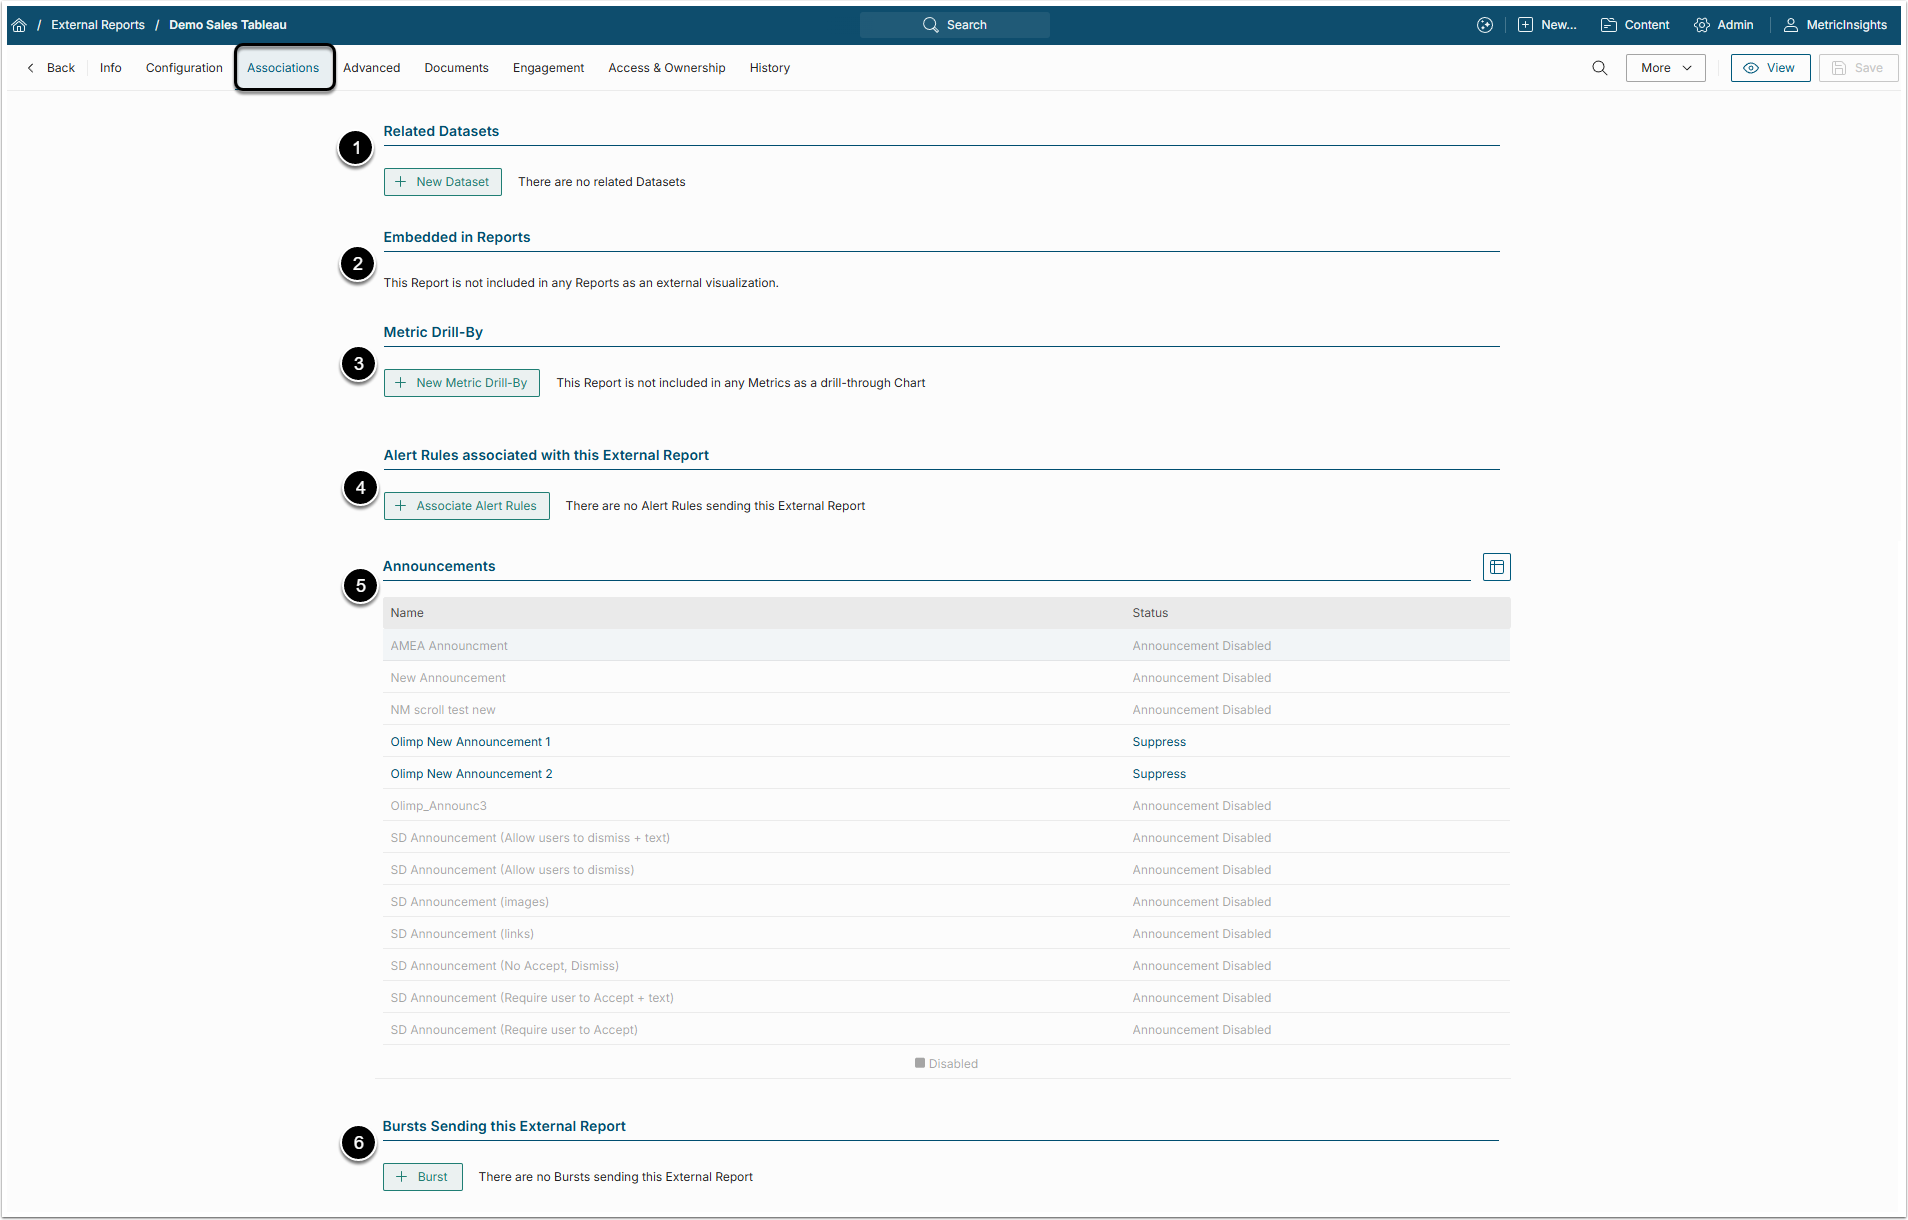
- Related Datasets: This section shows the Dataset from which this External Report was created, if there is such a Datset.
- Embedded in Reports: Other Reports in which this External Report was used as an external visualization are listed here.
-
Metric Drill-By: Shows Metrics that have a connection to this External Report.
- For more details, check the Establishing a Drill-Path from a Metric to Another Element article.
- Alert Rules associated with this External Report: This section shows Alert Rules, applied to this External Report.
- Announcements: This grid shows Announcements that will be shown in the External Report's Viewer.
- Bursts Sending this External Report: Shows Bursts, that include this External Report.
5. Advanced Tab
5.1. Desktop, Full Screen and Mobile Display

NOTE: The Desktop Display and Full Screen Desktop Display sections are shown in the Advanced tab only if the "Viewer" option is selected to display Report in the Configuration tab.
- Viewer Size: "Automatic" option means the size of the image will be set automatically according to its original size or size set in the Setup Image. It is also possible to set "Fixed height"
- Refresh iframe every: If the "In iframe" was chosen instead of "Static Image" in the Configuration tab, it is possible to set how often it will refresh.
- Show collaboration: Enable this checkbox to allow users leave Comments to the Report tile.
- Customize Tableau Toolbar and Tabs: Select this checkbox to set where the Tableau Toolbar will be shown and decide if the Tableau Tabs will be shown at all.
- Associate with App: The External Report can be shown not only in the Metric Insights Viewer, but also in the App window. Select the App that will be allowed to override standard Viewer look.
- Display Filter bar in Full Screen: Select where to show the filters, on "Top" or "Bottom".
- Hide if mouse remain stationary: Enable this checkbox to hide the filters if the pointer remains stationary for some time.
- Image: Select how images will be shown on Mobile. Is recommended to be set as "Static Image".
- Hide Filters on Mobile: Select this checkbox to hide Filters on Mobile view.
5.2. Additional Files, Auto Expiration and Embedding

-
Collect additional files: To generate a PDF or CSV file after collecting the data, enable corresponding check box.
- If the "PDF" check box is enabled, choose the page format for the file.
- Expire if latest image is more than: Set when tile will display "Expired" marker based on the age of the image.
- [Embed code] to get the code that allows to embed this External Report on other webpage using iframe.
6. Documents Tab
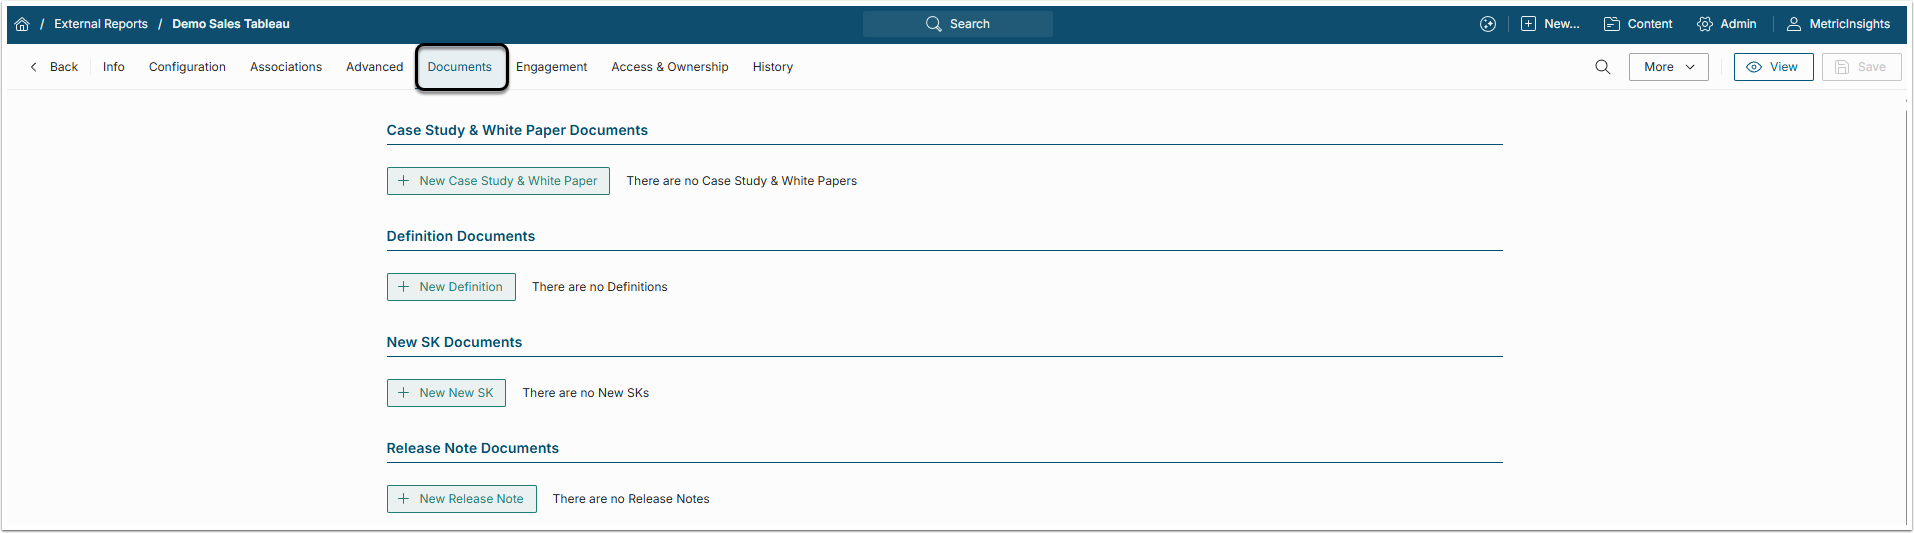
In this tab the User is able to attach Documents to the External Report. The sections displayed here are the Document Types that exist in the system. The Document can be added in a form of a link to some external page or a PDF file from the User's PC.
7. Engagement Tab
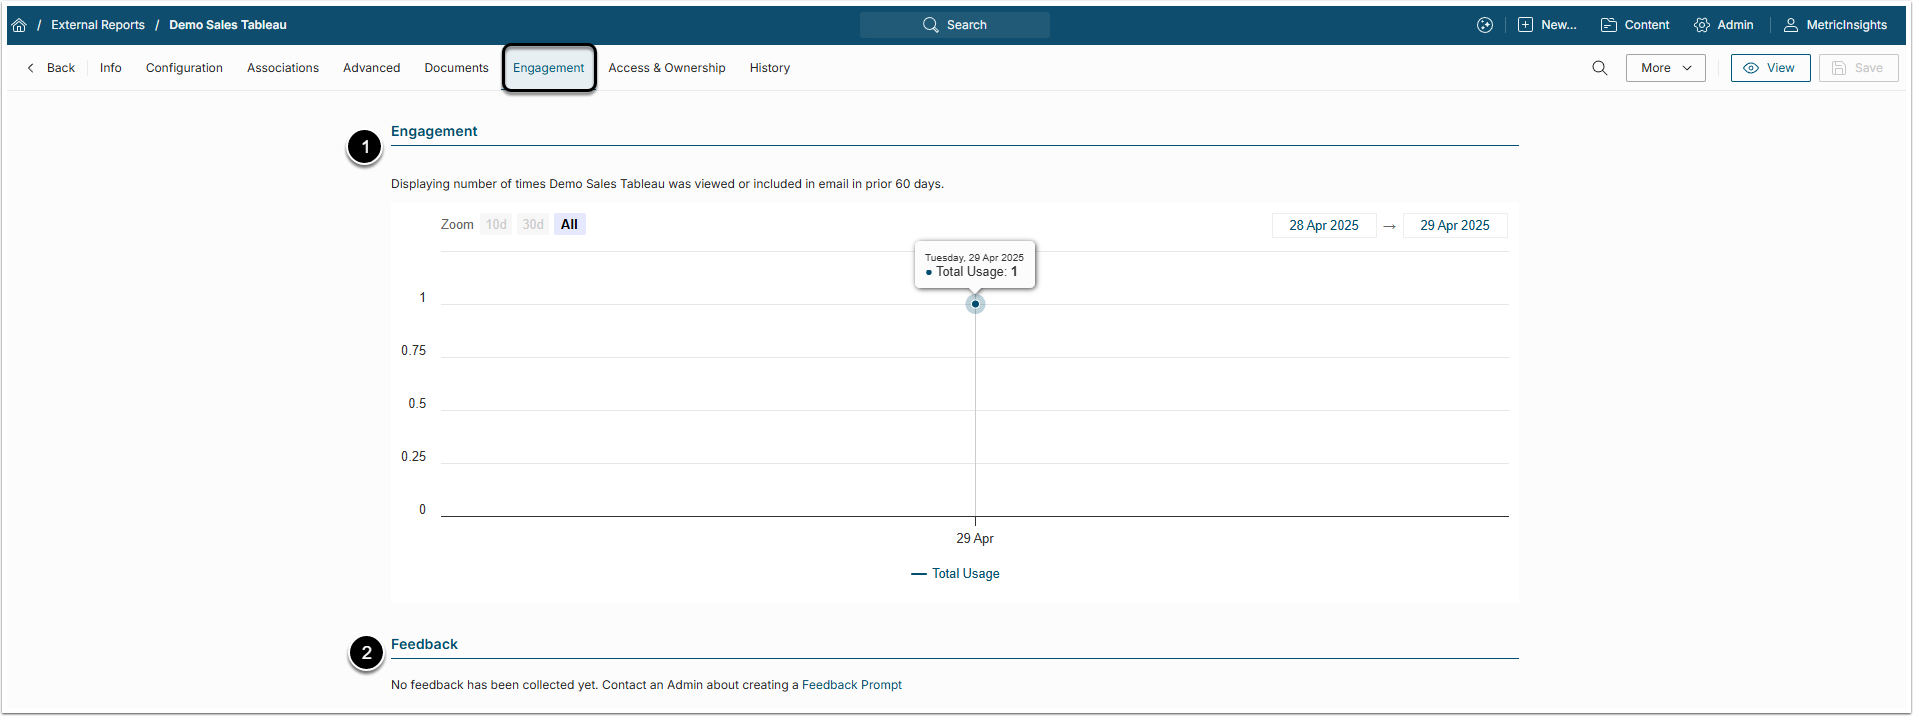
- Engagement chart shows when and how many Users interacted with the External Report by viewing it or sending it in an email.
- Feedback section shows User reactions (Rating or/and Comments) to the External Report.
For more information, check the Understanding Engagement and Feedback on Elements article.
8. Access & Ownership Tab
8.1. Content Access, Ownership and Public Access
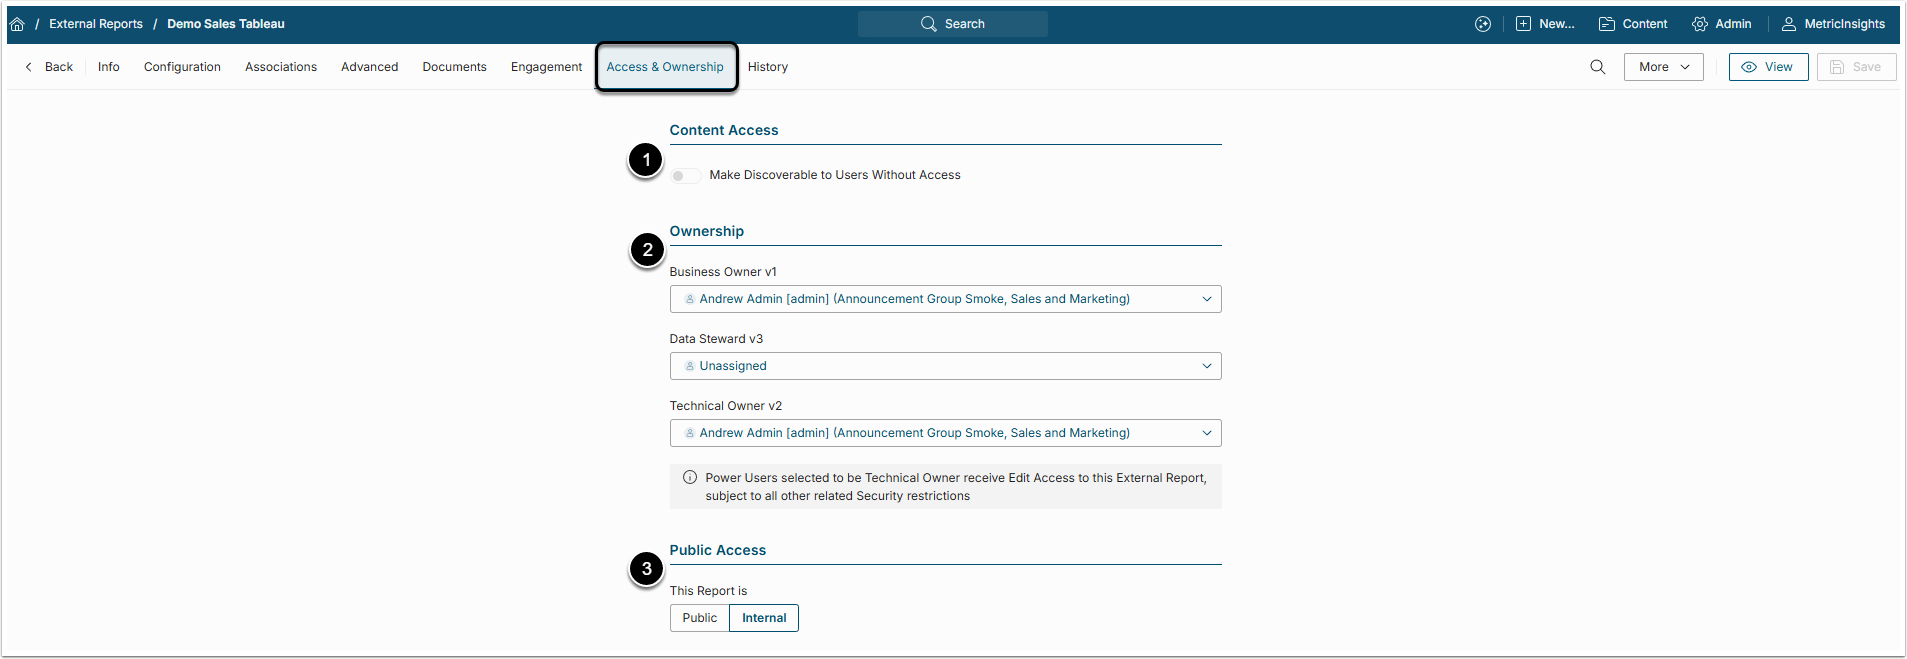
-
Content Access: Activate the Make Discoverable to Users Without Access toggle switch to allow Users without access see this External Report as a tile on the Homepage.
- For more details, check the Setting Element's Discoverability article.
-
Ownership: Fields in this section define the owners of the External Report.
- For more details check Types of Users According to the Element Affinity.
- Public Access: Define whether this External Report will be available to all the Users or only to the owners and Administrators.
8.2. Groups and Users Access
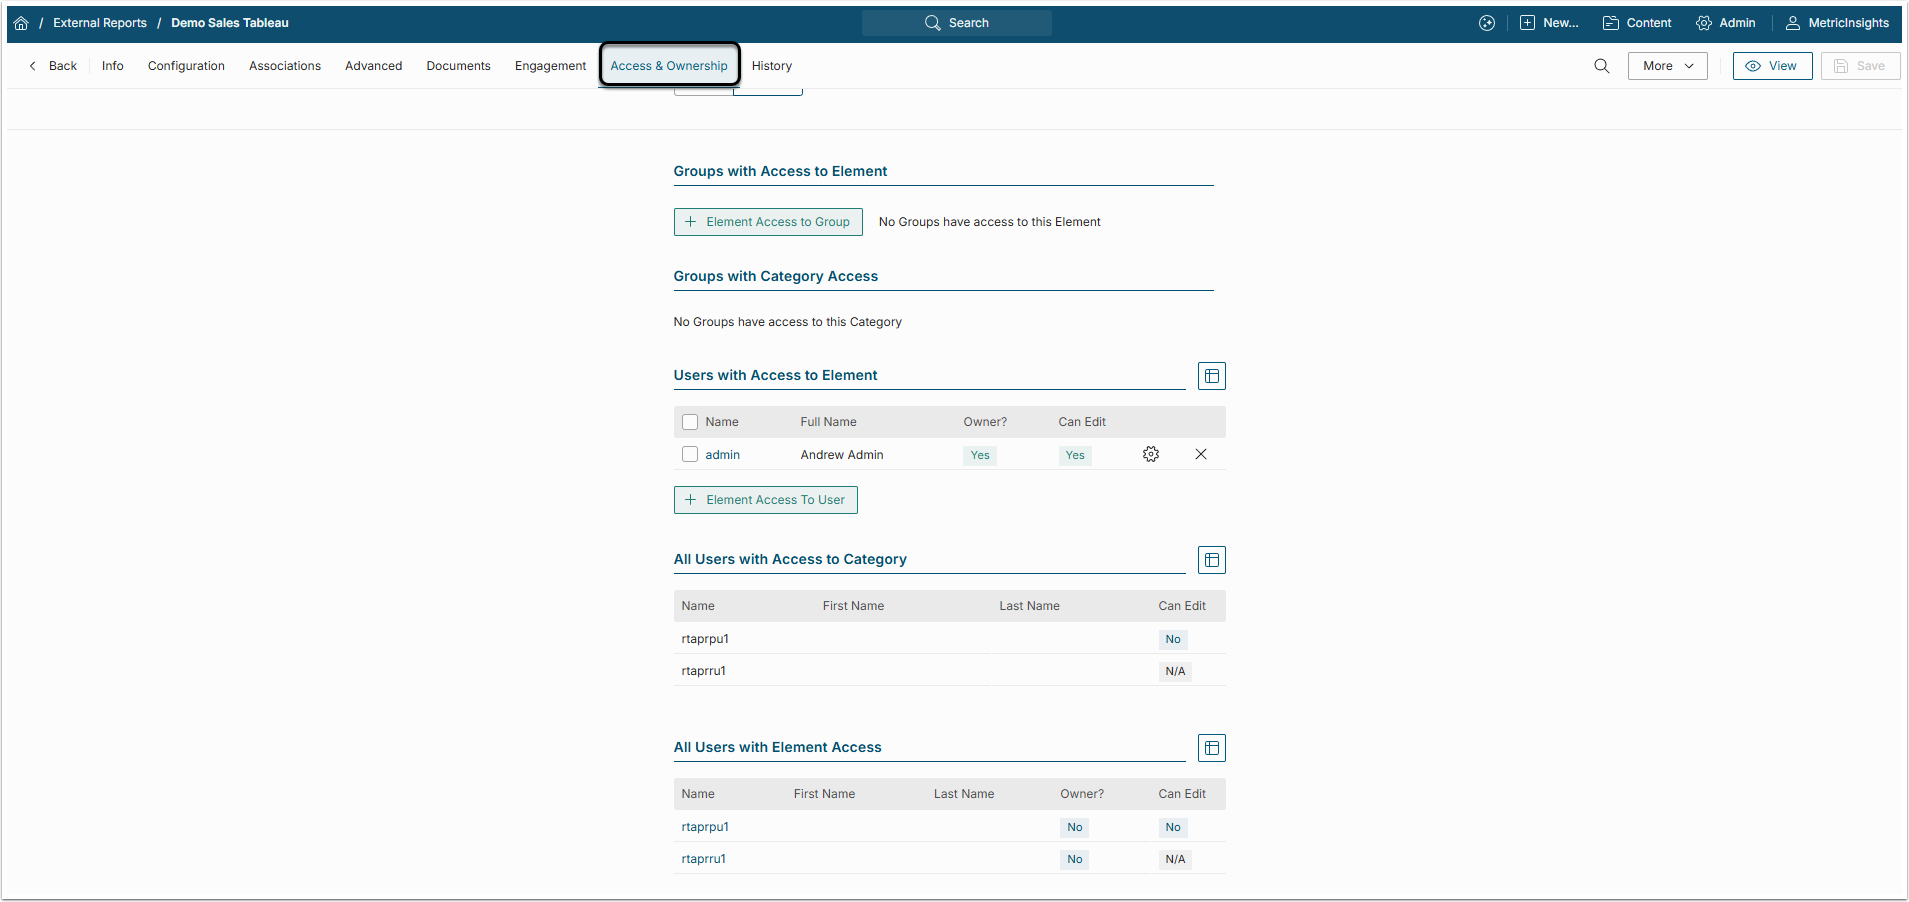
This part of the tab displays what Groups and Users have access to the External Report. For more details on how access is given to Users and Groups, check Granting Power User Access to External Report article.
9. History Tab
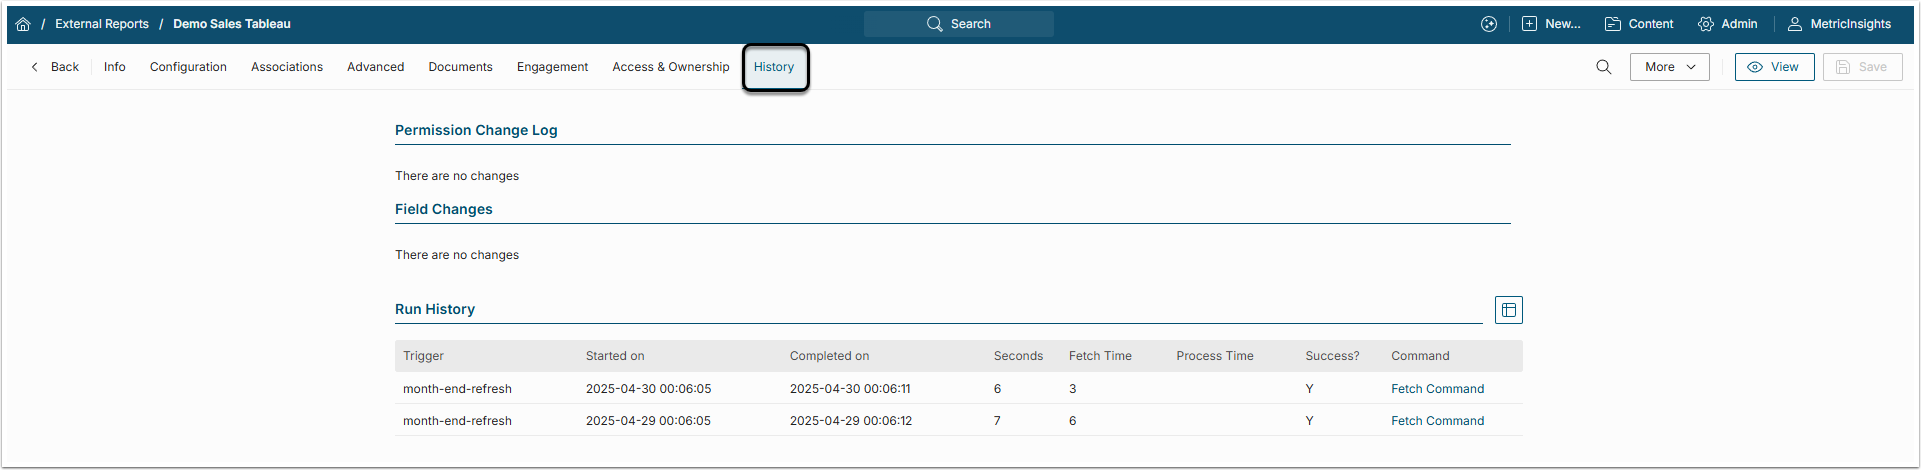
This tab shows logs of changes that are made to the External Report, which includes Permissions given to the Users or Groups, Field changes and the log of all the updates to the External Report.