This article provides an overview of External Report creation within the Metric Insights system.
External Report in an object that allows to display a visualization from an external BI tool (e.g., Tableau, Power BI, etc.). The difference between an External Report andan Element populated by External Content:
- External Content is an object used to display data located on a web page.
- External Report allows not only to automatically gather and show data, stored in an external source, but also apply filters to that data and flexibly customize its display.
If there are multiple reports that need to be added to Metric Insights, they can be bulk-added all at once.
In this article:
NOTE: Metric Insights uses only https. If the web application that serves as the Data Source for yourExternal Reportuses ordinary http, the report will not be displayed in the Metric Insights viewer. For more information refer to this issues fixing article.
Here is a list of Metric Insights plugins that allow External Report creation:
| Plugin | Supports Filtering | Allows for Content Autosync | Native PDF | Image Collection Specifics |
|---|---|---|---|---|
| Amazon QuickSight | No | No | Yes | Collects images by communicating with the tool via API. |
| Amazon S3 | No | No | Yes | |
| Azure DevOps | No | No | No | Collects images by taking screenshots of them in the Chromium browser. |
| Apache Superset | No | No | No | Collects images by communicating with the tool via API. |
| Databricks Lakeview Dashboards | Yes | No | No | Image collection and filter retrieval will function only when the warehouse is active on the Databricks side. Collects images by taking screenshots of them in the Chromium browser. |
| Domo | Yes | No | No | Supports getting images for the Dashboard, Card and App type Objects. Collects images by taking screenshots of them in the Chromium browser. |
| Dropbox Paper | No | No | ||
| FlexIt Analytics | No | No | Yes | Supports getting images for the Dashboard and Report type Objects. Collects images by communicating with the tool via API. |
| Google Data Studio | No | No | No | Collects images by taking screenshots of them in the Chromium browser. |
| Google Drive | No | No | Yes | Supports getting images for the File type Objects. Collects images by communicating with the tool via API. |
| Grafana | No | No | No | Supports getting images for the Dashboard type Objects. Collects images by taking screenshots of them in the Chromium browser. |
| Graphite | No | No | No | |
| HTTP Plugin | No | No | No | |
| IBM Cognos | Yes | Yes | Yes | Collects images by communicating with the tool via Cognos SOAP API. |
| Looker | Yes | No | Yes | Collects images by communicating with the tool via API. |
| Microsoft Power BI Cloud | Yes | Yes | Yes (Premium only) | By default, collects images by taking screenshots of them in the Chromium browser. Power BI Premium allows for collecting images by communicating with the tool via API. |
| Microsoft Power BI Report Server | No | No | Yes | Images, generated from Report type objects are collected by communicating with the tool via API. Images, generated from PowerBIReport type objects are collected by taking screenshots of them in the Chromium browser. |
| Microsoft SSRS | Yes | No | No | Collects images by taking screenshots of them in the Chromium browser. |
| MicroStrategy | Yes | Yes | Yes | Collects images by communicating with the tool via MSTR Web API. |
| MicroStrategy One | No | No | Yes | Supports getting images for the Dashboard and Vis type Objects. Collects images by communicating with the tool via API. |
| MI Portal Pages | No | No | ||
| Pyramid Analytics | No | No | No | Сollects images by taking screenshots of them in the Chromium browser. |
| Qlik Sense Cloud | Yes | No | No | Collects images by communicating with the tool via API. |
| QlikView | Yes | Yes | No | Collects images by communicating with the tool via QV .NET API. |
| S/FTP | No | No | ||
| SAP Analytics Cloud | Yes | Yes | No | Сollects images by taking screenshots of them in the Chromium browser. |
| SAP BusinessObjects | Yes | Yes | Yes | Collects images by communicating with the tool via API. |
| ServiceNow | No | No | Yes | |
| Sigma | Yes | No | Yes | Сollects images by communicating with the tool via API. |
| Splunk Reports | Yes | No | Yes | Supports getting images for the Dashboard and Report type Objects. Сollects images by communicating with the tool via API. |
| Tableau | Yes | Yes | Yes | |
| ThoughtSpot | No | No | Yes | Сollects images by communicating with the tool via API. |
| TIBCO WebFOCUS | No | No | No | Сollects images by taking screenshots of them in the Chromium browser. |
| TIBCO Spotfire | Yes | Yes | Yes | Сollects images by communicating with the tool via Tibco API. |
| Zendesk Explore | No | No |
2. Create a New External Report
Access + New > External Report > BI tool.
This example is using Qlik Sense as the BI tool. The configuration of External Reports is specific to each BI tool. Links to more specialized instructions based on a given BI tool can be found here: Metric Insights' Plugins
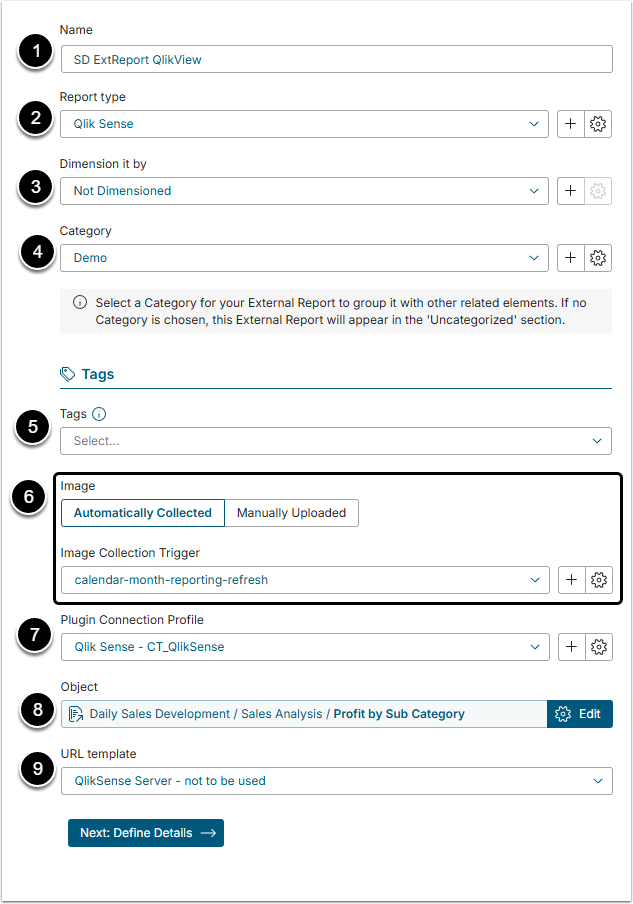
- Name: Define a unique and descriptive name for the Report. It is impossible to proceed to next step if the Report Name is the same as an existing one.
- Report Type: It is set automatically, according to the selected BI tool.
- For more information about Report Types refer to this article.
- Dimension it by: Optional. Choose a Dimension to be applied to the Report.
- Category: Choose the Category to place the Report into.
- Tags: Optional. Tags are used to relate Elements to each other for purposes of identifying and searching for similar Elements. For details refer to the Create a Tag article.
- Image: Define how the images of the External Report will be collected.
- Automatically Collected: It requires that a Report Image Trigger is set. It defines when the image is updated.
- Manually Uploaded: This means the Admin uploads the image manually.
- Plugin Connect Profile: Select the Data Source from which the information is collected.
- Object:Choose the source data/report from the plugin.
- URL template: It is set by default but the User can change the template is necessary.
- For more details, refer to the Understanding Plugin URLs article.
[Next: Define Details]
2.1. Info Tab
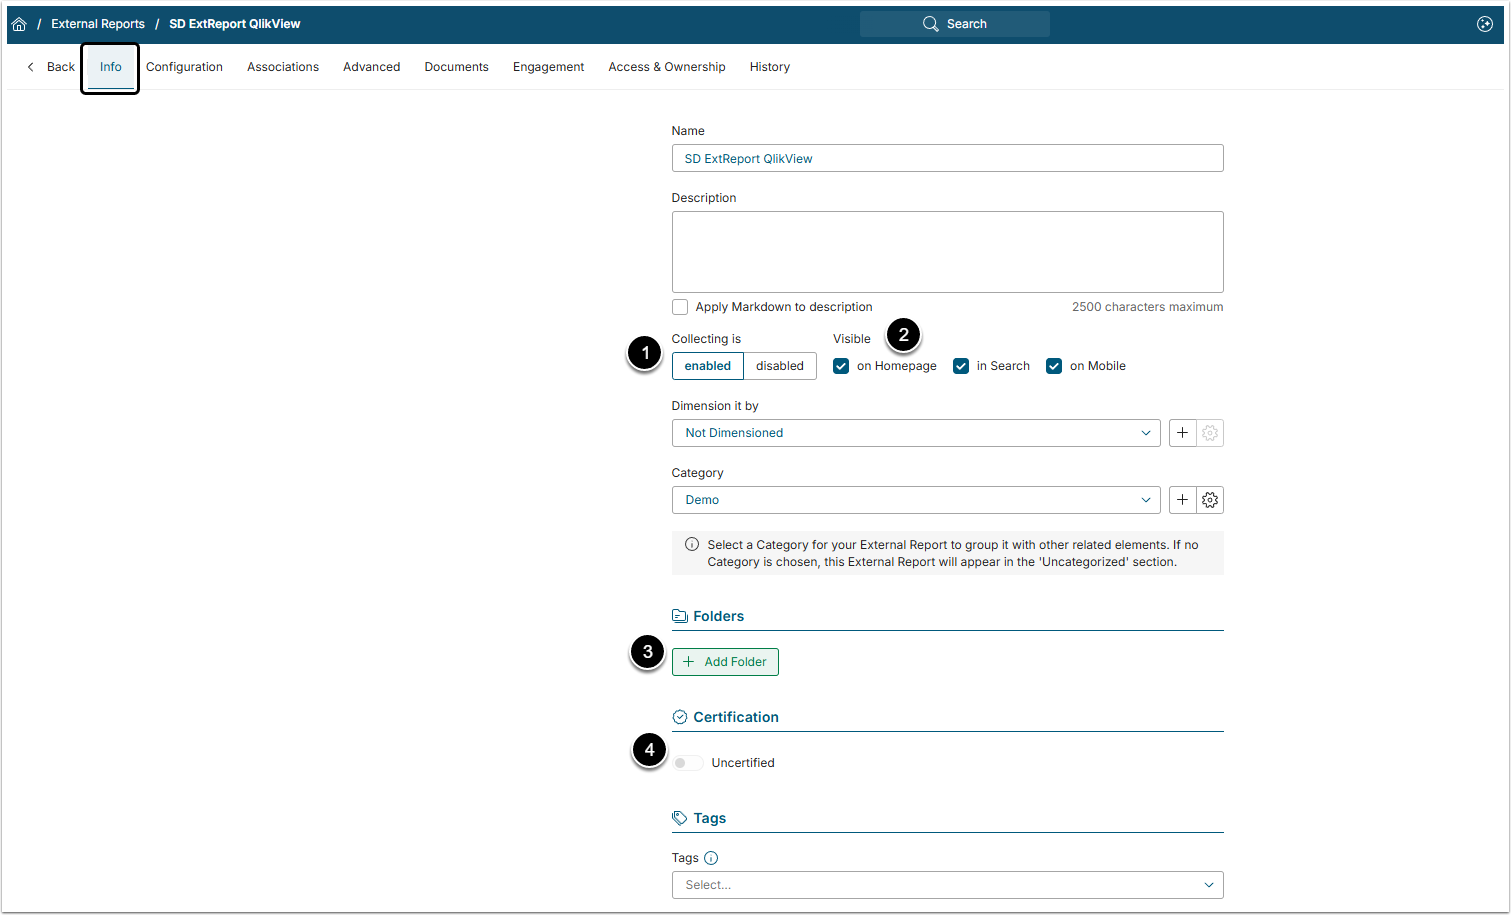
- Collecting is: New Elements will be "disabled" until you publish the Report.
- Visible: Define where the External Report will be visible. By default, Users can find newly created Elements via Search and on the Homepage.
- Disabling these check boxes makes the Element visible to the Admin and creator only.
- Dimension it by: If the Dimension is selected, a Do not apply Dimension naming template to External Report will appear. Activate it if you want to apply custom naming for Dimensioned External Reports.
- Folders: The User can add the External Report to the Folder here.
- Certified: Certification allows Admins and Power Users to identify Elements that have been validated and deemed accurate. For details refer to CertificationLevels for Elements article.
2.2. Configuration Tab
Its contents are based upon the specific BI Tool requirements. Below is an example using Qlik Sense.
2.2.1. External Report Type and Object Selection Sections
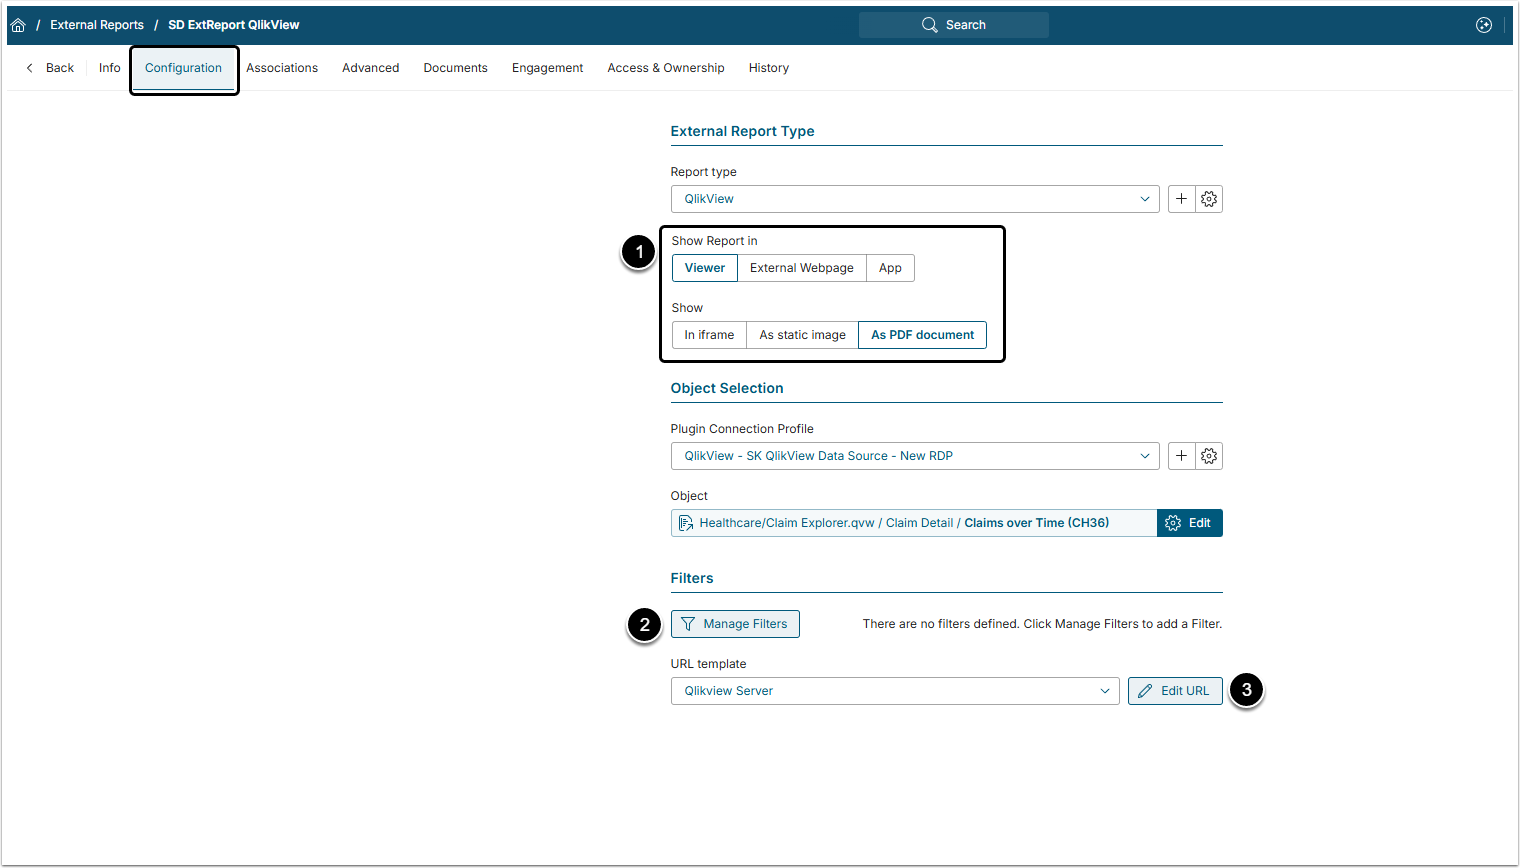
- Show Report in: Define where the Report will be shown
- Viewer: The External Report will be shown in the Metric Insights default Viewer. After choosing this option, define additional features:
- Choose between theiframe,static imageand PDF document.
- External Webpage: The External Report will be shown on the separate web page.
- App: The External Report will be shown on an App page. This option completely overrides the Viewer.
- Viewer: The External Report will be shown in the Metric Insights default Viewer. After choosing this option, define additional features:
- [Manage Filters] to apply Filters to this Report prior to collecting data, see Filtering in External Reports article.
- [Edit URL] to edit the URL and use the Popup to create a Custom URL and test your changes.
- NOTE: If in the External Report Type, the Auto Generate URL option is disabled, instead of URL Template field there will be a External Content URL field. Type the content URL there.
2.2.2. Image Collection & Display Sections
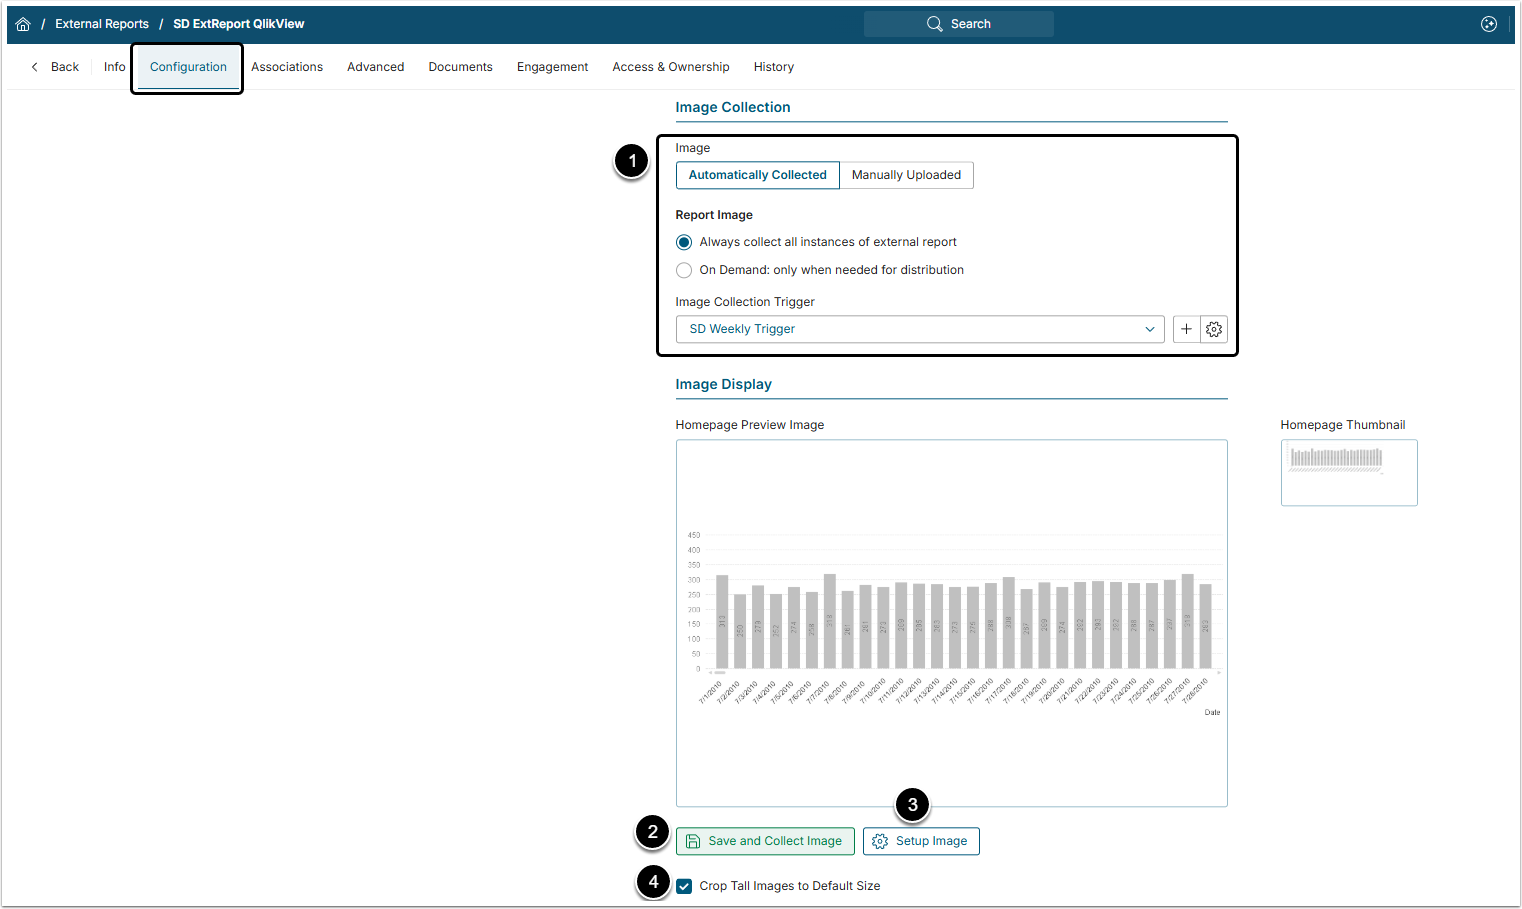
- Image: It can be "Automatically Collected", or "Manually Uploaded" by Admin .
- If "Automatically Collected" is chosen also define:
- Report Image: Either the data is collected automatically and according to the Report Image Trigger, or by demand.
- Report Image Trigger: Determines when and how often the data is collected.
- If "Automatically Collected" is chosen also define:
- [Save And Collect Image] to collect the data, set the image and save it.
- [Setup Image] to change the Homepage's preview image height and width. For more information, refer to Understanding Setup Image article.
- Crop Tall Images to Default Size: If the image is tall, it would look clumsy on the tile. Enable this check box to crop it.
Image Collection section looks differently if the Report Type of External Report uses "PowerBI OAuth" Drill-Down Authentication. In this case every User has a token, generated on Power BI side and the system uses it to define what image the User sees.
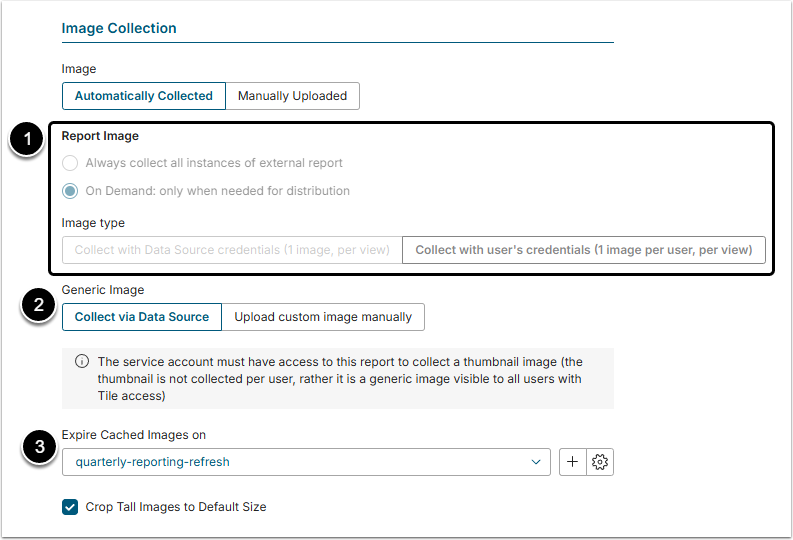
- Report Image and Image type are set automatically and can't be changed.
- Generic Image: Define how the Tile thumbnail is collected:
- Collect via Data Source: The Tile's generic image will be generated using a default picture of the Report.
- Upload custom image manually: The system will use a manually uploaded image as Tile's generic image.
- Expire Cached Images on: Select a Trigger to expire cached images.
2.3. Advanced Tab
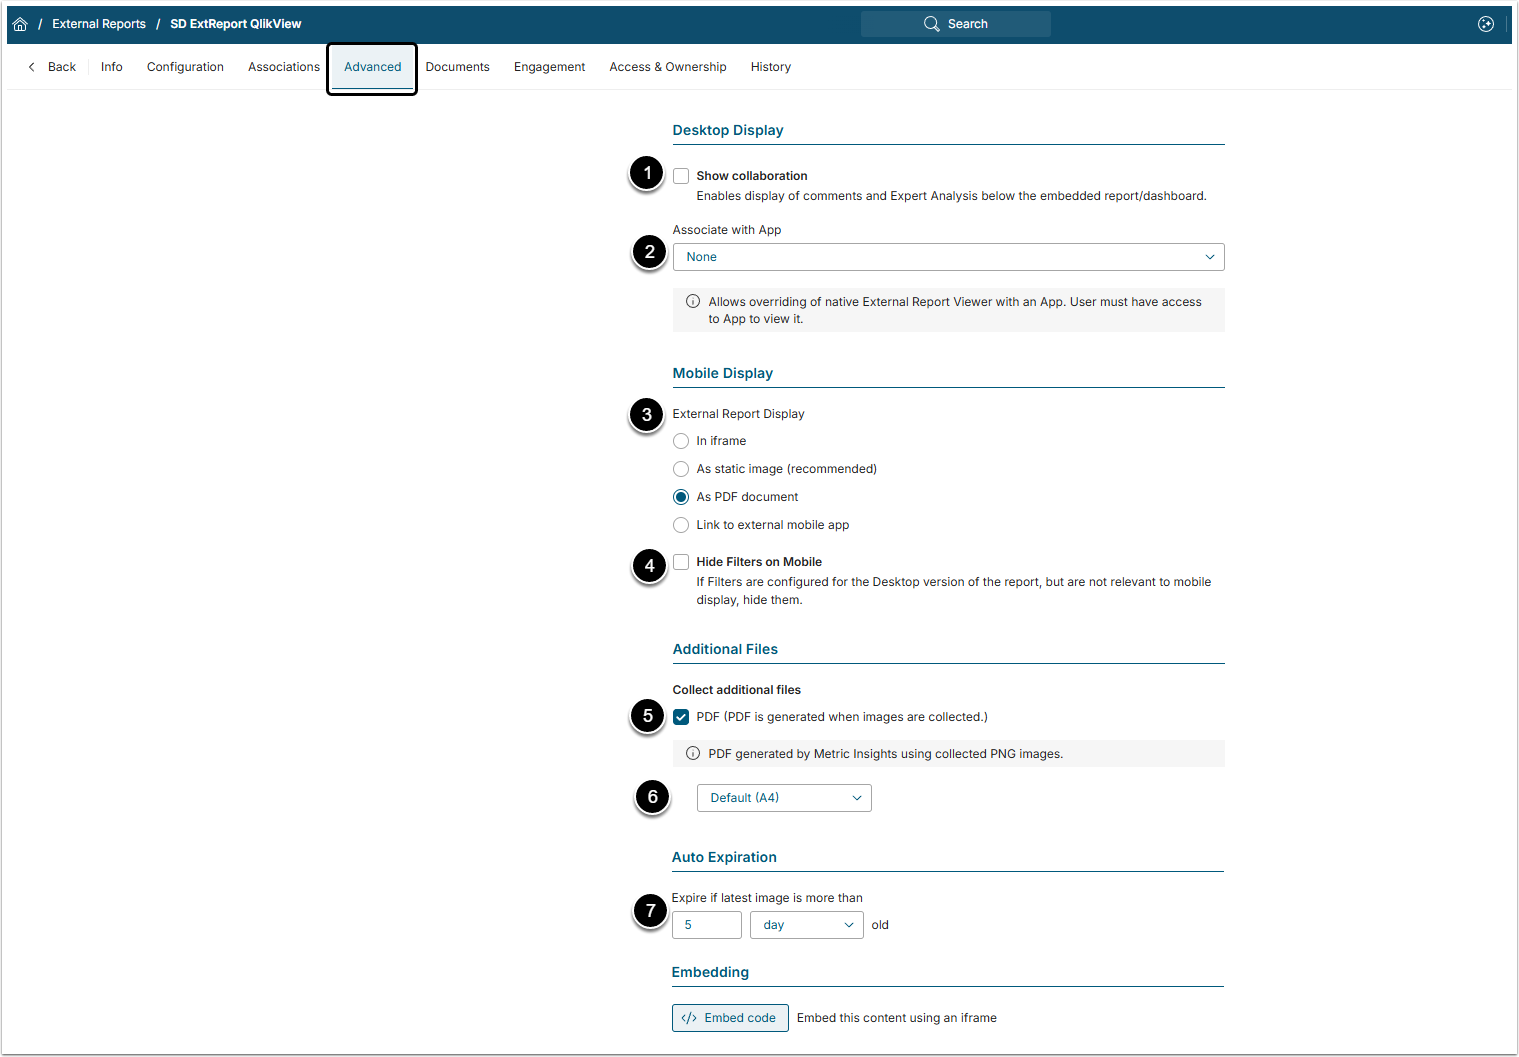
- Show collaboration: Enable this check box to allow users leave Comments to the Report tile.
- Associate with App: If the user want to display external Report in the App instead of the Viewer, here it can be set. The App chosen in this field overrides default Viewer look.
- External Report Display: Define how the External Report should be shown in mobile.
- Hide Filters on Mobile: Activate this checkbox to hide the Filters in mobile version.
- Collect additional files: To generate a PDF or CSV file after collecting the data, enable corresponding check box.
- PDF page format: If the "PDF" check box is enabled, choose the page format for the file
- Expire if latest image is more than: Set when tile will display "Expired" marker basedon the age of the image
2.4. Individual Plugin Differences
Domo External Reports can be created from Cards, Dashboards, and Apps objects and can be viewed in Viewer, regardless of the option selected in Show Report in field. For this, embedding must be enabled on the Domo side for each individual Card/Dashboard/App.
NOTE:Pages cannot be embedded in Metric Insights. To embed a Page, convert it into a Dashboard on the Domo side first.
Access the Card/App to be used as an Object for External Report
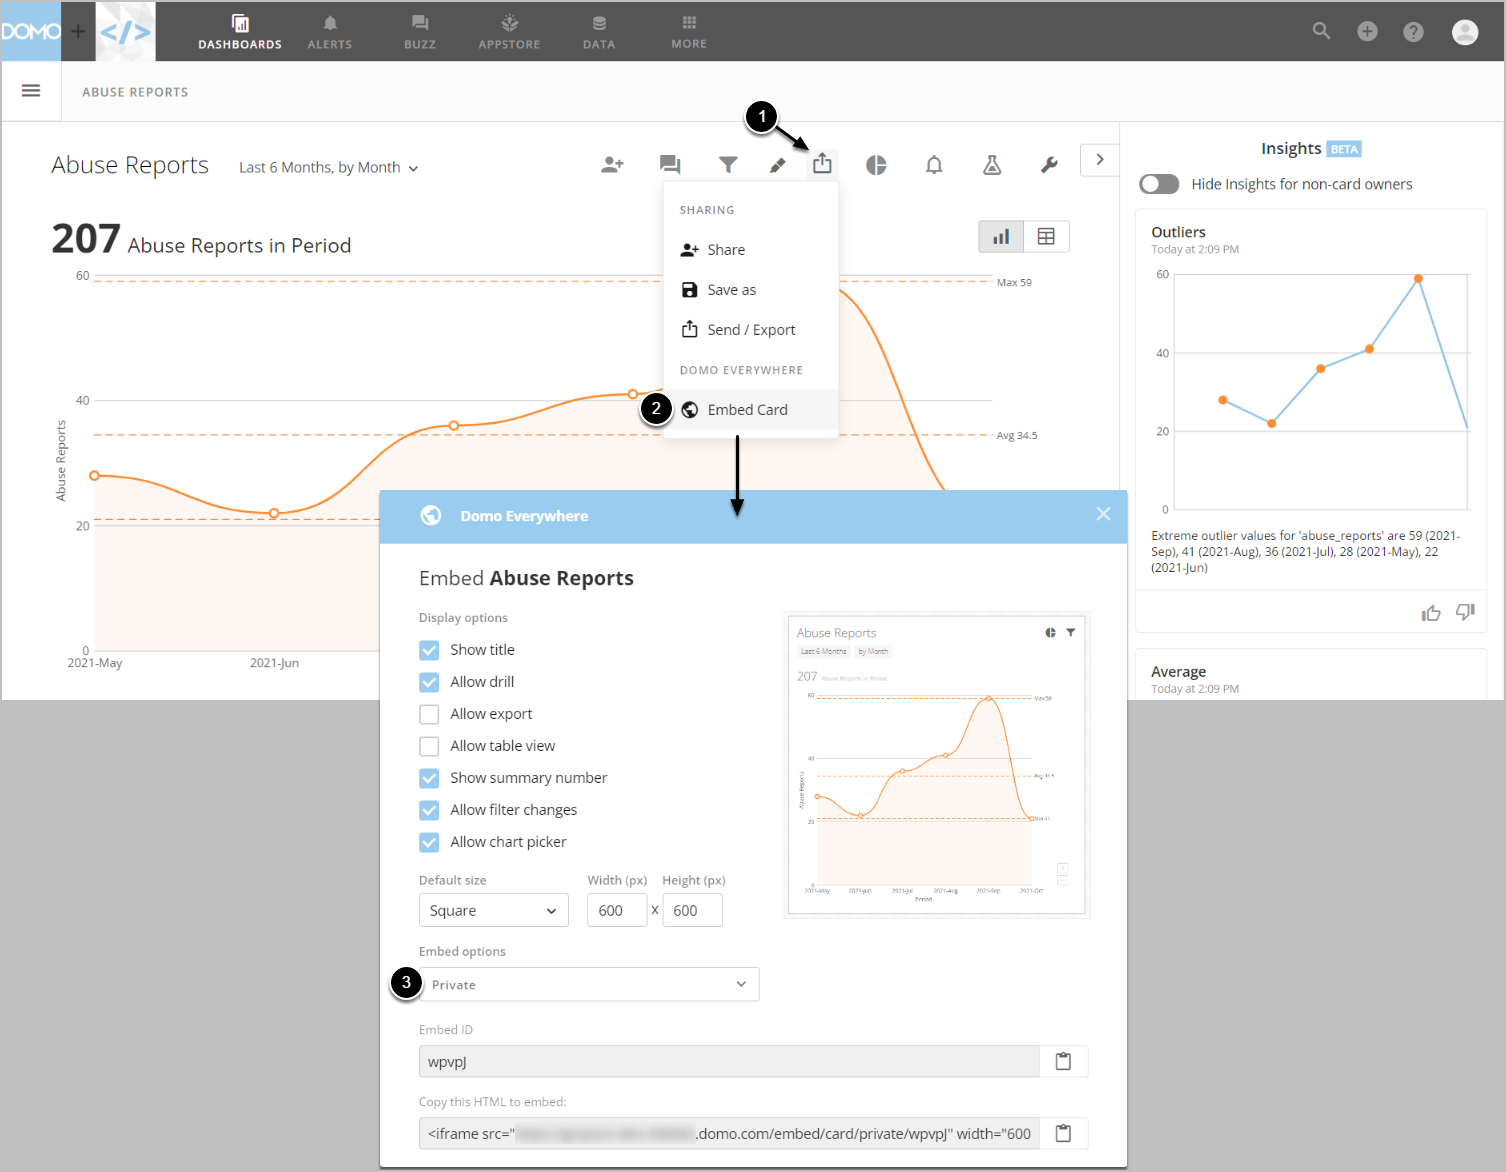
- Access Share
- Go to Embed Card/App
- Set Embed options to "Private" or "Public"
- "Private" would require a user to enter the credentials to Domo
Access Domo Home
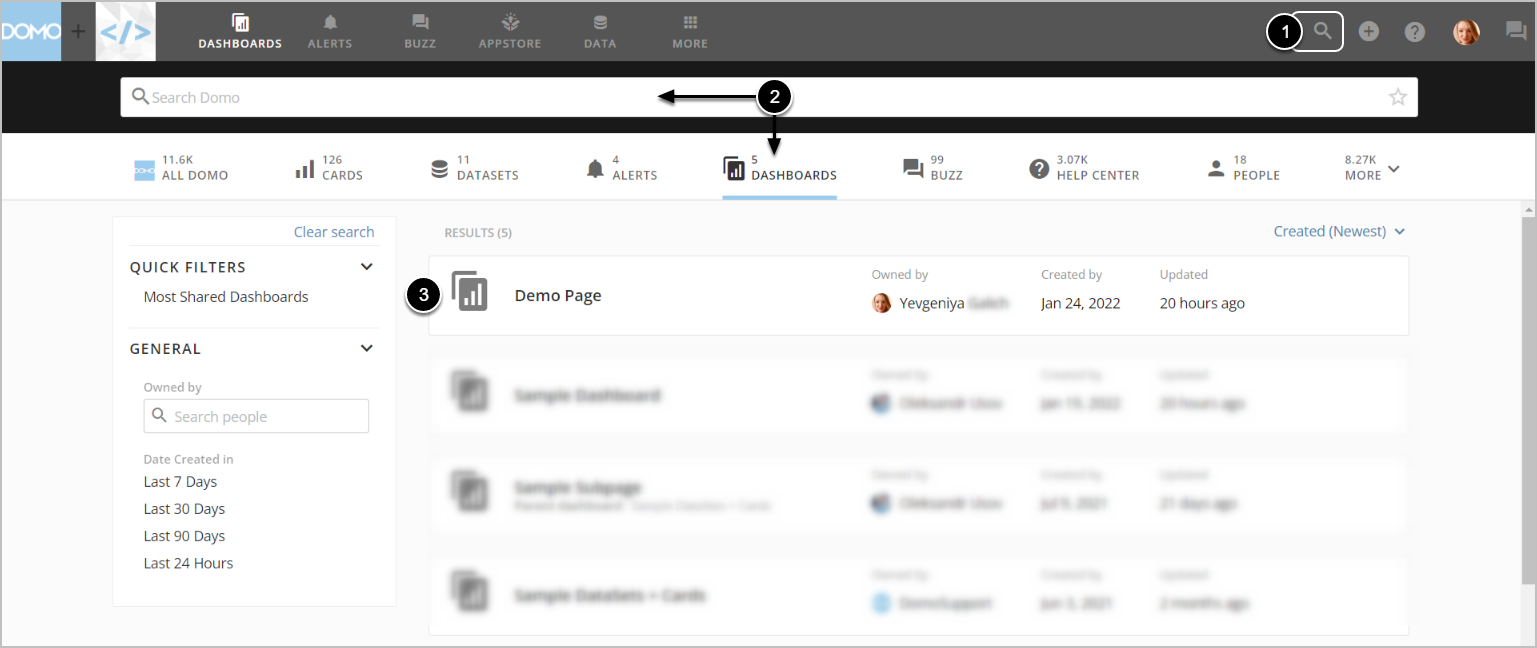
- Access Search
- Select DASHBOARDS or find the Dashboard in search
- Access the Page to be converted
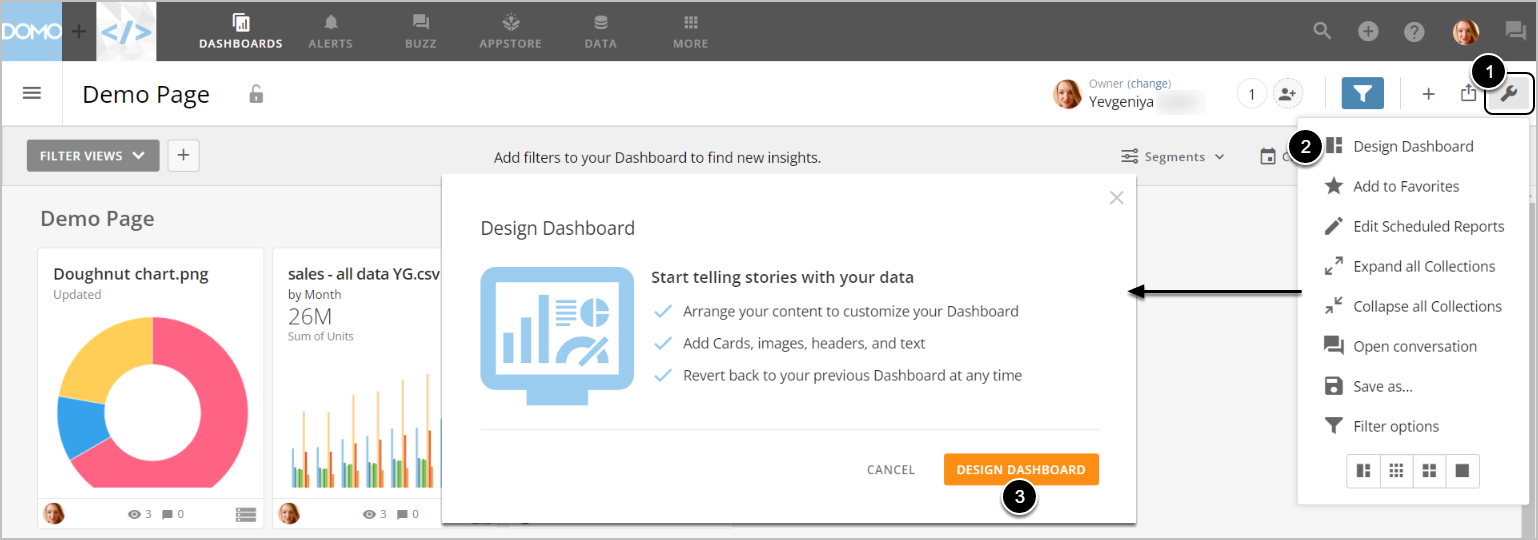
- Access the Edit menu
- Choose Design Dashboard
- [DESIGN DASHBOARD]
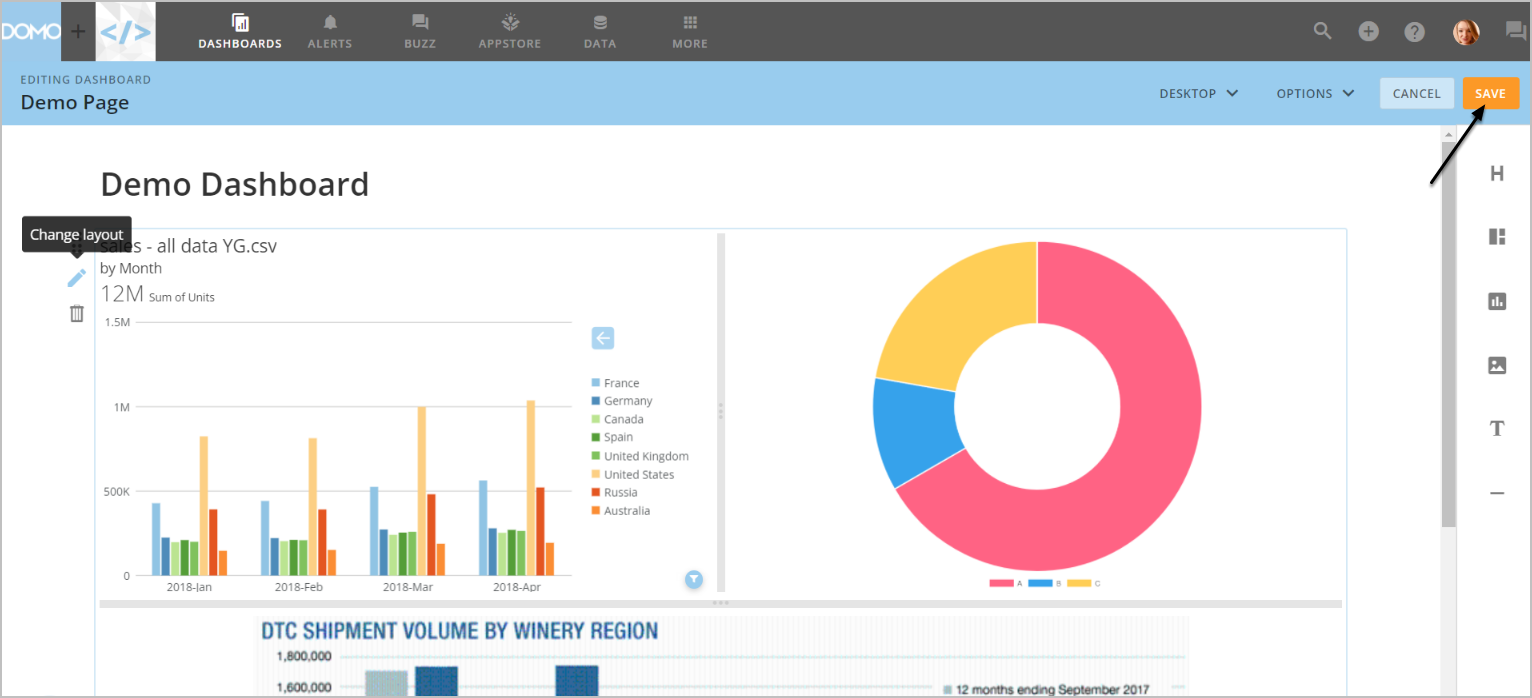
Apply changes, if needed, and [SAVE]
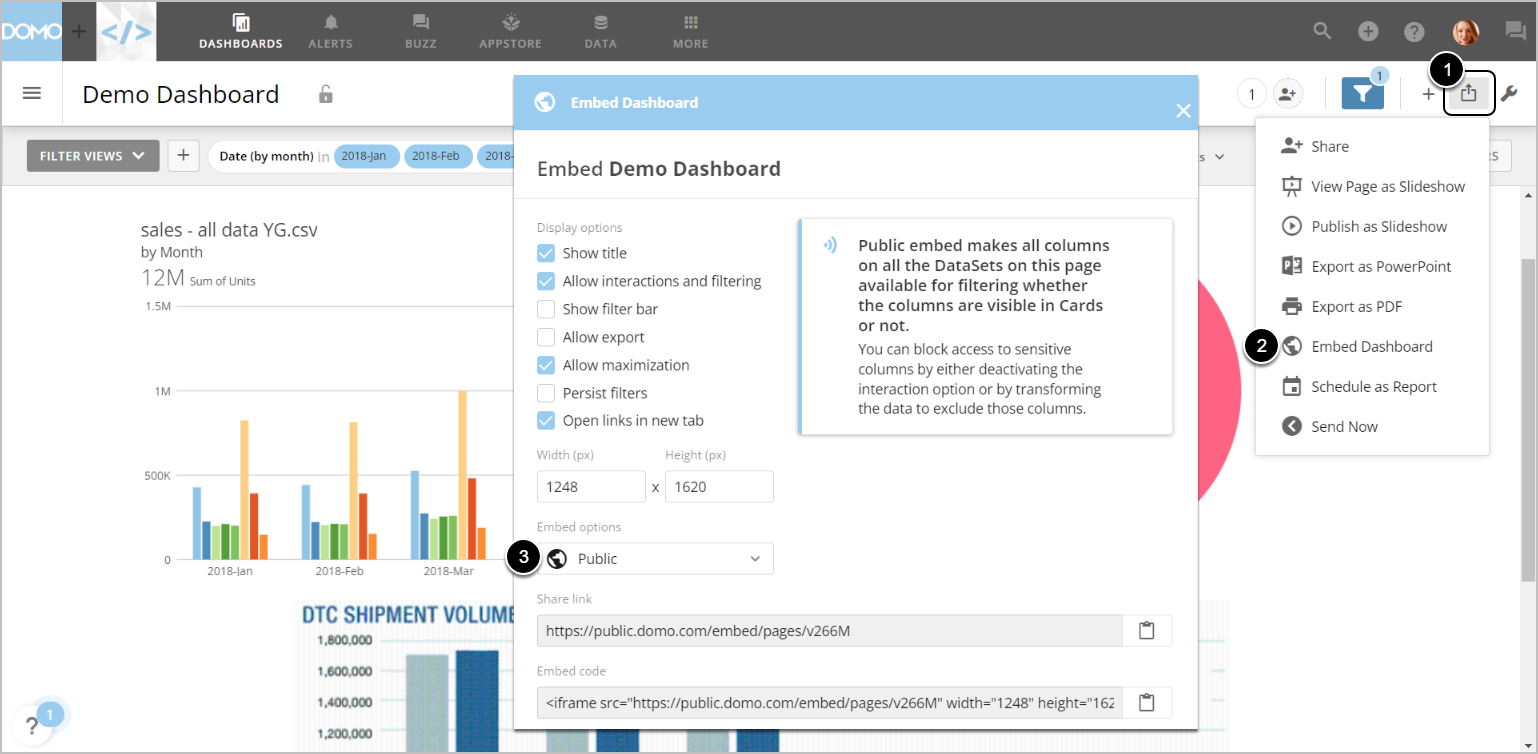
- Access Share
- Go to Embed Dashboard/App
- Set Embed options to "Private" or "Public"
- "Private" would require a user to enter the credentials to Domo
To make embedding possible, enable embedding on the plugins side first.
Also, don't forget to enable View assess.
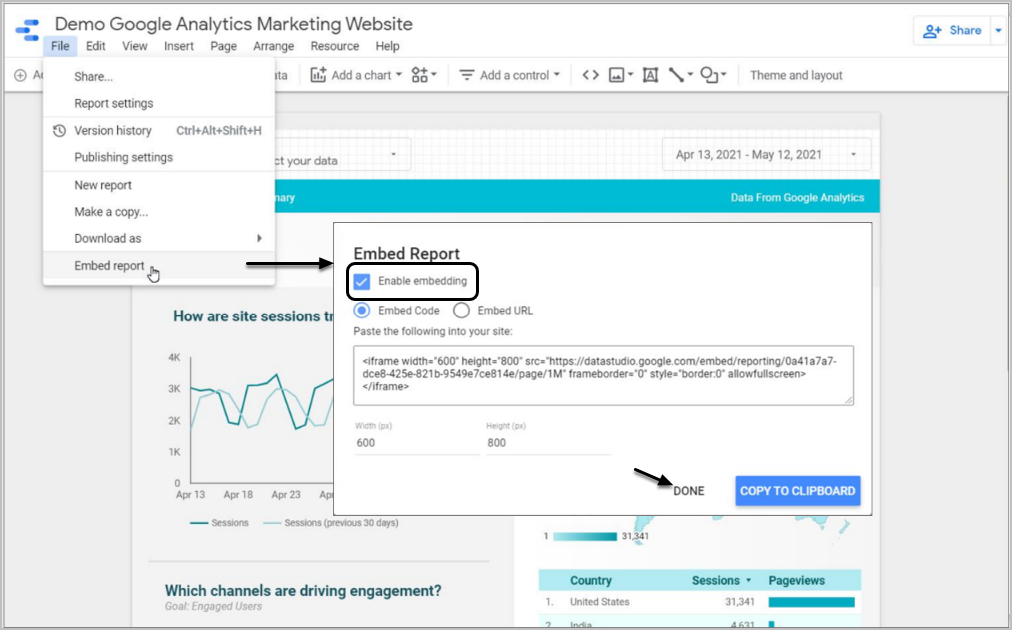
- Access File (or Share drop-down) > Embed report
- Check Enable embedding and click [DONE]
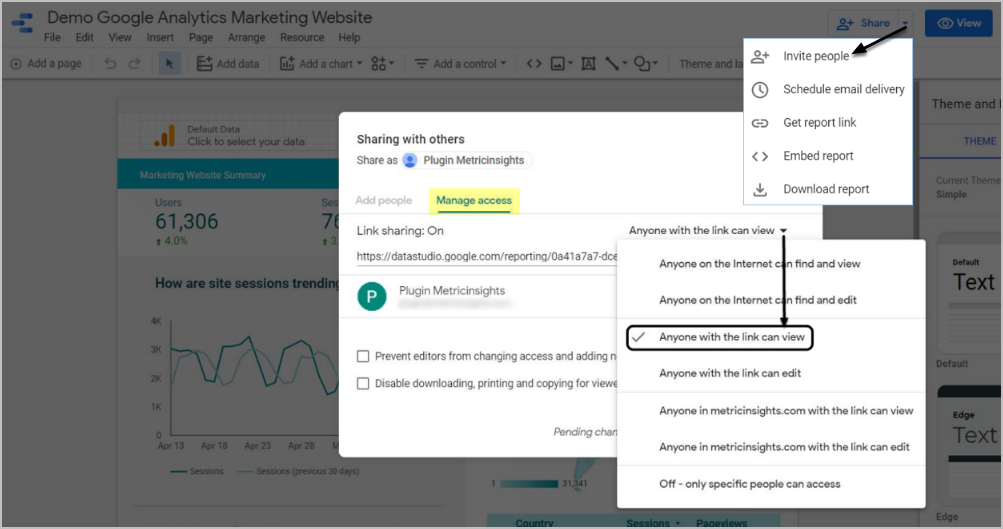
- Access Share drop-down > Invite people
- Go to Manage access tab
- Set Link sharing to Anyone with the link can view and [Save]
Looker Plugin supports getting images for the following objects:
- Dashboards
- ML Dashboards
- Looks
- Dashboard elements
- ML Dashboard elements
Looker Plugin supports getting PDFs for the following objects:
- Dashboards
- ML Dashboards
For more details check the Create an External Report from Microsoft Power BI Cloud article.
When opting to display your Report as aStatic Image, make sure youCollect Imagebefore going to Viewer.
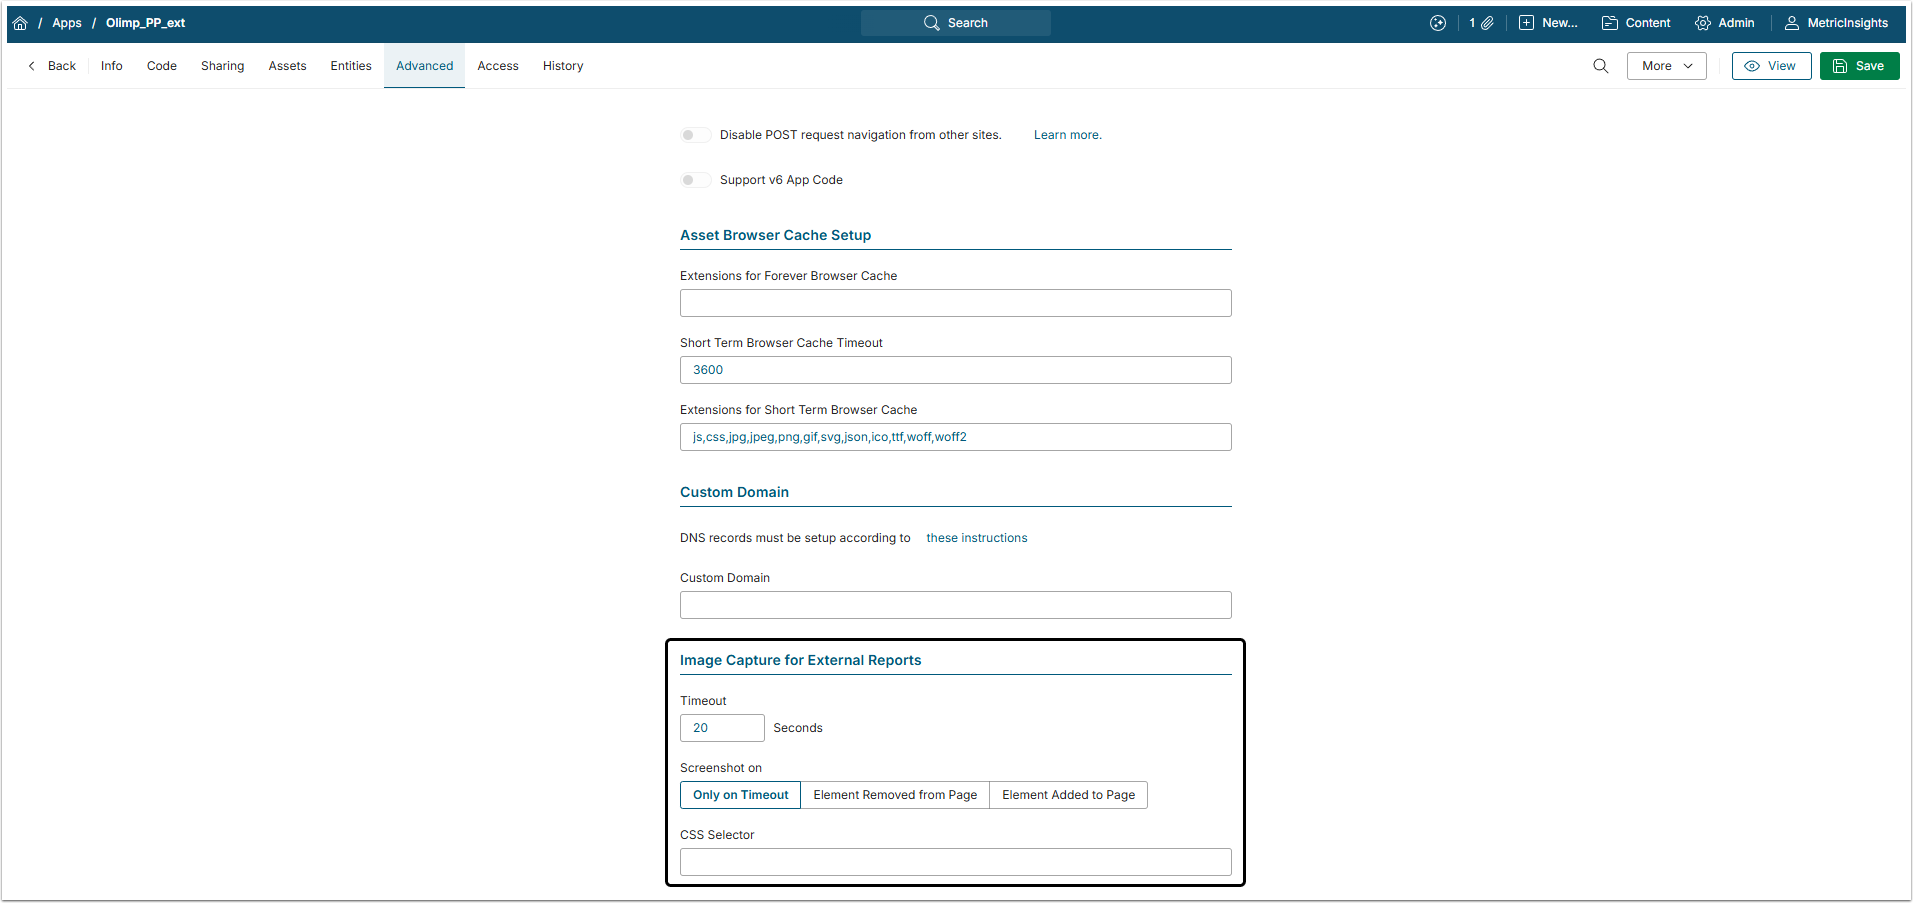
For image collection, you can decide when the system should take a screenshot of App or how much time an App can take to load before the system takes a screenshot of the page.
This functionality is configured individually for each App inApp Editor Advanced Image Capture.
NOTE: Be aware, that Image Capture section will appear only in the Apps that were created without a template after enabling Can be used as External Report checkbox on the Info tab.
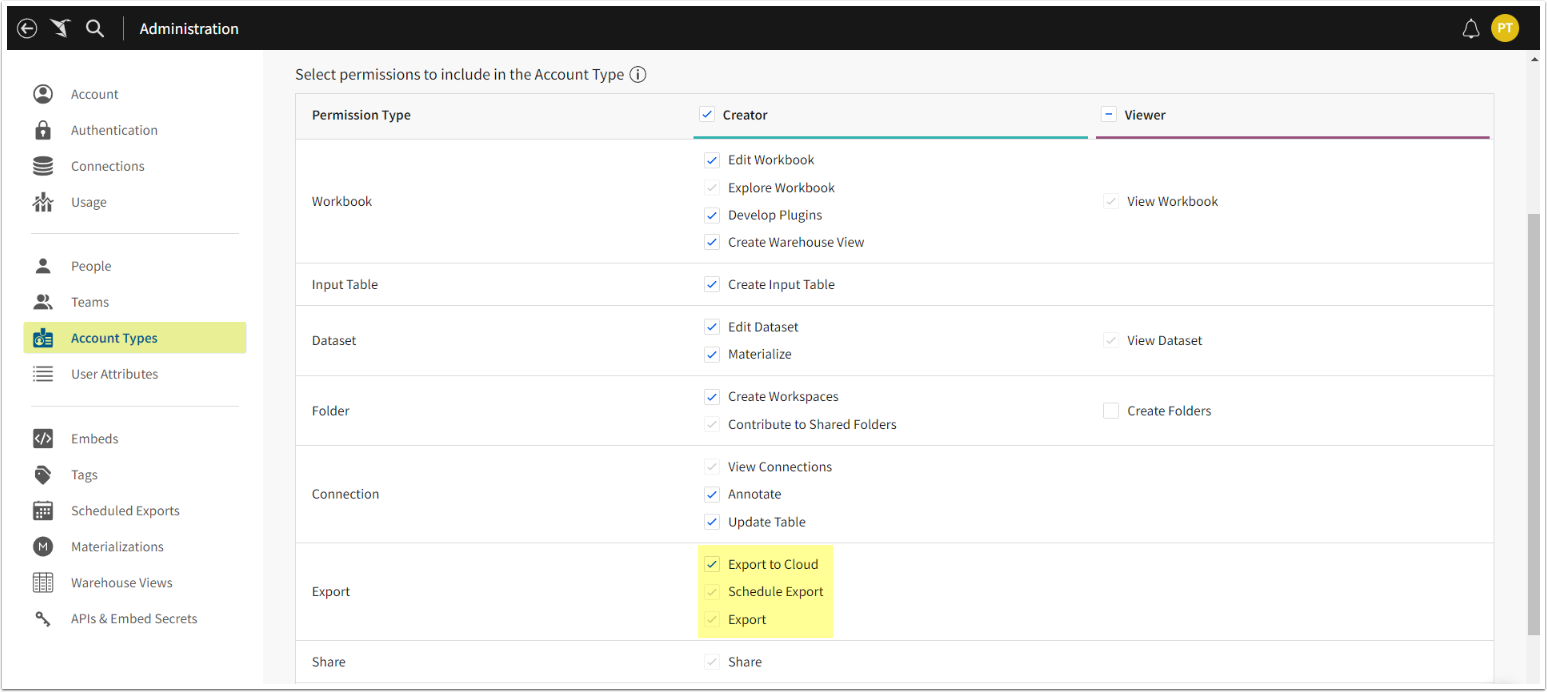
The user account associated with the API Token must have Export permissions to be able to create objects from Sigma workbooks, workbook pages, or workbook elements in Metric Insights.
These permissions can be enabled under Administration > User Types.
See detailed descriptions in Create External Report from Tableau and Create Dimensioned External Report from Tableau articles.
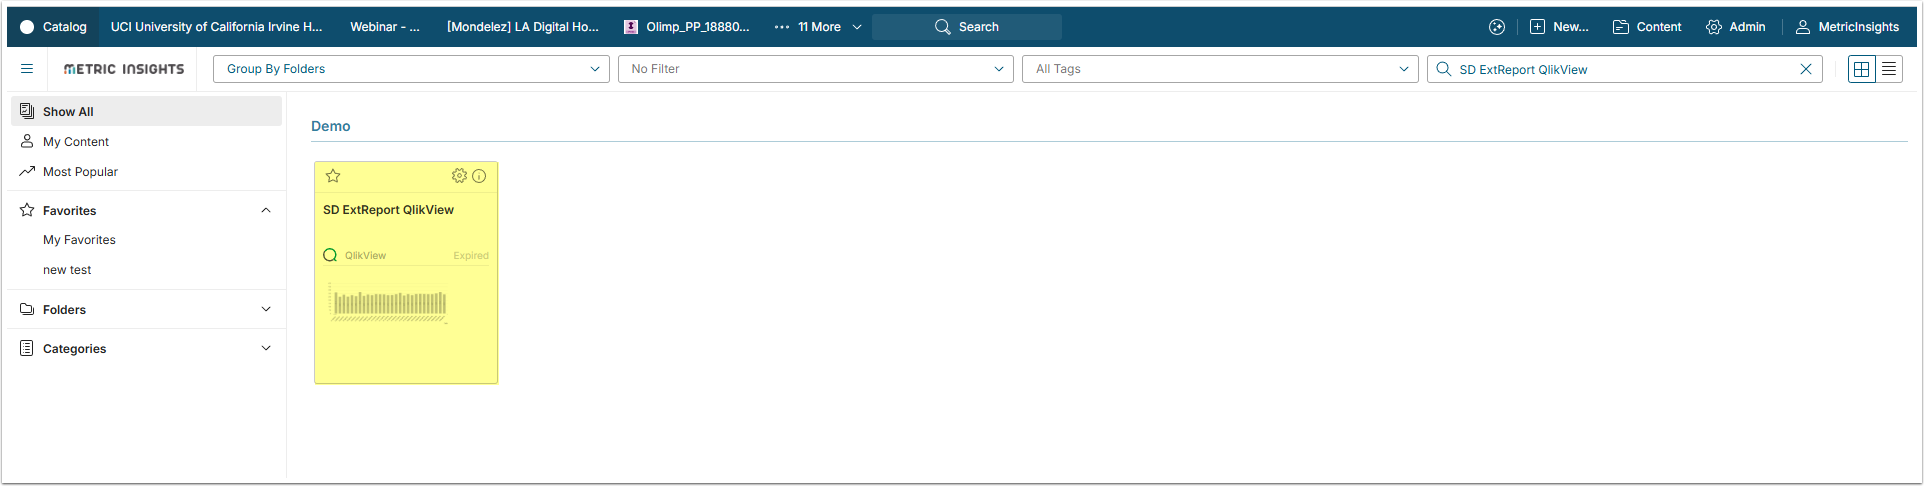
3. End Result
Once External Reports are created, a User will be able to seamlessly link to a variety of relevant reports from their personal list of Favorites or Categories to which the User has access.
4. Importing/Exporting of External Reports
External Reports are Imported and Exported the same way as the other Elements, but there are some special features:
- When the User migrates an External Report to another instance, the path to the Object from which the External Report was created can change. That's why the URL (to see it, click [Edit URL] in the Object Selection section of the Configuration tab of the External Report Editor) is re-generated after importing.
- The Manually Uploaded image is included in the migration with the External Report.